The Exponential Nature of Offense

The Dodgers havea great offense, but perhaps they should add even more weapons (via Keith Allison).
Baseball has countless old sayings, some of them accurate. One of those sayings is “hitting is contagious.” The spirit of this saying has to do with a lineup getting hot at the same time during a season, or creating a rally during a game. In those contexts, the saying may or may not be true (an article for a different day, perhaps), but I submit that offense is contagious in a general sense. Good offenses are better than the sum of their parts – one and one equaling more than two.
The exponential nature of offense means a good hitter in a good lineup is worth more than that same hitter in a bad lineup. On a good offense, that hitter is more likely to come to the plate with more runners on, more likely to get driven in once he’s on base. And, the lineup turns over more often, meaning he gets more plate appearances. Not only is he more valuable to a good lineup, but he’s even more valuable to a better one – the effect builds on itself.
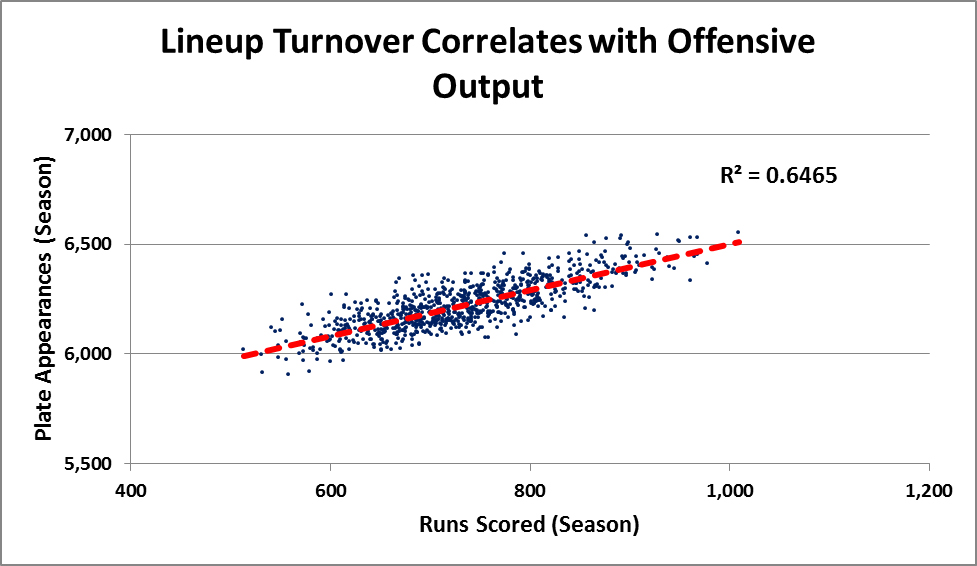
The lineup-turnover part of this effect can be seen in the below graph, where plate appearances and runs scored go hand in hand for all teams (that played 162 games) between 1973 and 2013.
Scoring more runs has always been preferable to scoring fewer, so why does this matter? How could a team use this information to its advantage? Consider this: Offensive statistics, even advanced ones, are built on linear models. This means there are blind spots, where the stats over-or-underestimate actual production. An innovative team could take advantage of this fact, and pay less than market value for offensive production.
Proof That Offense Is Exponential
First, let’s look for the mathematical evidence that offense is non-linear. This is probably the boring part, but it needs to be done.
One way to examine the relationship between offensive talent and offensive production is to find the elasticity between the two variables. Taking every team between 1973 and 2013, I created a model with the natural log of runs scored per game as the dependent variable and the natural log of weighted on base average (wOBA) as the independent variable. I also included base running value per game (BsR/G) as an independent variable to control for running skill, since wOBA doesn’t account for anything on the base paths. The coefficient of the Ln(wOBA) variable represents the elasticity between offensive skill, as measured by wOBA, and production, as measured by RS/G. There are three possibilities for the coefficient in question:
- The coefficient is less than one, meaning there are decreasing returns to scale – increasing wOBA by 10 percent will lead to fewer than 10 percent more runs scored.
- The coefficient is exactly one then there is a linear relationship – increasing wOBA by 10 percent will lead to 10 percent more runs scored. If wOBA were a perfect measure of production for every team, this would be the case.
- The coefficient is greater than one, meaning there are increasing returns to scale -– increasing wOBA by 10 percent will lead to more than 10 percent more runs
You guessed it, the coefficient falls into the third group. The regression results are below:
| Regression output, predicting the natural log of runs scored per game |
|---|
| Predictor | Coefficient | T-Score |
| Constant | 4.1331 | 149.6 |
| Ln (wOBA) | 2.3342 | 95.5 |
| BSR/162 | 0.0014 | 8.7 |
The coefficient is 2.33, which can be interpreted as a 10 percent increase in wOBA will result in 23 percent more runs scored per game. The evidence of an exponential relationship is clear, and large enough to be significantly different from the linear trend.
wOBA Isn’t Wrong, But It Isn’t Perfect
One of the jobs of advanced statistics is to remove context – to measure a player’s skills independent of his team, park, league, etc. This helps to evaluate a player’s true talent level and create statistics which are more predictive of future performance.
Weighted On Base Average is probably the most accurate measure of offensive production ever created. There have been some great articles written on the merits of wOBA, including a primer here, and a recent Hardball Times article here.
Simply put, wOBA does an excellent job of measuring the quality of an offense. Plotting team wOBA against the team’s runs scored per game for every team between 1973-2013 yields the linear-looking trend below.
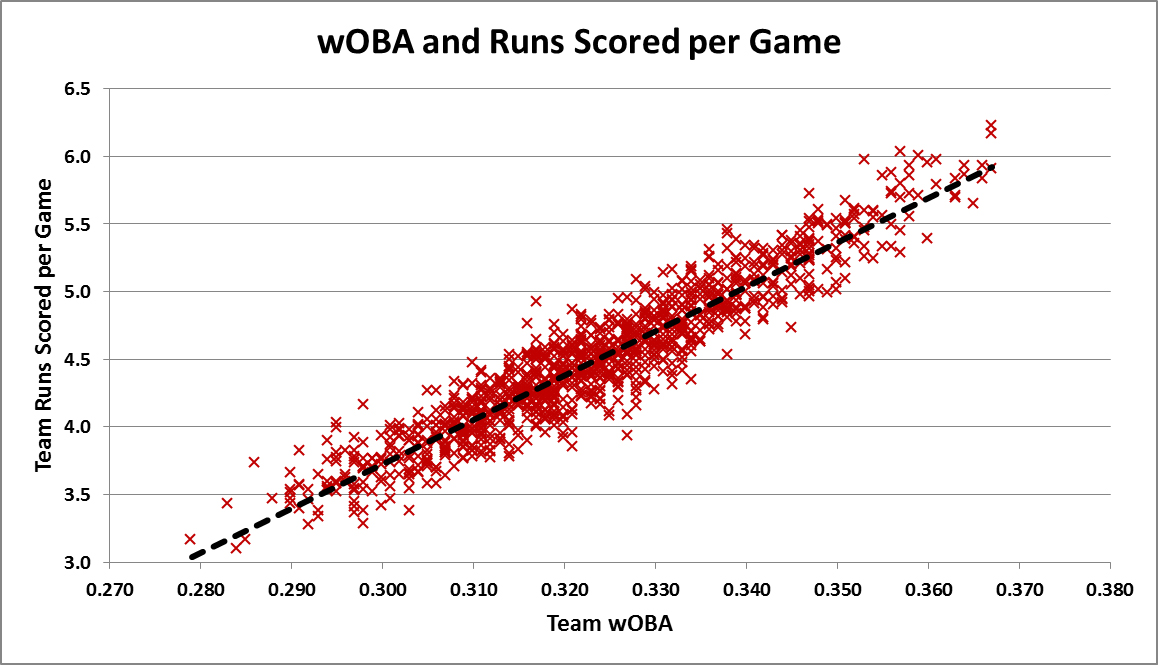
This is the same data I used in the model earlier. You might be asking yourself, “Where is the exponential shape?” Although the trend looks linear, it actually is slightly curved. Discerning viewers might be able to see how the linear trend line cuts below the majority of points below .300 wOBA and above .350.
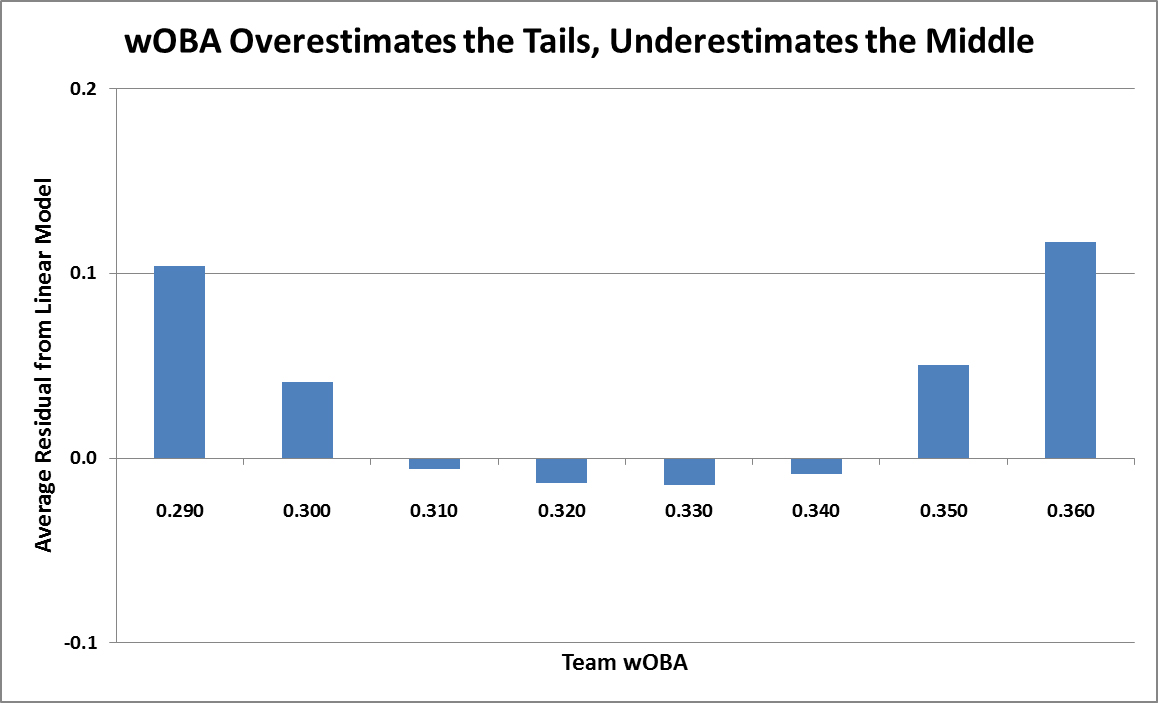
It is easier to see this effect more obviously with a different graph. This time, I ran a purely linear model with RS/G as the dependent variable and wOBA and BSR/G as the independent variables. I then examined the residuals of that model (the difference between the actual and predicted values of RS/G). I created groups of similar teams, those who had the same first two digits of wOBA (.310s, .320s, .330s, etc.). If the offensive effect is truly linear, then the residuals should sum to about zero for each group. As you can see in the graph below, they do not.
Why? wOBA is calculated using the average run value of an event – the average single, the average double, etc. Doing so strips out the context of the team involved in the event. This is not a flaw; it is exactly what wOBA is designed to do. However, it forces a linear relationship where one does not necessarily exist.
Going back to the above graph, you can see the groups at the top and bottom of the spectrum are underestimated by about one-tenth of a run per game, and the teams near the mean are overestimated by about one-hundredth of a run per game. Why less in the middle than the ends? There are more teams there. Offense in baseball follows a normal distribution, where there are more teams near the average and fewer teams on the extremes. Since there are more teams near the middle, the linear trend fits those teams closer.
This graph likely raises another question: why are both tails underestimated? If offense is exponential, shouldn’t it overestimate the low end and underestimate the high end? The answer is similar to the one in the last paragraph. If you think about a curve, a straight line can estimate only one section of it well. Since teams are bunched in the middle, that is where the line gravitates toward. If, for example, teams were bunched at the low end of the spectrum, then the linear trend would fit that section better, and the middle and upper parts of the spectrum would be underestimated.
Over 1,000 words of explanation leads to this: a team with a .365 wOBA would be predicted to score about 5.85 runs per game, but will actually score about 5.93 runs per game. On the low end, a team with a .285 wOBA would be predicted to score about 3.24 runs per game, but would instead score about 3.33 runs per game. Those are small differences, but remember that baseball has the longest regular season of all major sports. A difference of .09 runs per game equals about 14.6 runs per season, or about one-and-a-half wins. If one team is using the accurate exponential model, while all others value talent using an “incorrect” linear model, it would equate to over $10 million of value for a team on either tail of the spectrum.
Of course, wOBA is not the only statistic that teams use. A stat such as wRC+ is better than wOBA at discovering a player or team’s true talent level, because it is park and league adjusted. However, wRC+ is also based on the linear weights, which use average event values, meaning it will have the same fitting problem that wOBA has – underestimating the tails, overestimating the middle.
How Can a Team Take Advantage?
The results of this analysis mean teams should stop trying to be well-rounded. Today, when a team has a good offense, it usually targets pitching, and when it has good pitching, it usually targets hitting. This is inefficient. Even if the linear trends were completely accurate, teams should be indifferent between a run saved and a run scored. This analysis suggests that a team with good hitting should not only be indifferent, but should actively target more offense.
Here’s where things get a little theoretical. The highest team wOBA in the past 40 years is .367, accomplished by the 1996 Mariners, the 1996 Indians and the 1999 Indians. These teams benefited from about .1 runs per game due to the exponential effect – in excess of the “sum of the parts.” One wonders about a team that went all-in on this strategy and devoted all its resources to offense. It would help if the team played in a hitter’s park as well. If this theoretical team (I’m looking at you, Rockies and Rangers) could push its wOBA to .375, it would yield about .15 surplus runs per game, worth 2.5 wins over the course of a season, or about $17.5 million in value.
The other possibility would be a team going the other direction, using all its resources on run prevention, and embracing a terrible offense. This would lead to a similar surplus over market value, about .1 more runs per game than market price, but teams at that end of the spectrum are not buying free agent hitters anyway, so market value does not apply. Further, it would mean allocating more resources toward pitching, which has proven to be a risky investment.
The biggest conclusion from this analysis is to remember that context matters. Advanced statistics strip away context, which is critical to evaluating players, but it does not mean these stats should always be viewed in a vacuum. Just as a win is more valuable to a team in the middle of the win probability curve, a hitter is more valuable to a team that already has a good offense.
The debate over how best to measure offense is far from new. There have been countless articles written touting the benefits and pointing out the errors of linear weights, runs created formulas, and other methods. I’d encourage anyone to read further these topics here, here and here. The key takeaway from this article is to remember that context matters. When evaluating the value a hitter can bring to a team, the quality of the team’s offense should be a factor, just as is how a park’s dimensions might affect that player.
“Just as a win is more valuable to a team in the middle of the win probability curve, a hitter is more valuable to a team that already has a good offense.” – yes, and so we should also state a corollary; increasing runs does not increase wins linearly. A team going from a wOBA of .360 to .370 in a high-offense environment may not add as many wins as a team adding 10 pts of wOBA with good pitching.
This is true. From Jesse’s regression I calculate the following R/G:
.320 wOBA = 4.36 R/G
.330 wOBA = 4.69 R/G
.360 wOBA = 5.75 R/G
.370 wOBA = 6.12 R/G
So the high-scoring team gains 0.37 R/G from a 10 point wOBA jump compared to 0.33 R/G for the low-scoring team. If we put these numbers through the basic Pythag equation to get winning percentage against a .320 team we get:
.320 wOBA = .500 WP (obviously)
.330 wOBA = .536 WP
.360 wOBA = .635 WP
.370 wOBA = .663 WP
So the high-scoring team gains .028 winning percentage compared to .036 for the low-scoring team: there are diminishing returns to run scoring against a given opposition. If instead we look at two teams with a .500 winning percentage, one with .320 wOBA against .320 wOBA opponents and the other with .360 wOBA against .360 wOBA opponents, and then add 10 points of wOBA to both:
.330 vs .320 = 0.536 WP (as before)
.370 vs .360 = 0.531 WP
So the .360 wOBA team gains more runs per game but fewer actual wins.
Is there reason to believe that the relationship between wOBA and runs scored in really exponential rather than quadratic or some other polynomial? Logically an exponential relationship would require a negative constant (i.e. runs = wOBA^a – b, b > 0) otherwise you’ll still have a positive number of runs scored even with zero wOBA.
Oh wait, if I’m understanding the result of your regression correctly, and ignoring base running, you have:
ln (R/G) = 2.3342 ln(wOBA) + 4.1331
which gives:
R/G = e^4.1331 X wOBA^2.3342
= 62.4 X wOBA^2.3342
i.e. it is a polynomial rather than an exponential relationship.
Two questions:
1. You said your formula shows that a 10% increase in wOBA gives a 2% increase in RS/G. Do you mean 25% rather than 2%? (1.1)^2.3342=1.249
2. Why didn’t you prepare a log-log plot of Team Runs Scored per Game vs. Team wOBA, rather than a linear plot? Wouldn’t that would help you make your point with far fewer words?
Wow, this has been exactly what the Giants had been doing from 2009-2012, for the most part, building up their pitching at the expense of the offense, winning with very low run prevention (top 3 generally in MLB) while also having poor offenses as well.
Then as their offense got better, with the development of Belt and Crawford, to go with Posey and Sandoval, they added offensive pieces in Pagan, then Scutaro and Pence, in 2012, and now Morse in 2014, duplicating the exponential effect as per this study.
There is also an exponential effect, as shown by Pythagorian, where for every 0.1 runs you can reduce your RA, to win the same number of games, the RS is reduced by 0.11 runs, meaning your offense is that much more effective in winning. Of course, that means the opposite too, as RA rises, you need even more offense to win the same numbers of games, that is, RA rising 0.1 runs means your RS has to rise 0.11 runs, making your offense less productive in winning.
Combining these two effects, it looks like it is best to focus on a RA productive team, particularly on a rebuild level, first, then once you get there, you do what you can for your offense, but if they should mature and develop to become average, it pays to accelerate it to being above average because of this exponential effect found by your study. And that is basically what the Giants did from 2009-2014.
It validates the Giants focus on pitching in the draft even as their offense was stagnant and poor, picking up Bumgarner, Wheeler, Stratton, and now Beede, in the first round, and basically spending the vast majority of their first round bullets on pitching. It also validates the Giants spending more money on relief pitching, for which they were pilloried on Fangraphs for doing, because it is efficient economically to keep your RA down to the extremes. Same for starting pitching as well.
Great points. I also have to think the Giants are very wise to focus on a pitching-first development philosophy because of the ballpark they play in. You increase the odds of both keeping your own pitching talent past free-agency as well as the odds of adding quality free-agent pitching (aka Hudson), all else being equal. Conversely, you may have to overpay to keep your hitters from leaving for friendlier confines.
I’ve always felt that the Rockies should just embrace their high altitude and take an extreme hitting-talent based focus for this same reason. In fact, if I were their GM I’d look to draft college two-way players for my pitching staff to maximize the offensive compounding. Having to face a guy like Micah Owings in the nine-hole would almost amount to psychological warfare on visiting pitching staffs.
The problem with this is that the Rockies are outliers on both sides. Home park is hitting extreme but their road schedule is generally the most pitching extreme (aggravated by the ‘Coors hangover effect’ of seeing pitches move again at sea level which most affects contact rates).
I like the idea of two-way pitchers to pitch at Coors. But what the rockies really need to do IMO is to focus on home/road platoons and figure out how to fit those into a 25-man roster. Home/road pitching rotations can be done relatively easily – if the bullpen is full of spot/swing/multi-inning guys (even better if they can hit OK as well since that eliminates a lot of the ‘pull the pitcher frequently because we need a PH’ stuff) rather than the typical one-out one-inning guys – and if the team gets out of the holy five-man rotation rut.
Batting is much tougher to do that sort of home-road platoon with a limited roster. Power hitters will usually suffer the most from the Coors hangover effect since they tend to be low contact% anyway. So any advantage from clustering them at Coors would be reversed in full once on the road – at the NL West pitchers parks. Instead, it may be better for the Rockies to develop a batter ‘type’ – screen/select/develop for good plate discipline but give them green lights and let them free swing more at Coors.
Could the non-linearity in the relationship between runs/game and wOBA simply be caused by the differences in denominator?
wOBA uses plate appearances as a denominator, while runs/game essentially uses outs (or ~27 outs) as a denominator. So if you took changed the plot to runs/game vs. wOBA/(1-OBP) to account for the difference in the number of PAs that a team would have based upon its on-base percentage, you should see something much closer to a linear relationship.
I think it was woba^1.5 / (1-OBP)
Tango is the woba^1.5 / (1-OBP) based on regression to league data?
It would make sense relative to Jesse’s points about the distribution of hitting talent by team and of the theoretical increase in the wOBA factors for better offensive lineups.
Use pitcher data, which gives you FAR more extreme data to correlate against.
I also used my Markov calculator.
You can also work it out manually, if you follow BaseRuns.
Also: BaseRuns. It deserves its own followup as the answer to the problem here.
I’m confused about the interpretation of the regression coefficient. Point 3 says a coefficient greater than 1 means “increasing wOBA by 10 percent will lead to more than 10 percent more runs.” But then you interpret the coefficient (2.33) as, “a 10 percent increase in wOBA will result in 2 percent more runs.”
I think that’s a typo for a 1% increase in wOBA leading to a 2% increase in runs.
Sorry, it was a typo. Should be fixed now!
Overall a good article, but I have to disagree with this:
A run saved is slightly more valuable than a run scored. Tinker with Pythagorean projections from runs scored and allowed and you can see this. But also at the extremes, once you’ve allowed 0 runs you can’t lose. But no matter how many runs you score, someone could score one more. Now if you’re talking about a tiny number of runs and typical MLB teams, yes, they are very nearly equivalent.
And your point about adding a good offensive player to an already good offense generates even more runs is well taken, and may easily overwhelm the bias towards run prevention. If I add a +15 run player to my already good offense, I should add more than 15 runs, and that difference may indeed be more than the extra value of adding a +15 run defender/pitcher to my team, especially if my defense isn’t all that good and my runs saved are actually less than 15 in the alternate case.
Whether a run saved or a run earned is more valuable depends on the team’s current level. E.g. if you have a team that’s outscored 150-100, you’re better off adding 25 runs on offence for a .410 Pythag winning percentage than subtracting 25 runs against for a .390 winning percentage. That holds up to the point where you’re adding or subtracting enough runs to get back to .500.
Correct.
I added a blog thread, and more comments here, for those interested:
http://tangotiger.com/index.php/site/comments/woba-and-baseruns
Why not measure the distance between the fitted values of the exponential model, alternative models (e.g. linear or power-law), and the observed? A log-transformation essentially coerces data into a more Gaussian distribution. Therefore it should come as no surprise that you have higher t-values from the linear model based on log-transformed data set. A more persuasive argument would to demonstrate that the fitted values from the exponential model predict significantly better than an alternative.
I ask because your distribution may just as easily be a power-law but there is no way to tell if you do not plot the model fits to the actual raw observations and test their goodness-of -fit.
BTW the axis in your figure 1 appear reversed; line-up turnover should predict runs not the other way round. Verdad?
The fit to the data can be easily shown if you use BaseRuns. I urge those to use BaseRuns to answer their initial questions. If you STILL have more questions, then try more nuanced approached. But BaseRuns will get you 95% of the way there. It’s that powerful.
Ok. BaseRuns already describes the non-linearity of the distribution of runs as a function of wOBA.
What is the exponent for the function proposed in this article?
If the exponent here is similar to that described for BaseRuns then significant randomness is implied if a power-law function is indeed valid. In other words, with an exponent of less than 2, parametric estimations of mean and variance are not meaningful unless the tails are removed. Basically, the issue is this; if the linear shape of the log-log plot is indeed taken to represent an underlying power-law distribution (which is completely expected), then is the use of linear methods to extrapolate ln(R/G) warranted? Its impossible to make this judgement if the function is not given.
The reason that better offenses score more than linear weights suggest should be obvious: they are better offenses and thus have more runners on base. Of course the average run values of their offensive events are going to skew higher than that of the league. A homer will average more runs if more runners tend to be on base.
As the Giants typify the pitching-based support of this argument, I think that perhaps the Yankees continual roster additions to good offensive teams typifies the support for the offensive side of the argument. How many times since the mid-70s did a Steinbrenner team boost their lineups in mid-summer and see a good hitter suddenly go on a dominating run? (This question is not too difficult if you are in the large club of long time Yankee-haters.)
Well we’ve got the “embrace a terrible offense” part down.
(I wouldn’t recommend it.)
Interesting article. You said
“The results of this analysis mean teams should stop trying to be well-rounded.”
I ‘ve done some research and found that being more balanced does not help teams win much more. It was very negligible.
This is not what you are necessarily addressing but suppose a .375 wOBA player is out there. If you put him on a high scoring team, he will likely replace a pretty good hitter so that the team wOBA will not rise much. But if you put him on a low scoring team, he will likely replace a poor hitter and team wOBA might rise alot.