The Homogenization of Ballparks
This major league ballpark looks like many other major league ballparks. (via Geoff Livingston)
Our goal is to design a world-class ballpark. That includes field dimensions that are entertaining for our fans and a playing field that’s fair to both pitchers and hitters,”
-David Montgomery, General Partner and President of the Phillies, April 2002 Press Release
Our No. 1 criteria was that we wanted it to play like the other Busch. We wanted it to play fair for the hitters and the pitchers.”
-Tony LaRussa, manager of the St. Louis Cardinals in 2009, on Busch Stadium III
First and foremost, we wanted to have dimensions that played fairly.”
-Erik Judson, San Diego Padres Vice President of Development when Petco Park was built
That’s a lot of lip service to creating ballparks that play fair, all specifically in reference to ballparks built in the last 20 years. You surely could find similar quotes about most ballparks built in that time frame. Implicit in those statements is that ballparks that came before possessed different dimensions that didn’t play fair, at least not fair to any sort of league-wide standard. There’s a lot of truth to that notion. Ballparks today have become more and more homogenized, while ballparks of yore possessed wild fluctuations in dimensions.
No ballpark better encapsulated these fluctuations than the Polo Grounds. For the last 41 years in which baseball was played at the Polo Grounds, the distance to straight-away center ranged from 475 to 505 feet away from home plate. By contrast, the distance to the foul pole in left field was a mere 280 feet, and right field was a miniscule 256 feet. It was a horseshoe.
Those distances are eye-popping because nothing like that exists today. The Polo Grounds were not alone in their oddity. These types of idiosyncrasies have disappeared from the game.
Let’s take a deeper look. We’ll look at distances to the outfield fence, the area behind home plate, ballpark capacity, the height of the fence, and discuss the way the two biggest ballpark booms in the history of the game have shifted the story.
Outfield Distances
This all began as an effort to see exactly how ballparks have changed over time. Using the incredible ballpark database at Seamheads (data through 2015), I was able to collect year-by-year data for every ballpark. While some of the data were incomplete going back into the 19th century, there was ample info for outfield distances to the left field pole, dead center field, and the right field pole going back to 1895. One of the easiest ways to approach this is to look at the maximum, minimum, and average distances for the two foul poles and dead center field.
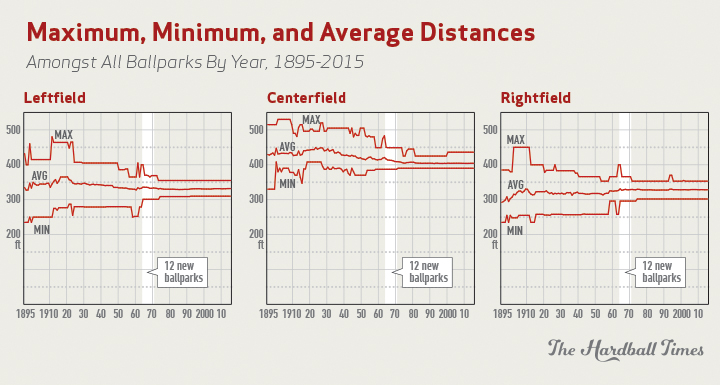
The averages themselves have remained mostly flat, especially in the corners. Since 1947, the gap between the longest average distance to left field and the shortest distance is a tine six feet. You have to go all the way back to 1899 to get a gap between largest and smallest of more than 20 feet in right field . Center field has had more variance, but even its top and bottom averages are within 10 feet of one another since 1965.
These graphs are a good start in illustrating the variance between the maximum and minimum distances, but it only accentuates the outliers. Let’s approach it from a different angle, with a bubble graph illustrating every single ballpark dimension since 1895. To illustrate the homogenization over time, I’ve added some transparency to the bubbles. The hotter the color, the more bunched the dimensions are, meaning there’s more similarity across all ballparks.
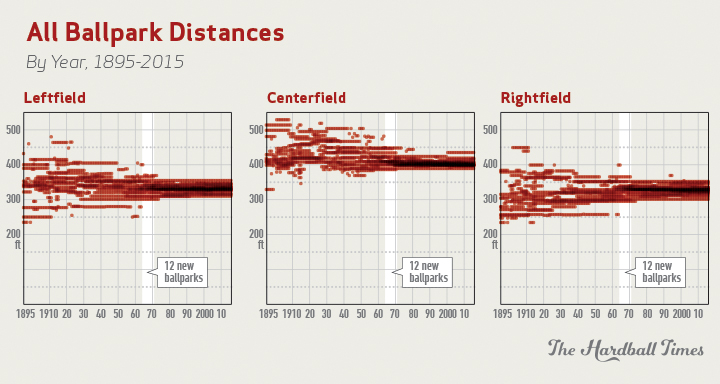
Now we’re really starting to see the homogenization amongst outfield distances. You can see the red bubbles beginning to bunch in the early 1960s, and the color only starts to become more intense from there. And it’s true of all three outfield locations. The one outlier since 1981 is the center field distance at Minute Maid Park, which has been 436 feet from home plate since opening for play in 2000. However, even Minute Maid will undergo a renovation that diminishes the distance to a more standard 409 feet in time for the 2017 season.
Last, but not least, let’s take a look at the size of a single standard deviation by year.
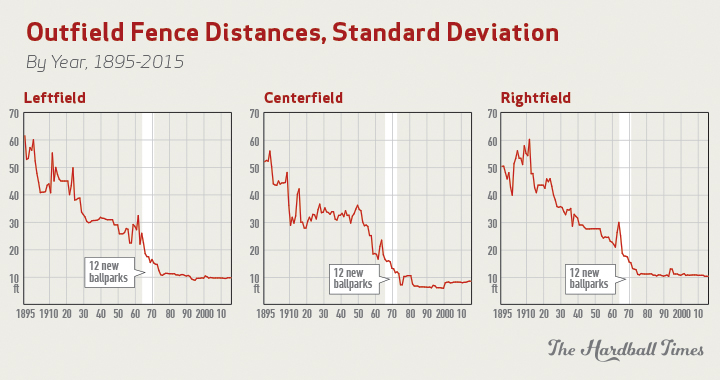
Variance has been on a steady decline since the very first game in 1895 other than a few spikes. Usually those spikes were caused by teams moving into temporary homes. For instance, the mid-1990s mild spike in right field was caused by the Rockies’ brief two-year turn in Mile High Stadium while waiting for the completion of Coors Field. A similar skewing happened when the Dodgers called the Los Angeles Memorial Coliseum home in the early 1960s.
And it’s also important to mention that there are more and more ballparks in the sample each year. The 1895 sample includes 11 ballparks, 1919 has 15, and more modern numbers feature 30 or more. A larger outlier in the earlier years will have a more dramatic effect.

It’s plain to see that ballparks are becoming more and more similar across outfield dimensions. I’m not showing my math here, but I did look at data for the power alleys–left-center field and right-center field–and the results were almost completely identical. Homogenization was already starting to happen in the 1940s and 1950s. Then the Concrete Donut boom (1965 to 1971) sent homogenization into hyperdrive. Twelve new ballparks entered the game in that time frame (highlighted on all of these graphs), and many of them were multi-purpose, cookie-cutter affairs. The collective effect was the collapse in the number of idiosyncrasies among dimensions.
Behind Home Plate
Here, I’ve combined the maximum, minimum, and average graph with the standard deviation, placed side by side.
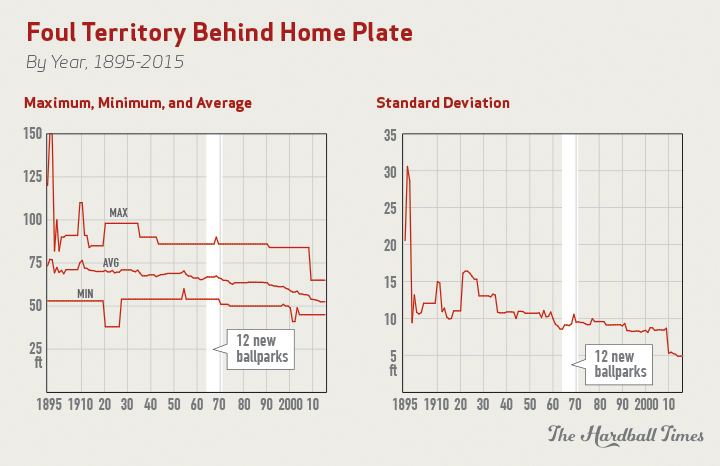
The maximum/minimum graph is not particularly illustrative because the two most prominent maximum distances, belonging to old Comiskey Park and Yankee Stadium, remained unchanged for the majority of their existences. Even as other ballparks with larger areas behind home plate were replaced with new ballparks with smaller distances, those two ballparks held on. It wasn’t until Yankee Stadium was replaced after 2008 that we really see the gap between the maximum and minimum collapse.
Over the last eight seasons, that gap is lower than ever before. The same holds true for the standard deviation, which has totally disappeared. It stands at a miniscule 4.88 feet at this point. The deviation was never truly that large to begin with, but now it borders on non-existence. Like the distances to outfield fences, the idiosyncrasy in another ballpark aspect has disappeared.
Capacity
As I did with the area behind home plate, I’ve combined the seating capacity maximum, minimum, and average graph with the standard deviation, placed side by side.
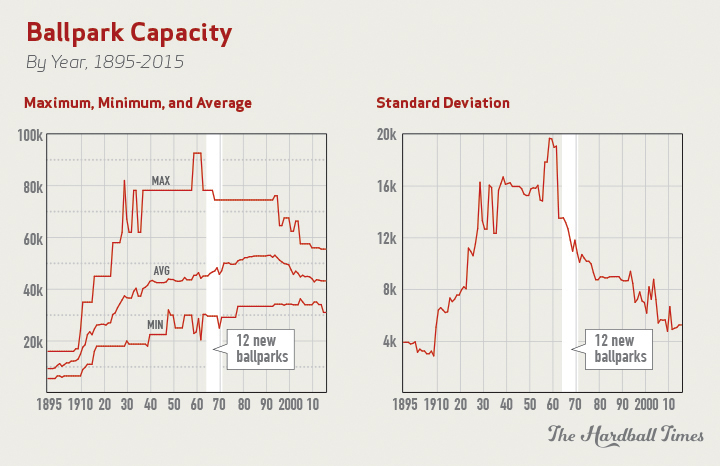
These graphs are a bit noisier. Increased interest in the game muddies the story. First, radio became more prevalent and bumped the game’s standing in the national psyche. Then television pushed it to further heights. And while all of this was going on, teams were constantly moving into new ballparks, tweaking the numbers in one way or another. This is most obvious in the early 1960s, where the cavernous 92,000-seat Los Angeles Memorial Coliseum yet again rears its head. It’s also apparent that 1933 to 1956 was an era in which very few new ballparks began use. It stands out as one of the few truly steady eras in the standard deviation.
Still, there’s a clear pattern of homogenization in capacity after the Los Angeles Memorial Coliseum and Los Angeles’ Wrigley Field (the initial home of the Angels) were vacated. Yet again, the Concrete Donut boom had a profound impact on the size of deviation. Then the second major boom–we’ll call it the Camden Boom–finished the job. From 1989 to 2012, there were just six seasons in which a new ballpark didn’t open.
This homogenization in capacity is at least in part due to better marketing. Emptier stadiums look worse on television, and fans in attendance have a better time watching a good or even average team when the house is full. Teams realized that it’s better to sell out a 38,000-seat stadium than it is to place those same 38,000 fans in a 55,000-seat concrete donut. Sure enough, the average capacity has decreased from a peak over 50,000 in 1993 to a much more realistic 43,218, with most new ballparks built in the Camden Boom pushing the average incrementally lower.
Admittedly, the deviation gets noisy in the early 2000s, but that is almost exclusively a result of the Expos’ presence at the 18,000-seat Hiram Bithorn Stadium prior to their move to Washington DC. Note that in the interest of the spirit of the graph, Hiram Bithorn was removed from the max/min graph, as it was not a stadium built with the intention of housing an MLB team. Rather, it was a less-than-full-season temporary solution.
Wall Height
Finally, let’s review the height of the wall. This data is slightly less robust. It only reliably appears since 1900, so we won’t see the 1895 to 1899 seasons here. Since wall heights have constantly been affected by outliers throughout history (the Green Monster says hello), I’ve opted to skip the maximum/minimum graph. Instead, we’ll use the transparent bubble treatment again.
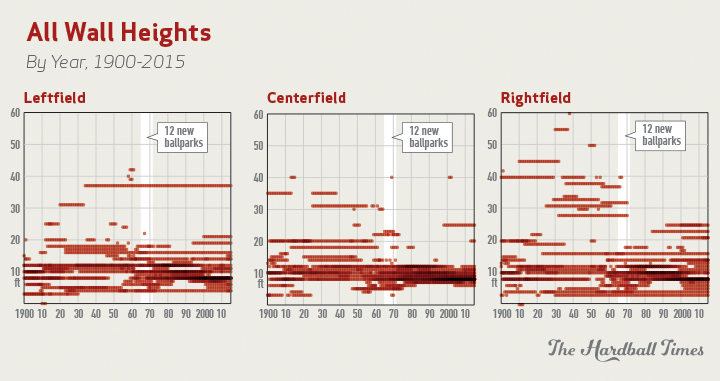
Here we can see that Fenway is an outlier in left field and remained as such for the majority of the sample. But more importantly, we finally see an aspect in which homogenization has reversed itself. Franchises have decided that wildly variable wall heights are an acceptable way to make a ballpark idiosyncratic.
There was a brief period in which wall heights became homogenized after the Concrete Donut boom, but it looks like the Camden Boom corrected it to some degree. Jacobs/Progressive Field and Minute Maid Park stand out as ballparks that entered play during the Camden Boom and employed mini-Monsters in left field. Chase Field has a 25-foot wall in center field, and Marlins Park opened in recent years with a 20-foot wall in center field.
The Metrodome’s right field garbage bag held up the standard for unique right field walls in the 1980s at 23 feet high. Then the Twins carried over the outlier into the new Target Field. By that time, AT&T Park, PNC Park, and Camden Yards–three of the biggest jewels of the Camden Boom–had joined in the fun of an idiosyncratic right field wall.
To drive home the point, here are the standard deviations since 1900 for wall heights.
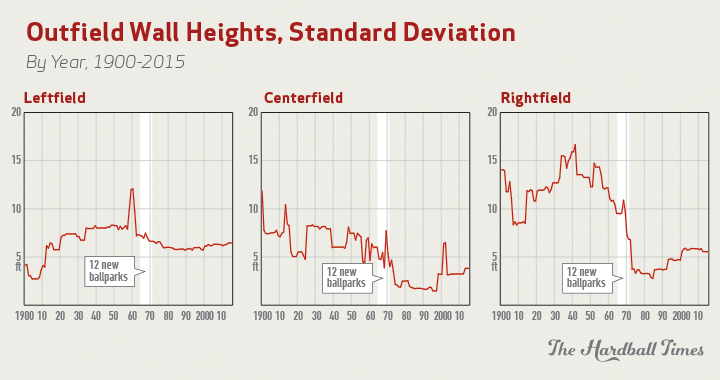
First, it’s worth addressing the giant spike in the early 2000s in center field. That was a result of the Reds’ tweak to Cinergy Field, which goosed the center field wall to 40 feet high. It was done to protect the integrity of the batter’s eye while construction of Great American Ballpark took place in plain sight. Left field spiked in the late 1950s–there’s the Los Angeles Coliseum again, this time with a 40-foot wall in left field–but the standard deviation for left field wall heights died during the Concrete Donut Boom and never recovered.
Where it gets fun is in center field and right field during the Camden Boom. Seemingly, teams with new ballparks wanted to be unique, but without overtly copying Fenway’s famed Green Monster and without employing the cartoonish distance dimensions of the past. The answer was a bump in wall heights in center and right fields, which is reflected in the increase in standard deviation during that time frame.
The other way franchises have fought total homogenization is with off-field thumbprints. Camden Yards has its warehouse. Marlins Park has an aquarium behind home plate and bizarre moving “artwork” beyond the left-center field wall. Minute Maid Park has a miniature train that runs along the exterior left field wall, and AT&T Park has McCovey’s Cove, amongst so many others. It’s not that ballparks have become entirely homogenized. Only the on-field aspects have become more and more vanilla.
References & Resources
- Seamheads, Ballparks Database
- Philadelphia Phillies, Press Release, “Phillies reveal New Ballpark field dimensions”
- George Vecsey, The New York Times, “Glorious Stadium Honors a Glorious Past”
- Corey Brock, MLB.com, “With subtle changes, Padres hope Petco plays fair”
- Ryan Dunsmore, The Crawfish Boxes, “Astros confirm center field renovation before the 2017 season”
- Chicago Tribune, “Reds’ Center-field Wall Will Top Green Monster”
I have a hunch that many of the parks from the19th and early 20th centuries were constructed according to the physical configurations of the city in which they were built. The left field wall in Fenway was not created to satisfy the aesthetic palates of the average fan but to prevent balls from hitting residents in Kenmore Square. This theory probably applies to Ebbets Field and the old Yankee Stadium as well. Again, just a hunch with nothing to support it.
This is correct. The quirky dimensions and walls of ballparks past were forced on clubs by the lots they had to work with. Ballparks like League Park (Cle) and Baker Bowl (Phillies) were built on standard rectangular city blocks, which meant they had microscopic dimensions in right field and canyons in center. (The Phillies mitigated this issue by building a clubhouse in straightaway center.) Plain walls in right in Shibe Park (Phi. A’s) and Ebbets Field were right up against the city street on the other side. The most famous feature of Griffith Stadium in DC was the right-angle jog the wall had to take in center, around some brownstones and a big oak tree. (The owner refused to sell his property to the club.) The Braves South End Grounds (used in three iterations between 1871-1914) was wedged between a major city thoroughfare on one side and train yards on the other. As far as I know, the first “classic” ballpark that could be constructed without having to worry about the surrounding cityscape was Braves Field, built on the Charles River on the western half of an old golf course.
While I am someone who wishes all the old yards could be resurrected and would love to see some of them replicated in the present, I don’t think today’s more uniform dimensions are necessarily a bad thing. First of all, wind currents and other manifestations of the laws of physics still make some parks more homer-friendly than others. (I’m thinking of RF in the new Yankee Stadium, where the ball travels even better than it did in the old Yankee Stadium. Oh, and all of Coors Field . . . ) Secondly, even with the largely similar dimensions, these parks are often constructed in unique settings right in town, so there still is a sense of “wedging” into the local neighborhood. Most importantly, though, once again you can look at an uncaptioned picture and recognize what park you’re looking at right away, which certainly wasn’t the case with those damn concrete donuts . . .
This is correct. Stadiums were often built with the land available in mind. The stadium has to be in the city as transportation options were limited. In the 19th century, it was not like tens of thousands of fans could drive their cars from the suburbs into the city each game since (a) there were barely any suburbs, (b) the road infrastructure and, for that matter, automobiles barely existed, and (c) there were no lights and going to day games can be difficult with a day job. It had to be near the train/trolleys. Buying into the city limits to what can be done, especially since baseball teams weren’t economic juggernauts in the 19th century and buying the ideal land would be cost prohibitive. And it was not like the city was going to be especially cooperative. Lots of places banned Sunday baseball so some stadiums were strategically placed to work around that – the New York teams were actually playing in Brooklyn for this reason – and just because a baseball stadium existed didn’t mean the city has to respect it. (One story is that New York City knocked down a wall on the original Polo Grounds while the field was being used because the city map said there should be a road there and, damn it, they were going to build that road. Now.) Occasionally, the quirks did come from other things, like Yankee Stadium being designed to enhance Babe Ruth’s power numbers and left-handed power hitting in general, but most of the quirks were of the “here’s a piece of land, build a baseball stadium” variety.
I feel like it’s tough to go out on a limb and be intentionally quirky these days. Public/Press/Players will blast you and call it gimmicky. Your best bet to be different is to find way to integrate into the local city, both in aesthetics and culture ( beer/food ). I just don’t foresee anyone with the stones to develop the modern day green monster.
I always thought the Rockies could have made their outfield fence look like a mountain range.
I live in Morgantown, W.Va., and our ballpark for the Mountaineers/New York-Penn team has an odd wall in left. It’s tall at the foul pole but slopes down then levels off for a bit, but they built the ticket office right up against the fence, on the outside of the fence. The ticket office is maybe 10 feet taller than the fence, so the home run line runs up, over and down the frame of the ticket office. You can hit the ball out of the park to the left or right of the ticket office, but hit it the same distance and height in between and it will carom off the ticket office wall, likely for a double.
It’s a fairly bland park otherwise, so I kind of like that.
You know what you hardly ever see any more? Kids missing a finger or two from a sweatshop accident. The homogenization of childhood hands is really notable. Really, in the past century, we’ve moved from incredible diversity in childhood digits — some kids would have only 5! Others 8 or 9, and then the rare 11-fingered kid.
Now, it’s incredibly rare if you find a kid who’s missing even half a pinkie. Yet as Trevor Bauer has shown us, perhaps modern technology will return us to the quirky, diverse times of a century ago.
Why mock those of us who miss some of the quirkiness that use to be a bit more common in the game we all love? No one is arguing that life should be like it was a century ago… but there is nothing wrong with recognizing some things that are genuine losses.
Enjoy whatever you want – I like the old parks too. What I’m mocking is the idea that there’s a need for faux-academic study (charts! tables! data!) of why quirkiness is gone.
The old ways of ballpark design were dictated by necessity — and necessity varied from city to city. With modern methods (and eminent domain!), there’s no need (and therefore no excuse) for building a ballpark with a 285 foot right field line, or a fence that’s 30 feet high.
As was shown in Houston, non-necessitated quirks are immediately recognizable as silly affectations. Thankfully, designers have offered a great deal of variety in other aspects of the ballpark design and experience.
Wait, what sport do you think you are following and what blog? Charts, tables and data are the bread and butter of many baseball fans. Are they necessary, perhaps not.. but they are a great deal of fun.
The average fan nowadays is more concerned with what type of specialty food and craft beer is being served.
No, what the average fan nowadays wants is comfort and convenience, and its not for us to criticize them for it. I love Wrigley Field as much as anyone does, but even I have to admit that watching a game at the White Sox park is a more fan-friendly experience in every way.
It’s the same profound distaste for this trend towards homogeneity that makes me fight any suggestion to add the DH to the NL, even though I’m an AL fan. The NL fans who dislike excessive specialization and think pitchers should be complete enough players to hit (or at least bunt) are right. And the AL fans who don’t want to watch an easy out come up every pass through the batting order and want to see aging or limited sluggers have an opportunity to still do impressive things are just as right. Thus the arrangement we have right now, with the DH in one league and absent in the other, is perfect for both. Sure it’s inconsistent, and if you’ve been raised on the soulless Cartesian grid of football it’s maddening, but for the pastoral ever-expanding angle of baseball it’s perfect. A foolish consistency is the hobgoblin of little minds.
I’m for a DH by coin toss at home plate at the start of every game in both leagues. The manager who wins the toss calls DH or no-DH depending on whether his pitcher is a hitter or not. The managers will have to bring two lineups to home plate. It would encourage pitchers to pay a little more attention to hitting and add a little more strategy and excitement to the game at the outset. Can anyone think of further incentives for pitchers to develop their hitting?
+1 for the use of hobgoblin.
Homogenization of the stadiums is not terribly surprising. When the first stadiums were built, there was no real concept of what a baseball stadium should be other than it had a playing surface and seats for fans. There would be lots of experiments on what did and did not work. The bad ideas were moderated or tossed and the good ideas were repeated for multiple iterations until a range of ideal ballparks came into existence. If they had known in 1880 what would produce the best game and, more importantly, bring in the most fans, everyone would have built something like that. They didn’t know so they did what they saw best.
Of course, radio and television also helped produce standards. If the 19th century each city was its own island. Most people probably never visited any city besides the ones closest to them and in some cases never visited a city at all. Cities varied a great deal based on weather, native industries, local population groups, etc. What was best for Cleveland was not going to be what was best for New York or for that matter Kansas City.
Re the “classic” ballparks:
Remember that those ballparks were built by the team owner, not taxpayers. Since the team owner ran the business to make a living, he pinched pennies by necessity. No way he would buy any more real estate than he had to. Given a compact design, quirkiness was all but guaranteed. Once the taxpayers started footing the bill, the amount of land purchased expanded, making quirkiness more a matter of whimsy or nostalgia than necessity.
I have to laugh at the facts that the Phillies and Padres of all teams actually thought they were building fair ballparks.
Thanks, this was fun, and the visualizations are striking.
It would be interesting to do a look back at in-city ballparks for how their footprint fit into the existing real estate. What did builders do with non-NSEW grids?
IMO, Forbes Field doesn’t get enough love in discussions like this.
Here’s a really good photo of the park configuration:
http://www.ballparksofbaseball.com/wp-content/uploads/2016/03/forbes16_top.jpg
(Going from memory:) Starting down the left field line, you’ll see the bullpen was in play (the home team pen was down the RF line). The foul pole was 365 feet, except when the Pirates played their Greenberg Garden/Kiner’s Korner shenanigans. Forbes had its own green monster, a hand operated scoreboard that was in play if a ball hit it (but the clock atop the scoreboard was a home run). I believe you can see there was a little room to hit the ball out of the park between the pole and the scoreboard if you hit it right down the line. The wall then ran out to 457 feet in CF, so far out that after batting practice a tractor would tow the cage out there and it would be put up against the wall, in play (there were ground rules covering what happened if a ball landed on or rolled under the cage). I think the flagpole was in play too, standing on the field. The original configuration of the park had a 367-foot RF line. When the the grandstand was built, it cut the RF line to 300 feet, so they put up a big screen in front of the lower deck to cut down on cheap home runs. Hitting a ball on the roof the grandstand, however, was a serious challenge. Babe Ruth did it; Willie Stargell did it several times. But only a handful of LH sluggers ever hit one up there. Finally, there was a gate in the RF wall that they rolled up after games, so fans could walk on the field and leave the park that way,
I’m going to guess the original square footage of playing surface in the park (once parks started putting up fences) would have rivaled that of any other park, including Griffith and the Polo Grounds. With that much territory for fielders to cover, it helps explain why there was never a no-hitter thrown in Forbes.
Oh, and you could watch a game from the top of the Cathedral of Learning on the Pitt campus:
http://sabr.org/sites/default/files/images/forbesfield1960.jpg
I had the privilege of seeing a handful of games there when I was a boy. I’ve been in a bunch of parks since, and with the possible exception of the Astrodome (for obvious reasons), Forbes was easily the most unusual park I’ve ever seen.
Oh, almost forgot: You can build your own Forbes Field:
https://www.amazon.com/Forbes-Field-Build-Yourself-Introduction/dp/0964288702
Loved your picture and story on the dimensions of Forbes Field. I’ve been out to the wall and home plate on Pitt’s campus today many times. I would have loved to have seen a game there. I have a bit of an obsession with Forbes Field and Ebbets Field. I’d give my left arm to see a game at those two parks.
Thanks to the Forbes Field posters for bringing back some great memories! From the Great Roberto to Felipe Montemayor. . . .
Enjoyed this article immensely, especially the charts! tables! data!
The first professional ballpark I visited was Ponce de Leon ballpark, home of the Atlanta Crackers. There was an old oak tree way out in centerfield. All of the older fans would say, “Big Bob Montag hit one into the tree you know!” I loved that park almost as much as I loathed the Ted…
Hello I am so excited I found your blog page, I really found you by accident, while I was
searching on Google for something else, Anyhow I am here now and would just like to say kudos for a remarkable post
and a all round thrilling blog (I also love the theme/design), I don’t have time to read through it all at the moment but
I have book-marked it and also included your RSS feeds, so when I have time I will be back to read a
lot more, Please do keep up the excellent work.
Talk about quirky, Waconah Partk in Pittsfield, MA was built in 1919 and faces West. That means night games usually have a 20 minute “sun delay”. Over the years, they tried to raise a giant curtain hung between two poles, that that never worked well.
Every so often around Pride month in June, shoe companies will release a limited-edition rainbow-tinged Pride sneaker that becomes a real collector’s item for queer fashionistas.