The Physics of Carry at Dodger Stadium

The 2017 World Series gave rise to the notion that the ball is carrying more at Dodger Stadium. (via Praveen Umanath)
On the West Coast, there has been a lot of discussion the last few years claiming fly balls at Dodger Stadium seem to have more carry. After 14 of the record 25 World Series round-trippers left Chavez Ravine in 2017, some of this talk has carried over to the national stage.
Some simply blame the hottest temperatures in the history of the World Series for the homer barrage. It is certainly true the first two games had temperatures around 30˚ higher than usual for a Dodgers home game. That might have had something to do with the eight blasts in Game Two, but not the seven home runs in Game Five in temperature-controlled Minute Maid Park.
Dodger Stadium has always been a pitcher’s park. When it opened in 1962, the Dodgers staff included Hall of Famers Sandy Koufax and Don Drysdale, so why wouldn’t you build a pitcher’s paradise? Originally it was 410 feet to center field with acres of foul territory designed to turn souvenirs into pop-outs.
In 1969, the plate was moved toward center, reducing the distance to 395 feet, the current dimension. The foul territory has been reduced many times to increase the number of high-priced seats close to the action. Even with the outfield dimensions a bit below average, Dodger Stadium remains slightly below average in park factors. Some say this is due to the West Coast marine layer, which turns out to be hard to quantify.
I suppose the first thing to check is whether the homers per year in Los Angeles are actually increasing with time. The graph below shows this is indeed the case.

There are many possible reasons for this increase, including many simple explanations like the Dodgers having increased the number of sluggers in their lineup, or this is just the local manifestation of the home run explosion throughout the majors.
We might find evidence for more carry by looking at dinger distance by year. The graph below might show some modest variation from year to year, but nothing that resembles a trend.

Since carry is a somewhat nebulous term, let’s clarify it a bit by describing what it depends upon. Of course, it depends upon the launch speed and launch angle. In addition:
- The time the ball is in the air, which correlates with launch angle. The higher the launch angle, the more time the air drag has to reduce the carry.
- The hook or slice of the ball due to the sidespin will also reduce the carry.
- Local effects such as wind, temperature, atmospheric pressure and humidity.
Here, we are interested in item No. 3, local effects. At the same time, we need to control for items Nos. 1 and 2. It should be noted that after correcting for Nos. 1 and 2, there still could be global effects such as aerodynamic changes in the ball itself (seam height, roughness, etc.).
Carry has been quantified in true physicist fashion by Alan Nathan in 2009 while trying to explain the increase in homers at the new Yankee Stadium. His method takes the ratio of the actual distance of a fly ball to the theoretical distance the ball would travel using the equations from high school physics. These equations assume the ball doesn’t interact with the air.
For example, let’s look at George Springer’s bomb in Houston in that ridiculous Game Five. ESPN Home Run Tracker set the distance at 444 feet. Using the so-called “range equation” from high school physics:
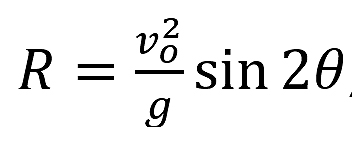
where vo is the launch speed, g is the acceleration due to gravity, and θ is the launch angle. Using the Tracker’s launch speed of 111.1 mph and launch angle of 26.8˚ gives a distance of 664 feet. The carry is then:

It would now appear to be a simple matter of finding the average carry by year at Dodgertown. First, we need many years of data for fly balls. Unfortunately, Statcast has hit distances going back only to 2015. That leaves the data at ESPN Home Run Tracker (HRT) that go back a decade.

The downside is that the only fly balls in the HRT data set are homers. Statisticians have reminded me before that homers are a biased sample of fly balls. I’m stuck between a choice of a less-biased sample with insufficient data (Statcast) or a biased sample with enough data (HRT). I’m going full speed ahead with the latter. Before you go ballistic, wait until you read the results.
Below is a plot of average carry by year. There is clearly no evidence of an increase over time. In fact, it appears to be a collection of random numbers. That is to say, the error bars average about nine percent of the carry value, so any trend is hard to find.

There is still a chance we can make something of the “more carry” argument by correcting for the decrease in carry due to time of flight (item No. 1) and the decrease in carry due to sidespin (item No. 2). Item No. 1 was addressed by Nathan in 2009. I’ll use Nathan’s method for both items.
The time in the air is correlated with launch angle, so a plot of carry vs. launch angle should show inverse correlation. Indeed, it does for all homers in LA in the last decade. The least-squares-fit line can be used to calculate a “normalized carry” by dividing the carry by the appropriate LSF value for each launch angle.

Balls hit down the left-field line tend to have sidespin driving them toward the left, while balls hit toward right field tend to have sidespin moving them toward the right. Since sidespin reduces carry, the horizontal angle is correlated with the sidespin and therefore the carry. Below is a plot of normalized carry versus horizontal angle.

The least squares fit curve can be used to calculate a “corrected carry” by dividing the normalize carry by the appropriate LSF value for each launch angle. Finally, we can plot of the “corrected carry” by year, which should reveal any local effects (item No. 3). Here, the error bars are smaller than for the uncorrected carry (six percent vs nine percent). Nonetheless, there is no clear variation with time.

In conclusion, this methodology shows no evidence of more carry in Dodger Stadium, at least to the level of a couple percent. Since there is clearly an increase in round trippers in Chavez Ravine, something is happening. Most likely the “extra carry” in LA is just the local manifestation of the home run explosion throughout the major leagues. If only we knew the cause of that.
Note: Last August, Alan Nathan wrote a THT article entitled, “Fly Ball Carry and the Home Run Surge.” It is definitely worth a read. He used a more advanced method to define carry, which could not be used here since he was specifically looking for ball-related effects, not local effects. Thus it used only data from an indoor stadium.
References & Resources
- David Kagan and Chris Mitchell, The Hardball Times Baseball Annual 2017, “The Effect of the Marine Layer on Fly Balls”
- Alan Nathan, The Physics of Baseball, “The “Carry” of Fly Ball”
- ESPN Home Run Tracker
- Alan Nathan, The Hardball Times, “Fly Ball Carry and the Home Run Surge”
HR/FB rates have doubled between 2010 and 2017 at stadium for both pitchers and hitters. Thats more than double the league rate of change. I’d look for a humidor someplace
This is the right place where you can play free sonic games online without any registration. http://sonicgames.xyz/