The Physics of COR and Other Measures of Bounciness

Just how bouncy is the ball in MLB? (via slgckgc)
In an earlier article here at The Hardball Times,
I described the common procedure for measuring the bounciness of a baseball. In case you don’t have time to peruse the article itself, here’s the quote:
The standard methodology is to fire a 60-mph ball at a wall of northern white ash (a common wood used for bats) and measure the speed of the rebounding ball. The rules require the rebound to be 32.76 ± 1.92 mph.
The standard way to report this value is as a fraction of the initial speed. This fraction is called the “coefficient of restitution,” or COR. The COR, then, must be 0.546 ± 0.032.”
A reader comment on this article brought up a very salient point:
Why would they measure COR at a relative velocity of only 60 mph? Why not something closer to the practical relative velocity of 200 mph? Maybe the average COR would be the same, but maybe not.
Timmeh49
One can quibble with the 200 mph figure because, under game conditions, the pitch is likely between 80 and 100 mph, and the relevant portion of the bat is moving about 70 mph. So, 160 mph is more reasonable. Nonetheless, why measure COR at 60 mph?
Since 1998, the American Society for Testing and Materials (ASTM) has thoroughly described the method for measuring the COR of baseballs, beginning with F1887-98 – Standard Test Method for Measuring the Coefficient of Restitution (COR) of Baseballs and Softballs. This method uses baseballs moving at 60 mph. Occam’s Razor suggests the speed was chosen because that was the highest speed that would produce repeatable values with the technology available back then.
Dr. Lloyd Smith, Professor of Mechanical and Materials Engineering at Washington State University and the Director of their Sports Science Laboratory was asked about the 60 mph speed and had similar thoughts. “The honest answer is, I don’t know. It’s been done at 60 mph (or near that speed) for some time (decades). I assume that was the fastest they could project balls at the time.”
Let’s continue to pursue Timmeh49’s query by looking at the variation of COR with collision speed. There seem to be only two relevant studies. The first is “Static and Dynamic Properties of Various Baseballs” published in 1998 in which eleven types of baseballs were examined. They didn’t mention whether any of them were from MLB. They used five balls of each type, attempting to fire them at 30, 45, 60, 75, and 90 mph. The balls collided with an aluminum plate (not white ash), and the rebound speeds were measured.
They only published the results of COR versus speed for two of the balls. In both cases, the COR dropped by about 0.02 for every 10 mph as the speed increased. However, given there is a lot of scatter in their data, they may or may not have used MLB baseballs, and they didn’t collide with a wall of ash, the utility of these results is limited. Although it is fair to say the COR does drop with collision speed. The second study used softballs and also showed COR dropped as collision speed increased.
So, Timmeh49’s implication that even though the COR at 60 mph may be fairly constant over the years, the COR at game speeds might be have changed over time is still a possibility. Before we investigate this idea further, we should note the COR measurements we’ve discussed so far have involved collisions with a flat surface, yet a game ball smacks into a bat that is not at all similar to a wall. It is actually more like a cylinder.
There is an ASTM standard for higher-speed collisions with a cylinder. ASTM F2845 – Measuring the Dynamic Stiffness (DS) and Cylindrical Coefficient of Restitution (CCOR) of Baseballs and Softballs – prescribes a collision between a baseball traveling at 115 mph with a cylinder 2.62 inches in diameter. The CCOR, just like the COR, is the ratio of the outgoing speed to the incoming speed.

The prescribed diameter is slightly below the 2.75-inch maximum set by MLB. Yet again, the speed is still below typical game conditions. That said, picture yourself in a small, dimly lit, basement laboratory. How would you feel about a baseball moving around in there with you at even 115 mph?

from the Report of the Committee Studying Home Run Rates in Major League Baseball (May 2018)
For reasons that aren’t entirely clear, MLB performs CCOR tests at 120 mph instead of 115 mph. I guess the closer to 160 mph the better. In any case, the Report of the Committee Studying Home Run Rates in Major League Baseball (May 2018) contains data from three different studies using balls from 2012 through 2017. The data from the MLB Report is summarized in the plot below.
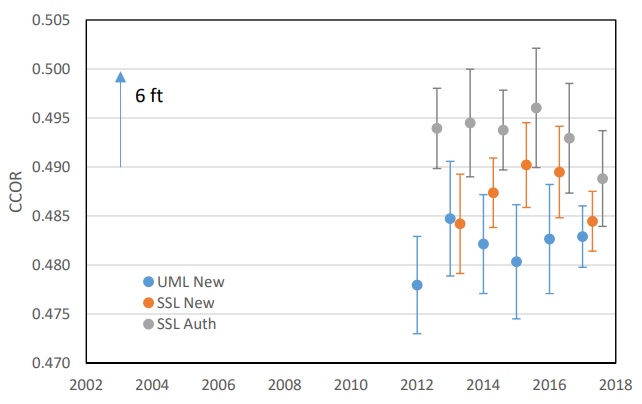
The blue results are for new baseballs tested at the Baseball Research Center at the University of Massachusetts Lowell (UML new). The other two data sets are from the Sports Science Laboratory at Washington State University (SSL). The orange data were produced with new balls (SSL new) while the gray set used balls removed from play (SSL Auth) during the seasons in question.
Both sets of data from the Sports Science Laboratory show a slight decrease of CCOR from 2015 to 2017, while the results from the Baseball Research Center detected little change in CCOR from 2013 through 2017. So, even the bounciness of the baseball at 120 mph instead of 60 mph, coming off a cylinder instead of a flat wall, is not nearly enough to explain the recent home run explosion. In addition, the recently released Preliminary Report of the Committee Studying Home Run Rates in MLB (December 2019) states, “From analysis of the Rawlings and UMass/Lowell test data, there is some evidence of a small increase in the CCOR of the baseball between 2018 and 2019. However, that increase was too small to play a significant role in the home run increase in 2019.”
It would have been great if Timmeh49’s excellent ideas indeed did explain the recent home run explosion. After all, it is much easier to wrap one’s head around the idea of a bouncier ball than a ball that, for not-thoroughly-explained reasons, slips through the air more easily. Hopefully, we’ll learn more about the aerodynamics of the “horsehide sphere” when the preliminary report becomes the final report and is released to the public.
References & Resources
- Hendee, Shonn P., Richard M. Greenwald, and Joseph J. Crisco. “Static and Dynamic Properties of Various Baseballs” Journal of Applied Biomechanics 14.4 (1998): 390-400.
- Lloyd V. Smith, Alan M. Nathan, and Joseph G. Duris, “A Determination of the Dynamic Response of Softballs,” Sports Engineering 12, 163-169 (2010).
- ASTM F1887-98 – Standard Test Method for Measuring the Coefficient of Restitution (COR) of Baseballs and Softballs
- ASTM F2845 – Measuring the Dynamic Stiffness (DS) and Cylindrical Coefficient of Restitution (CCOR) of Baseballs and Softballs
- Report of the Committee Studying Home Run Rates in Major League Baseball (May 2018)
- Preliminary Report of the Committee Studying Home Run Rates in MLB (December 2019)
(Apologies that many of these references can’t be obtained online without payment. What is this world coming to…)
Interesting article, thanks!
How much variability can we expect just from the non-uniform properties of ‘a wall of northern white ash’? Even if they’re hitting the same spot of wood every time, won’t there be some time dependence as the wood adjusts to repeated collisions? Without knowing this, it’s not clear how to interpret the apparent shifts in the CCOR figure.
I don’t know for a fact, but the ball is so much more compressible than the wood that I suspect it makes virtually no difference for the results of the COR tests.
Hmm, then should it matter whether the wall is ash or aluminum, as long as both are much less compressible than the ball?
Hm, how does that square with the difference between aluminum and wood bats?
I do have a little bit of familiarity with impact testing for catchers gear/batting helmets. If I remember correctly when performing these tests a specified stiffness value for the ball had to be obtain (through a simple compression test on an instron) to be used as a “test ball”. I remember colleagues stating that there would be massive variance in any given box of balls received and most didn’t fall within appropriate range to be tested. These were major league or NCAA balls I believe. Do these COR and CCOR tests take that into account?
You will find a lot of information on ball compression tests in the MLB Report at http://www.mlb.com/documents/0/5/6/312149056/Report_of_the_Committee_Studying_Home_Run_Rates_in_MLB_121119.pdf
Section 3.3 on page 50 is a good spot to begin.
David, good article about the “bounciness” of the ball. What does the bounciness affect other than the EV at contact? I’ve read and heard many statements that the EV didn’t change much in 2019, but the distance traveled with the same EV as previous years significantly increased. Also, has there been any simple hardness tests of the ball? How about the weight? I realize these are basic questions, and I apologize if there has already been something written on it, but I honestly don’t recall seeing anything.
Regarding your last paragraph about the publishing of an aerodynamics study, hopefully it will answer the following questions:
1. Was “the pill more perfectly centered” in 2019?
2. Was “the skin tighter and/or slicker” in 2019?
3. Were the seems tighter and/or lower” in 2019?
4. If any of the above did occur, what was the impact of the differences?
I also read somewhere (can’t remember where) that the spin rate and spin direction upon contact has a significant impact on flight path and distance traveled (makes me think of hooking or slicing in golf). With that in mind, could the more aerodynamic ball be more forgiving to less than ideal contact (e.g. more solid contact; less hooks, slices, pop ups, worm-burners, foul balls, etc.)?
On a different theme, many good pitchers struggle with control of the ball and command of certain pitch types last season (and some even voiced concerns about it). I remember once, when Pedro Martinez was announcing a game last season (maybe it was during the All-Star game), he said that he noticed a difference in the seem placement when he tried to grip the ball and that it would make it more challenging for him to throw certain pitches with the desired effect. There also seemed to be a lot of blisters and other minor injuries to pitchers early in the season. Have you heard anything on these subjects?
Thanks
It’s bouncy enough to hop out of the crate when I pick up after BP
David, your readers mind find this interesting:
https://twitter.com/tangotiger/status/1090809486623862784
https://twitter.com/tangotiger/status/1091106480902848512
Sometimes, just seeing it at its very basic makes things more accessible
Thanks! You can do some basic baseball science right in your own home.