The Physics of Fielding

StatCast looks upon Lorenzo Cain’s fielding favorably. (via Keith Allison)
Just as a boat is a hole in the water into which you throw money, a ballplayer is a bucket in the field into which you hope baseballs will land. I guess you throw a sizable chunk of money into the bucket as well.
Anyway, the funny thing about this bucket is its size varies. The size depends upon the speed and quickness of the fielder as well as his decision making in terms of taking the shortest path to the ball. Some of these issues can be examined through the lens of physics.
First things first. During the 2014 season, MLB began installing a player tracking system it has dubbed StatCast. StatCast uses a combination of video technology and radar to track the motion of the ball as well as every player on the field. Some limited information on the system can be found at MLBAM, Beyond The Box Score, FanGraphs, and here at THT.
By the start of the 2015 season, StatCast should be running in every ballpark. Here is a collection of highlights showing StatCast data overlaid on game video. For our purposes we will use data from one of the many terrific catches turned in by Royals center fielder Lorenzo Cain during the 2014 playoffs. The data are listed in the table below.
| Lorenzo Cain Catch Data, 10/26/14 |
|---|
| Quantity | Value |
| First Step | 0.37 s |
| Acceleration | 3.50 s |
| Max Speed | 20.7 mph |
| Route Efficiency | 94.7% |
| Total Distance | 82 ft |
| Hit Travel Time | 4.33 s |
MLBAM has not been forthcoming regarding the nature of these numbers. So, let me take a minute to describe my understanding of them, or at least how I used them in the most consistent fashion.
- First Step – I assume this to be the time between when the ball was struck by the batter and the time the fielder made his first move to get it.
- Acceleration – The physics unit for acceleration is ft/s2, not the units of seconds used by MLBAM. I assume its number is seconds and thus not really an acceleration, but instead the time between when the ball was struck and the time the fielder reached maximum speed. You can read about some of the concerns regarding the choice of units for acceleration at the Tangotiger Blog.
- Max Speed – This is the top speed of the outfielder and I assumed that the fielder maintained this speed once he reached it.
- Route Efficiency – This is a measure of how close the fielder stayed to the best path to catch the ball. It is not clear how it is calculated. More on this later.
- Total Distance – It is not clear whether this is the distance the fielder actually traveled along the path he chose or the straight line distance from his initial position to the place where the ball was caught. Again, more on this later.
- Hit Travel Time – I assume this to be the time from the moment the ball left the bat until the time the ball was caught.
If anyone reading this can improve on the above definitions, please chime in. If sharing this information with all of us puts your life or the lives of your loved one in danger, of course feel free to demur.
Using the assumptions above and the definitions of velocity and acceleration from physics, one can calculate the position of the fielder at any time. I calculated distance of 78.9 feet in 4.33 seconds as opposed to the 82 feet. I tried other definitions such as assuming the acceleration time began after the first step time. None of these other methods resulted in more consistent results.
Now, back to the buckets. Figure 1 shows the buckets for each second in side view. Remember, these buckets are for Lorenzo Cain. So, the buckets for most other outfielders will be smaller.
You’ll notice the spacing between the buckets grows noticeably during the first three seconds while the fielder is accelerating. Once he reaches reach top speed, the spacing becomes uniform.
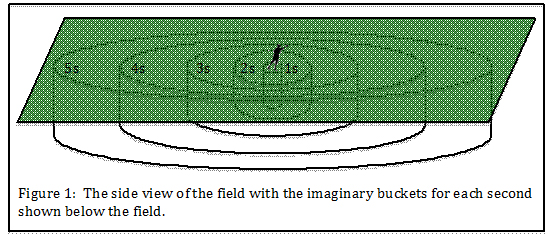
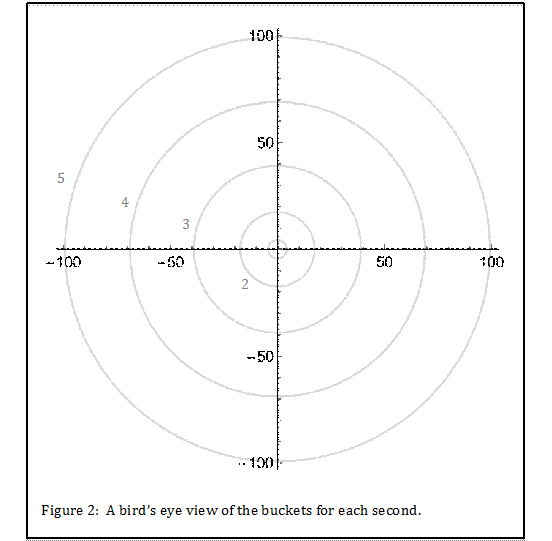
Figure 2 is the same thing from the top view. Understand that I’m using the assumption that the fielder can run the exact same way in every direction. This is unlikely, but let’s leave that discussion for another place and time.
Now, let’s hit some balls into the buckets. Using Alan Nathan’s Trajectory Calculator for a non-spinning ball hit at 100 mph launched at different angles gives the flight times and landing positions for each launch angle.
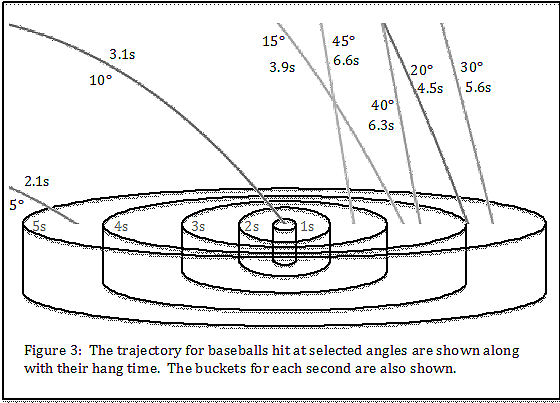
Figure 3 shows an outfielder positioned at the spot where the ball launched at 10˚ would land. It turns out to be 320 feet away from home plate. The trajectories (or at least the last portion thereof) are shown for launch angles of 5˚, 10˚, 15˚, 20˚, 30˚, 40˚, and 45˚. For each trajectory the time of flight or hang time is indicated.
As the launch angle increases, the trajectory changes from a line drive to a lazy fly ball. That is, the ball drops at a steeper and steeper angle and has a longer and longer hang time. Another thing to notice is that the maximum distance occurs at about a 30˚ launch angle, not the 45˚ angle you might have been taught in physics class.
It isn’t too hard to use the buckets to figure out which of these hits can be caught, but it is easier to look at the data in tabular form. For each launch angle, the hang time and the time for the fielder to reach the ball are shown. A ball is deemed catchable if the time for the fielder to reach it is less than the hang time. All of these hits can be caught except the lowest line drive which is “a base hit in any ballpark.”
| Batted Balls, Broken Down by Launch Angle |
|---|
| Launch Angle (˚) | Hang Time (s) | Fielder Time (s) | Catchable |
| 5 | 2.1 | 4.2 | no |
| 10 | 3.1 | 0.0 | yes |
| 15 | 3.9 | 3.1 | yes |
| 20 | 4.5 | 3.9 | yes |
| 30 | 5.6 | 4.2 | yes |
| 40 | 6.3 | 3.4 | yes |
| 45 | 6.6 | 2.4 | yes |
Figure 4 shows the same thing as Figure 3 except from a bird’s eye view. The landing spots for each launch angle are shown along the vertical axis. In addition to the balls hit straight toward the fielder, the same launch angles are shown with the balls hit along a line that is 10˚ to the right of the fielder (actually, I guess, this is to the fielder’s left).
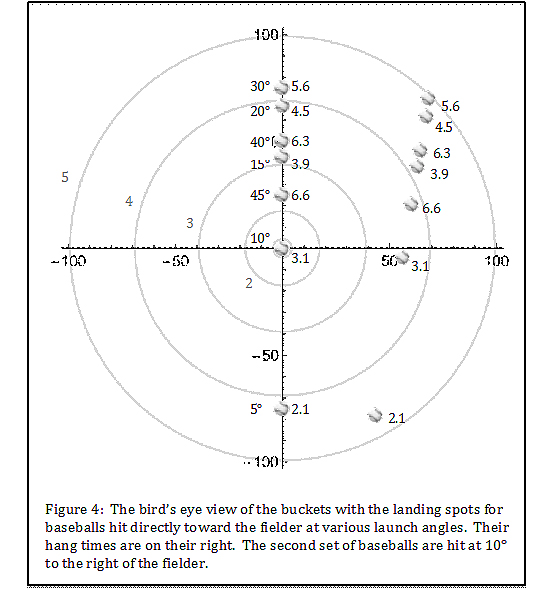
Again, you can use the buckets for each second to tell if a ball can be caught, but a table is easier. You can see the well-known result. Balls hit with lower launch angles (line drives) get down sooner and are less catchable, while high fly balls have enough hang time to allow the outfielder to get under them.
| Batted Balls, Broken Down by Launch Angle |
|---|
| Launch Angle (˚) | Hang Time (s) | Fielder Time (s) | Catchable |
| 5 | 2.1 | 4.7 | no |
| 10 | 3.1 | 3.6 | no |
| 15 | 3.9 | 4.2 | no |
| 20 | 4.5 | 4.7 | no |
| 30 | 5.6 | 4.2 | yes |
| 40 | 6.3 | 4.9 | yes |
| 45 | 6.6 | 3.0 | yes |
Of course, all of these buckets get smaller if the outfielder takes an indirect path to the ball. Many decades ago, a problem was circulated among university science and mathematics faculty members: A farmer is trying to catch a moving pig. What is the best strategy for the farmer to get to the pig in the shortest time?
The Department of Defense was the origin of this query; it was trying to design the so-called “Star Wars” missile defense. DOD probably would have probably gotten a better answer more quickly by asking outfielders instead of academics.
Anyway, StatCast uses route efficiency as a measure of the quality of the path the fielder takes to the ball. I have yet to see anyone publicly explain how MLBAM calculates this number. I tried the simple thing of taking my calculated straight line distance to the ball (78.9 feet) and dividing by the reported distance traveled (82 feet). I got 97.3 percent which doesn’t agree with the 94.7 percent from MLBAM.
One last comment on buckets – they sometimes leak. The leak rate should be correlated with good old-fashioned metrics like fielding percentage. However, now we are moving into the arena of the sabermetricians. Since I’m only a physicist, I’ll stop here.
David, as a physics nerd, I’m loving this series of articles. Thanks, and keep up the good work.
Great article, Dave. MLB would do us all a great service if they would define the meaning of the various quantities (e.g., “acceleration”). That would allow the data to be understood in a more quantitative way, as you have done here. Of course, you have had to guess what it is they actually mean.
One question I have is whether the “acceleration” (time to maximum speed?) starts with the contact time (I suspect not) or with the first step (more likely). But the question is a reasonable one and ought to be clarified by MLB.
“MLBAM has not been forthcoming regarding the nature of these numbers.”
Because those numbers by their very nature have to be rife with noise, while MLB writers citing StatCast data (mis)use terms such as “precisely” and “exactly” in conjunction with them, perhaps? One man’s guess.
The units of acceleration are especially odd because one of the first videos they released was the video of the Jason Heyward catch in 2013. In that video, his acceleration was in ft/s^2
In some cases the fielder is going to maintain maximum speed, more or less. In most cases, he will slow down at some point before he reaches his ultimate destination when he catches the ball.
The distance needs to be measured by how far the glove ranges using a straight line. The ball always ends up in the glove, that is the distance we need. If a third baseman leaps ten feet in the air six feet to his left. We need the exact distance that the glove ranged. Then we can combine that with the reaction time, and get a new number for every play. Dividing time by distance. If the outfielder’s glove ranges 80 feet in four seconds His Reaction over Range number is .050
That’s fair, of course, but StatCast is pretty solid at judging where the center of mass (i.e., the torso) is, but not the extremities, like the limbs or the glove. That’s why MLBAM reps are always a little reluctant to talk about the stats like “how much was he out by,” since those depend on figuring out where hands are, and that’s still a tricky problem.
“StatCast is pretty solid at judging where the center of mass (i.e., the torso) is …”
And this is known how? And are +z-direction adjustments processed after in-game bowel movements?
Fun stuff, as is always the case when scientists and ballplayers try to find common ground.
I think First Step might be the moment when the fielder lifts one foot, probably better stated as reaction time. It might even be the time taken to actually take the first step, so when the first step has been completed. I’d say it’s not the first movement (the lean.) Top fielders are almost always moving to one side before the ball is actually struck, especially so for up-the-middle defenders who can see the pitch location and batter’s load, but also somewhat true for cornermen who can follow the catcher to ascertain pitch location. Experience does the rest.
I don’t like the use of mph to indicate max speed – everything else is in seconds and feet. His max speed was 30.36 ft/sec and it should be expressed that way. By the way, I don’t think max speed means the player’s maximum measured running speed – it just means the top speed he chose to run for this particular play. In rare cases, the two are the same.
I agree with the assessment on acceleration – the unit of measure is wrong. However, a player tracking a flyball is probably not going to accelerate linearly anyway, as his route may need adjustment and that’s not easy with full-on acceleration. So the time taken to reach top speed might be about the most useful metric available. I’d go with the time from first step to max speed rather than from when the ball is struck as you suggest. That takes reaction time out of the mix. The interesting thing here is that with a 3.50 second acceleration period, a 0.37 second first step and a 4.33 second hang time on the fly ball, it all means that Cain spent a grand total of 0.46 seconds at his top speed, less than a half-second. And if he spent 0.46 seconds at full speed (covering 14 feet) that means it took him all of 68 feet to get to his full speed. I find that very hard to believe.
Just guessing, but Route Efficiency might be a combination of line and acceleration time. A fielder who is right on it will step soon, accelerate quickly, and track a straight line to the ball. A fielder who is unsure of his judgement or needs adjustment will probably be more hesitant at startup, and will definitely lose some acceleration as he adjusts his route. If we assume that acceleration is all at the beginning, then it took Cain almost the entire route to actually get up to full speed, which to me would indicate a slower acceleration and thus impact his “route efficiency” score negatively. Maybe that accounts for the other 2.6%.
Watching the play, I don’t think Cain ended his run at his absolute top running speed. I think he had a good bead on the ball from the start and accelerated comfortably enough to be able to adjust his route, reached top speed at around 2/3 of the way there, and then a little more under control as he neared the wall. Walls will always be a factor in this metric – a fielder is going to want to be under control as he nears the wall because he doesn’t want to miss the rest of the series. Cain makes a judgement as to how much under control he can be and still make the catch, and he’s a good fielder so he calls it right.
One thing that baffles me though, is the other play in the video – the Panik double play. Cain is noted as running first-to-second at 18.7 mph, barely faster than leadfoot Hosmer’s 18.1 mph home-to-first charge, and much slower than his outfield run at 20.7 mph. This is the one play where a player needs to run full-out for 90 feet, and he ran more slowly than he ran towards a wall.
I’m going to assume that this metric is published for successful catches. In that scenario, a fielder would want to run under control, using his experience to measure the ball’s landing point and how much time he has. His objective will be to be moving as slowly as possible – preferably camped under it – when the catch is made. So his speed profile will look more like acceleration, then max speed (max required for this catch, which may not be the player’s max,) then a coasting period before the catch. Think Devon White of the early 90’s Jays. He never seemed to run full out – he just evaporated and materialized under the ball. The point is that Devo had an uncanny ability to see the ball’s flight and to know exactly how much effort it would take to make the catch look easy. I think a metric like this might be unflattering to a fielder like him. Back to successful catches, the Cain play only happens to a fielder a few times a year, so if there’s to be any inferential value, there’s a sample size issue. I’d much rather see the same metric for near misses and maybe for diving catches. The ones where the fielder thinks he might have a chance but knows he has to haul it from the start. That would tell me something about the player.
It’s a little upsetting all you self-proclaimed physics nerds use ft/s^2 when we all know universal physics use metric system, hence m/s^2. However, I understand baseball uses imperial system, so not a terrible port.
“Using the assumptions above and the definitions of velocity and acceleration from physics, one can calculate the position of the fielder at any time. I calculated distance of 78.9 feet in 4.33 seconds as opposed to the 82 feet. I tried other definitions such as assuming the acceleration time began after the first step time. None of these other methods resulted in more consistent results.”
Is there any reason to assume a person breaking into a sprint has a constant acceleration? I suspect there’s not, so any attempt to extrapolate the distance covered based on those givens seems like it’ll have accuracy issues.
Nice article. The premise is very clear – that fielders are positioned to catch where a line drive is most likely to be hit by a batter.
I would just note that it is unlikely that this is how positioning is actually done. Far more likely is that positioning is adjusted for maximum coverage area given past hit patterns. After all, even publicly there are spray charts including struck ball types for various batters; an optimal placement would be to take the various ranges noted above and overlay them to cover the largest possible past number of struck balls in a given fielding position.
Matt: Players most definitely don’t have a constant acceleration. For sprinters, acceleration out of the blocks is just under 10m/s2, then falls at a fairly constant rate to under 1m/s2 by about the four second mark of the run. I’d assume something similar (though obviously a bit slower) with baseball players, though statcast will hopefully give us the exact details.