The Physics of Splash Hits
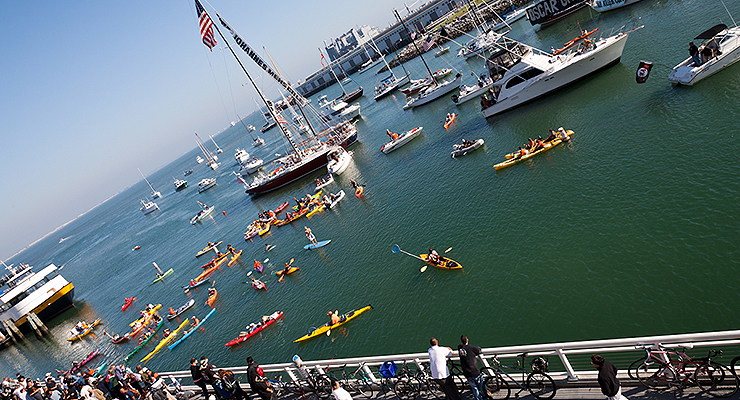
A lot of forces have to be aligned for a ball to land in McCovey Cove. (via randychiu)
While watching the National League Championship Series tonight and this week, did you notice on the right-field wall at AT&T Park a small scoreboard with the number 68 illuminated? Since it is between innings and they are showing that silly Dodge Dart commercial again, let me explain.
Beyond the wall is a small piece of San Francisco Bay called “McCovey Cove” named after the Giants’ Hall of Fame slugger, Willie McCovey. Home runs hit by the Giants into the bay are dubbed “Splash Hits.” Since the ballpark opened in 2000, there have been just 68.
The San Francisco Giants web site lists them all. As you might imagine, the list is dominated by Barry Bonds, with 35. Pablo Sandoval is a distant second, with seven.
Wait a second…there have only been 68 splash hits in the 15 seasons since AT&T Park has opened!?! Why so few? It is only 309 feet down the right-field line, which is on the short side for major league parks. Part of the answer is an outfield fence dubbed the “Willie Mays Wall,” due to its purported height of 24 feet (in case you’re not familiar, ’24’ was his jersey number).
The wall is 29 feet wide. Then there is a 24-foot walkway between the stadium and McCovey Cove. Now we are up to 362 feet. The wall and walkway are not perpendicular to the foul line, so that adds another four feet. Now we are looking at about 366 feet for a splash hit landing along the foul line.
As the Willie Mays Wall moves outward toward center field, the distances increase. The table below shows the distance needed for a splash hit at various angles from the right field line. By the time you are 10˚ off the foul line, you are looking at about a 404 foot blast.
| Distance Needed for Splash Hit |
|---|
| Angle (˚) | Distance (ft) |
| 0 | 367 |
| 5 | 383 |
| 10 | 404 |
| 15 | 431 |
| 20 | 466 |
Looking at the 28 splash hits since 2006 on ESPN Home Run Tracker, we find the average distance is coincidentally 405 feet. All but two of these shots they rank as ND, for “no doubt.” According to the glossary, ND means “the ball cleared the fence by at least 20 vertical feet and landed at least 50 feet past the fence. These are the really deep blasts.” They also indicate that all but two would have left any park in the big leagues.
Is the rarity of splash hits solely due to the limited number of very long homers? Since 2006, the Giants have hit 469 round-trippers at AT&T. They averaged 393 feet, though only 28 resulted in splash hits. That’s almost exactly six percent.
The last 500 homers hit in 2014 in all ballparks by all teams might be a representative sample for comparison. They averaged 395 feet, almost the same as the Giants in their home park. Examining the landing location using the overlay tool at ESPN Home Run Tracker showed that 24 of these would have been splash hits. That amounts to 4.8 percent.
These numbers make it look like splash hits aren’t especially rare at AT&T. In fact, there seems to an excess of them. It doesn’t take much looking around to find a potential culprit. According to Mike Fast’s blog Fast Balls, AT&T Park is the windiest in the majors. This, despite the efforts of designers to avoid the arctic blasts of its notorious predecessor Candlestick Park.
The table below summarizes the wind direction and speed for all 81 games at AT&T in 2014. The average wind speed overall is 11.8mph. The wind blows out to center field 83 percent of the time, and it also averages 11.8 mph. Note that only rarely does the wind blow out toward McCovey Cove – just 12 percent of the time.
| AT&T Park Wind direction and speed, 2014 |
|---|
| Wind Direction | No. of games | Pct | Avg. Wind Speed |
| Overall | 81 | 11.8 | |
| Out to RF | 10 | 12% | 11.1 |
| Out to CF | 67 | 83% | 11.8 |
| Out to LF | 3 | 4% | 14.7 |
| R to L | 1 | 1% | 12.0 |
Now, let’s use Baseball-Reference to look at the wind on days when splash hits happened. The results are in the table below. The average wind speed is a bit higher, but more significantly the wind direction is much different. The wind is three times more likely to be blowing out toward the cove.
| AT&T Park Wind direction and speed, Splash Hit Games |
|---|
| Wind Direction | No. of Splash Hits | Pct | Avg. Wind Speed |
| Overall | 66 | 13.0 | |
| Out to RF | 27 | 41% | 12.3 |
| Out to CF | 20 | 30% | 14.5 |
| Out to LF | 8 | 12% | 15.5 |
| R to L | 5 | 8% | 10.2 |
| L to R | 2 | 3% | 8.0 |
| In from LF | 3 | 5% | 13.7 |
| In from CF | 1 | 2% | 7.0 |
Since we now have some suspicion that the wind can explain the excess of splash hits, let’s take a minute to be sure we understand the physics of the flight of a baseball in the wind.
 Figure 1 shows three forces acting on a ball in flight. They are shown as the red arrows. The velocity is represented by the blue arrow, while the backspin on the ball is indicated by the circular green arrow.
The gravitational force, or weight, pulls the ball downward. Air resistance or drag acts opposite the velocity of the ball. Drag, as the name implies, slows the ball down. The drag grows as the square of the speed of the ball through the air.
The other force exerted by the air is the Magnus force or lift. It is always perpendicular to the velocity and is in the direction of the spinning motion of the front of the ball as it moves through the air. Due to the spin, the front of the ball in figure 1 is moving mostly upward and slightly backward, matching the direction of the lift. Magnus force depends upon the speed of the ball through the air to the first power and the rate at which the ball is spinning.
When the wind moves along with the ball, both the lift and the drag will decrease, because the speed the ball moves with respect to the air drops. Let’s say at some point during the flight, the ball is moving at 60 mph and the wind is moving along with the ball at 12 mph – 20 percent of the speed of the ball.
Since the lift depends upon the speed of the ball with respect to the wind, it will also drop 20 percent. However, the drag depends upon the square of the speed of the ball with respect to the wind, so it will drop by 40 percent. This steep reduction in drag accounts for the longer distance for a homer hit with the wind at its back.
Let’s apply this to a typical splash hit. We’ll use the 405-foot smash on May 12, 2014 struck by Tyler Colvin in a wind of 12 mph out to right field. Let’s watch:
Not bad for his first homer in a Giants uniform, huh? Now, a quick but complicated calculation (which, lucky for you I’m leaving out) gives the results shown below.
| Test Results |
|---|
| Wind Direction | Wind Speed | Distance | Splash Hit |
| No wind | 0 mph | 363′ | no |
| Out to RF | 12 mph | 405′ | yes |
| Out to CF | 12 mph | 388′ | no |
| Out to LF | 12 mph | 357′ | no |
All these hits would have resulted in a homer, but only the one hit with the wind is a splash hit. The wind added the additional 42 feet to clear the seats and the sidewalk. A wind out to center field would have added only 25 feet, while a wind toward left actually reduces the distance by six feet.
Now that we’ve mastered the physics of homers in the wind, back to the game!
Note that they only count the Giants splash hits. There have been 36 more by opponents. 68 actually sounds like a lot. But then you remember who hit most of them… Since Barry Bonds’ last McCovey shot, the Giants have only hit 23 compared to their opponent’s 21 in the same time span. A little more realistic.
Could you clarify why you are adding the width of the wall to the distance that a ball hit along the foul line needs to travel to reach the water? Is the wall also 29 feet thick? Looking at a satellite image, the thickness of the wall appears to be negligible, and the width of the wall appears to be irrelevant.
You are right…the face of the wall is less than two feet thick. When I say “the wall” I am including the seats in the “arcade” on top of the wall as well as the walking space along the arcade also on top of the wall. Hope that clears it up…DK
What about the effect of the wind as a new force adding or subtracting from the velocity. If you hit a shuttlecock straight up with no spin, the wind would push it in whatever direction it was going, until drag and gravity brought it to a halt. If the wind was blowing out, a ball would have an additional force behind it and adding to the velocity going out. It is not so easily observed with a baseball, except that sometimes a ball blows back toward the park if the drag and upward force and original angle are such that the velocity from the hit goes to zero before the ball hits the ground, and the velocity then goes in the direction of the wind until the ball hits the ground. (I observed on a Frank Howard shot to left into the wind at Wrigley Field. It was almost above Waveland, before the wind directed it back to left field where Billy Williams caught it facing out from home plate.) Although it hard to see the effect of the wind on a baseball apart, it seems like this factor is separate from the factors you list. Or maybe it is included in one of the factors you list. Anyway could you explain this.
The pushing force of the wind you describe is the drag force that I used. Physicists don’t think of the wind as a separate force because the force exerted by the air exists whether there is wind or not. The wind just changes the size (and perhaps direction) of this drag force.
The physicists drag force depends upon the speed of the ball with respect to the speed of the air not the speed of the ball with respect to the ground. So a ball moving with the same speed as the wind will feel no drag force at all. On the other extreme ball moving against the wind will feel a much larger drag force than a ball moving through still air.
So even with no wind, the drag force keeps the ball from traveling as far as it would if somehow the ball could travel without interacting with the air. If the wind is blowing out, the drag force drops allowing the ball to go further. If the wind is blowing in, the drag force is larger keeping the ball from going as far. This definition of the drag force is actually easier to use than “the force of the wind pushing” because you don’t have to deal with two forces the “natural drag” slowing the ball in still air and the “wind drag” just caused by the moving air.
Did I clear things up or just make them murkier?
Great stuff, David. Very entertaining post that is concise and informative.
I have to say though, the hitting coach in me got excited thinking this was going to be about bloop hits…
I was wondering how fast would the ball have to be going at a 5 degree angle in order to clear the wall in right field in order to be a splash hit?