The Physics of Wind at the Remodeled Wrigley Field
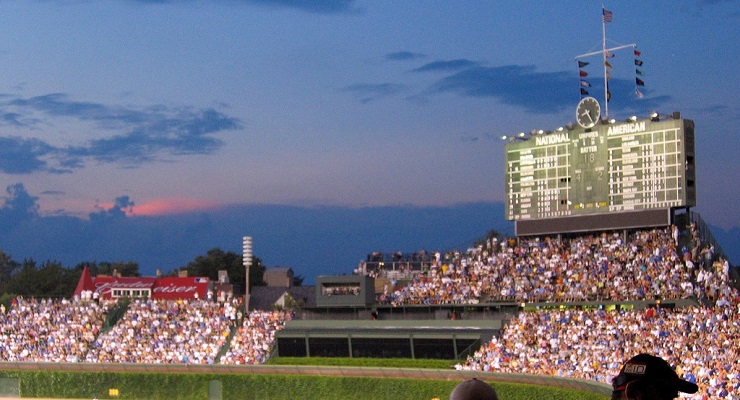
High above Wrigley Field looks markedly different this year. How different is the wind? (via Ben Husmann)
Amazing things are happening on the North Side these days. Wrigleyville is starting to fulfill its promise. By nearly all accounts the remodel of the Friendly Confines, while still in progress, is considered a success. Jake Arrieta tossed a no-no and the most amazing miracle of miracles has the Cubbies ensconced in the playoff hunt in September.
The remodel, like the Cubs postseasons chance, does not come without some concerns. I recently was alerted to a FanGraphs chat question from commenter Henry Rowengartner (an alias, I suspect) asking, “Is there any meaningful data yet on how the new video screens are impacting the hitter/pitcher friendliness of Wrigley?” A Hall-of-Fame broadcaster is asking the same question:
One thing I would be interested to see is as time goes on here because this ballpark has always been about the winds…those two big boards may change those wind patterns a little bit.” — Jon Miller during the Giants broadcast from Wrigley Field on Aug. 6.
Now, Chicago has many nicknames — Chi-town and Second City chief among them — but The Windy City is the most well known. Yet, Boston, New York, Milwaukee, Dallas-Fort Worth, San Francisco, Kansas City, Minneapolis and Cleveland are all major league cities with higher average winds. So before the science, we need a bit of history.
In the 1860s, Cincinnati and Chicago developed a fierce competition over which city was the heart of the meat packing industry. This rivalry naturally spilled over into baseball. The 1869 Cincinnati Red Stockings were baseball’s first all professional team. Chicago, of course, came up with a rival team called the White Stockings. Cincinnati sports pages often used “Windy City” in a derogatory reference to the competition’s hometown.
Unlike the city, Wrigley Field is actually known for its winds. In January 2007 Chris Constancio wrote here at THT that on the North Side, “More than 23% of fly balls result in home runs when the wind is blowing strongly toward the ivy-covered outfield walls, but only 13% of fly balls result in home runs when the wind is blowing in from the outfield.”
At the same time, in ballpark wind rankings such as at Mike Fast’s blog Fast Balls, Wrigley was in the middle of the pack for average wind speed in 2007 at 9 mph. I just examined the average wind speed at game time using data from Baseball-Reference.com in 2014 and got essentially the same value, 8 mph.
The thing about the winds at Wrigley is their variability. The lowest wind speed in 2014 was 1 mph, while the highest was 23 mph. Those of you who are statistically inclined might like to know the standard deviation was about 4.5 mph. Not only does the speed vary a lot from day-to-day, so does the direction — as shown in the table below.
| Wind Direction | No. of Days |
| in from CF | 12 |
| in from LF | 8 |
| LF to RF | 6 |
| out to RF | 7 |
| out to CF | 10 |
| out to LF | 2 |
| RF to LF | 10 |
| in from RF | 24 |
Perhaps a better way to get the average wind is to include the direction. This is called “vector averaging” and the result is the average wind velocity (as opposed to average wind speed). Essentially, you average the winds in such a way that a 10 mph wind in from center one day and a 10 mph wind out to center on another day give an average velocity of zero instead of an average speed of 10 mph.
For 2014, the average velocity was only 1.7 mph directed in from right-center field. In other words, the daily winds tend to cancel each other out over the course of the season. A well-hit ball is as likely to be knocked down by the wind as pushed over the fence.
For 2015 (through the end of August), the average wind speed was up to 11 mph with a range of 2 mph to 24 mph and a standard deviation of 5.0 mph. The average wind velocity was 1.0 mph in from center field. Interestingly, while the average wind speed is up from 2014, the wind is just as erratic as ever, as seen in the table below.
| Wind Direction | No. of Days |
| in from CF | 10 |
| in from LF | 7 |
| LF to RF | 10 |
| out to RF | 4 |
| out to CF | 7 |
| out to LF | 2 |
| RF to LF | 13 |
| in from RF | 13 |
In summary, the winds in the Friendly Confines are so variable that it is hard to distinguish the effect of the remodel from weather data alone. It is unlikely that the remodel, which more fully enclosed the park, is actually responsible for an increase in average wind speed. So, let’s take a different approach – physics!
The main feature of the Wrigley remodel that could significantly affect the winds is the addition of a large video board in left field. According to Crane’s Chicago Business, the board is 42 feet high by 95 feet wide. The number we really need is the height of the board above the field. I performed some Googled image sleuthing to estimate that the board towers about 80 feet above the playing surface.
I went on to estimate the height of the old bleachers before the remodel where the video board is now. They appeared to be about 33 feet tall. So, one way to attack the issue is to find the distance a typical homer into the old bleachers would travel in still air. Then I needed to repeat the calculation with a 10 mph headwind and a 10 mph tail wind assuming the wind acted on the ball only when it was higher than 33 feet above the field.
Next, repeat the calculation for the same homer with it protected from the wind when it is lower than 80 feet above the ground. The difference in travel distance might indicate the effect due to the remodel in left field. Fortunately, Dr. Alan Nathan recently modified his Trajectory Calculator to address just such a situation.
Let’s look at a high fly ball landing in the middle of the bleachers below the video board in still air. I used a speed off the bat of 100 mph at a launch angle of 34 degrees, with 1,500 rpm of backspin. In still air the ball would land on level ground 387 feet from home plate. This ball reaches a maximum height of about 108 feet, so even with the new board it experiences the wind during a good portion of its flight. The distance traveled by the ball for each scenario is summarized in the table below.
| Wind Speed | Wind Above 33ft | Wind Above 80ft |
| 10 mph in | 354 ft | 364 ft |
| 0 mph | 387 ft | 387 ft |
| 10 mph out | 416 ft | 406 ft |
In this extreme case where the video board acts as a complete windbreak for an average wind speed, the ball changes the distance it travels by only 10 feet due to the remodel. Realistically, the board has wind flow around it so the actual distance change might be a bit more than 10 feet.
Now, let’s consider a line drive blast landing at the same spot in still air. A ball leaving the bat at 105 mph with a launch angle of 20 degrees and 940 rpm of backspin will do the trick. This ball reaches a maximum height of only 54 feet, so it is completely sheltered from the wind by the new video board. The distance traveled by the ball for the other scenarios is summarized in the table below, where again we see that the effect of the board is around 10 feet.
| Wind Speed | Wind Above 33ft | Wind Above 80ft |
| 10 mph in | 376 ft | 387 ft |
| 0 mph | 387 ft | 387 ft |
| 10 mph out | 397 ft | 387 ft |
The new video board also has the effect of compressing the spread of home run distances due to winds in left field. For the fly ball homer, the range is 62 feet without the board and 42 feet with the board. For the line drive the spread reduces from 21 feet down to zero.
I thought about looking at homers hit on days when the winds were to or from left field to see if the range of distance was compressed. However, the sample size is way too small. Someone tell Kris Bryant to get on that.
In summary, the winds within Wrigley are far too fickle to address the question of changes in wind pattern due to the remodel. We can get an estimate of the effect of the left field video board from our knowledge of the aerodynamics of the flight of a baseball making the unrealistic assumption that the new board completely blocks the wind.
The maximum effect is about a 10 foot change in home run distance for winds directed in from or out to left field. It will be less for other wind directions. In addition, the reduced wind will lower the distance variation due to changes in the wind direction. It will be interesting to see if over the next couple of years sabermetricians can detect any remodel effect in their park factors.
So, I apologize to both Henry and Jon. I don’t have a definitive answer. This is the best I can do. After all, I am just a physics professor.
Enjoyed the article!
The interesting thing to me would be to know the % of fly balls that have left the yard this year vs previous years and what the wind was doing in each case…for example if in 2014 when the wind was blowing out to CF at speeds between 0-10MPH, 17% of flyballs left the yard as opposed to this year 9% (I totally made those numbers up)…and at wind speeds of 11-20MPH X% last year vs X% this year….in my humble, non physics educated opinion, this data would shed a little more light on the question.
Thanks for you work!
R/
Chris
I headed that direction for a while, but by the time you divide up the fly balls by direction the data set is just too small to be definitive.
Where are you getting the wind speed and direction info from? Do you know how they measure that info?
The info is from the box scores at Baseball-Reference.com. Where it is measured is a mystery as far as I can tell. I wrote a short diatribe on that problem in THT 2015 Annual.
One additional point – that you may be driving at – the wind at any one location around a ballpark is really of limited utility. Very careful analysis of pitch or hit trajectories would need detailed information of wind speed and direction at each point along the trajectory. One measurement at one location at the beginning of the game is a poor substitute, but it is the only data available.
Recorded wind direction and speed is extremely unreliable, at least from the retrosheet data. I don’t know if they use boxscore info. I also don’t know if the B-R weather data is the same as the official MLB boxscore data.
You imply in the article that the wind data is “stadium data” after accounting for stadium effects. I don’t think that’s true but I could be wrong. I always assumed it was based on weather data in the area. So, for example, the weather data might say there is a 15 mph wind blowing out to CF, but withing the stadium after accounting for stadium effects, it could be just about anything.
Using the retrosheet wind data, there is virtually no correlation between wind direction and run scoring, when eliminating Wrigley Field from the equation. That tells me that that wind data is not reliable. Again, I don’t know if retrosheet data is the same as MLB or B-R. Maybe someone can check a few games at least.
@MGL It doesn’t mean the data itself is “unreliable” if the effect on a ball in flight within the park is unreliable (when trying to isolate it by looking all all parks as a group).. Every stadium is different. In places like Texas, Oakland and Chicago (White Sox), out-blowing wind is correlated with lower temps., which of course suppress run scoring. Looking at raw wind speeds across all stadiums and without adjusted for temp./humidity (and even shadows) is never going to be a good idea.
P.S. A significant component of the wind effect in Wrigley is a temp. effect. The correl. of the out wind vector to temp. is > 0.35. I.e., a strong wind out usually means higher than normal temperature.
The new scoreboards will have company in the neighborhood soon, a seven story Cubs office building and a seven to nine story hotel on Clark St. This will effectively eliminate winds from the west (out to RF) and partially out of the SW (out to CF). I also wonder what effect breezes off the lake (in from RF), will bounce off these buildings and how that diversion will affect the game. Still four years away from both being built.
You guys, wind doesn’t just hit what gets in its way and then fall down. It flows above and around the obstruction. Have you ever walked around downtown? Wind tunnels depending on the wind. The buildings to the south could create a slip stream of sorts, who knows. As for the scoreboard in left-center, say the wind is blowing in from NNE which is basically the direction from homeplate to the scoreboard, wind would flow around and above the scoreboard and then rush to fill in the space behind it, so there’s a deflection and a reduction but it doesn’t completely reduce the wind.
Interesting article with just one correction to be made: “Realistically, the board has wind flow around it so the actual distance change might be a bit more than 10 feet.” That should read ‘a little bit less than 10 feet’. Wind blowing around the board would mitigate, not increase, its impact.
I’ll be the annoying guy to point out that Chicago’s nickname of “The Windy City” has nothing to do with the wind. It’s roots are in media coverage of the political landscape here, going back to the latter portion of the 19th century.
As for the actual content of the article, interesting stuff!
David, I won’t presume that my one semester of college physics qualifies me to offer suggestions… but I can’t help wondering if fluid dynamics come into play in addition to raw wind speed and direction. I would assume (perhaps incorrectly) that the shapes of stadiums can create both turbulent and laminar airflows that introduce vertical forces and complicated drag effects.
Then again, it is entirely possible that these effects (if they even exist, bearing in mind that I barely know what the heck I’m talking about) are second-order and swamped by the first-order effect of wind. Thoughts?
Your training as an observant individual makes you qualified to comment! In fact, I agree completely. The shape of the ballpark does create complex wind distributions. If one could know the exact distribution during the flight of the ball one could calculate quite precisely the trajectory of the ball. I guess you could say that is exactly what real outfielders have to do in real time.
For the purposes of the article I have no such detailed information so I was forced to make an unrealistic but otherwise reasonable estimate. The estimate I came up with says that the new video board will likely change the motion of the ball by ten feet or less.
You are not going to measure the effect scientifically, but statistically. Which is what Epstein did when he lured Shilling to Boston. That Epstein guy again.
David Ortiz refuses to believe that Ted Williams hit the chair painted red 502 feet up into the right field bleachers in Fenway. But he did–two renovations ago. Fans don’t appreciate how greatly baseballs are affected by unseen effects.