The triumph of Moneyball
Is there a word in the baseball lexicon that can start an argument faster than Moneyball? It’s not really a word, if you think about it, but then neither is the only other thing that springs to mind: DH. It’s odd that a book not called “The Bible” could promote such arguments, but an actual counter-revolution formed (or perhaps simply came to the forefront) at the thought that anyone would go near the game of baseball with a laptop and a spreadsheet. Thankfully, Moneyball was just a silly idea that wasn’t even welcome in San Francisco(!) It had to go to Oakland to get some traction. Or so people thought.
One of the oft-parroted (and oft-misunderstood) lessons of Moneyball was that on-base percentage (OBP) was the statistic by which to rate a player. In fact, Moneyball made the case that the A’s success was built on an understanding that OBP had two properties. It was a more effective way than batting average to rate players, and OBP was inefficiently priced in the free agency market. Detractors charged that chicks dig the long ball, but nerds dig the walk. But something interesting happened. A few more teams publicly embraced Sabermetrics within their front offices, with a few hiring well-known Sabermetricians to be in-house stat-heads. While this wasn’t a majority of teams, it was a notable minority. Still, traditionalists scoffed and wondered why none of these teams (meaning Oakland) had yet won a World Series.
Did Moneyball really have an effect outside of Oakland and the handful of teams that embraced Sabermetrics in the following years? Were the lessons of Moneyball taken to heart league-wide? The surprising answer is “Yes, and in a much more powerful way than you might expect.” The way to tell whether a man believes something is if he’s willing to “put his money where his mouth is.” In baseball, that’s rather literal. Teams buy the service of players in a (mostly) open market. How much money they are willing to commit to a player tells a lot about what they think of him. And what drives those salaries tells a lot about what the market as a whole thinks about what makes a player valuable.
I took 11 years worth of data, 1997-2007, which corresponds to five years before the release of Moneyball in 2002 to five years after. What I wanted to find was what statistics appeared to be driving the salary market during those years. I selected all hitters who had more than six years of MLB service (as dated from their debut year) during the season in question. This weeds out the players who under the new labor contract were in the “slave labor” years of their careers, prior to when they could file for free agency. (The old agreement didn’t have the same structure, but the nice thing about six years in the majors is that it makes everyone in the study a well-known quantity.)
At first, I looked for correlations within the year between salary and performance. But then I remembered a conversation that I had with my brother on the way back from a game. He has a master’s degree in finance, but he pointed out to me that owning a baseball team is a really awful business model. Almost all of your costs are fixed (and almost all of your income is variable). Teams sign players before they get the performance out of them, and players get the same amount whether they play like MVPs or they get hurt on Opening Day. GMs are looking at the past few years of performance and hoping that history repeats itself. So, I began looking for correlations between salary and performance from the few years earlier, which is what information the GM had on hand when the salary was assigned. Correlations were generally strongest two years prior, although usually only slightly above one and three years prior. So, I looked for correlations between salary and whatever stat was of interest two years earlier. To qualify, a batter had to have at least 250 plate appearances in (year–2).
First let’s look at a graph of how well a player’s OBP from two years earlier tracked his salary.
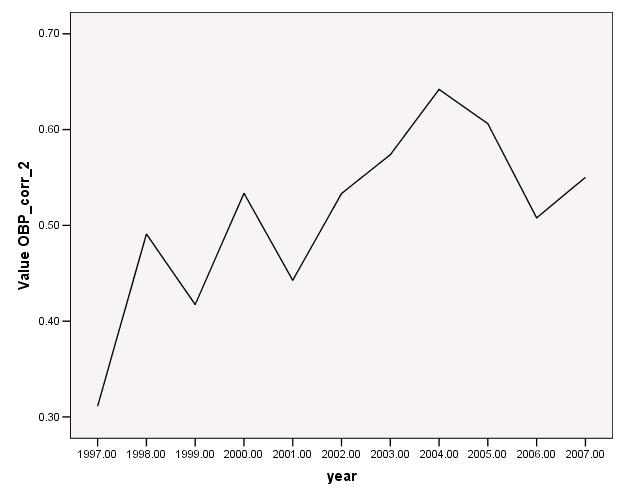
The year 1997 may be an outlier in this case, but the correlation between the two was .31 in that year. We see that in the late ’90s and early oh-ohs, the correlation danced between .40 and .50. In 2001, one year prior to Moneyball, it was at .44. By 2004, it was .64. The strength of the correlation (as measured by R-squared) about doubled. Coincidence? Maybe. But maybe, just maybe, the people who actually make the decisions in baseball actually read and accepted the conclusions in Moneyball. (A small aside: Batting average was always below OBP in its strength of correlations. Ideas that front offices were pricing batting average are not actually justified. If anything, AVG did a horrible job tracking the market.)
The tail end of that graph is concerning, as we see the correlation beginning to fall off. Perhaps Moneyball was a fad. It had its couple of years in the sun, and then… well, Jean-Luc all good things must come to an end. (Sorry.) Let’s take a look at what happens when you look at two other stats that really drove the market, home runs and (sorry for the four letter word) RBI. Those are just the raw numbers as in “Smith hit 35 HR last year and drove in 110.”
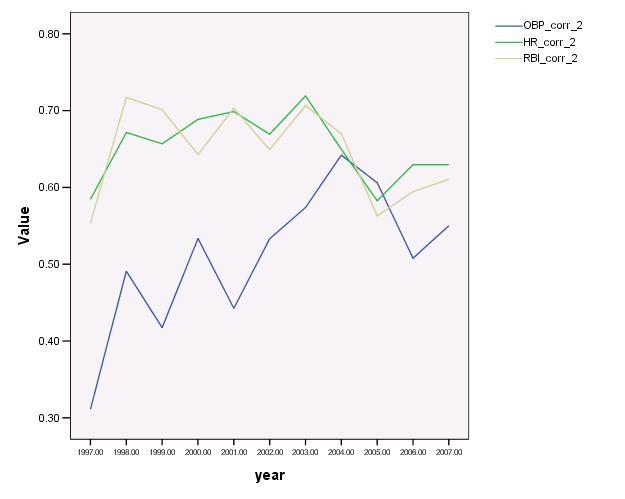
Note that in the years before Moneyball, HR and RBI clearly drive the market much more clearly than does OBP. By 2004, the jump in OBP’s popularity had pulled it even, partly because HR and RBI fell in their correlative power. In 2005, OBP was actually the better correlate of salary. Chicks may dig the long ball, but apparently nerds were running the front office of your favorite MLB team. Look what happens after 2005 though. There’s a general downward trend for all three stats. It’s likely that OBP did have its day in the sun, but why would HR and RBI, so long dominant, also fall?
Over the past few years, we’ve seen the proliferation of a number of advanced statistical techniques, whether total value functions incorporating offensive performance and defensive prowess, or context adjustments such as replacement level or park adjustments. My guess is that if I could pull together a database on the subject, these advanced stats would show an upward tick in their correlative power with salary. OBP was the beginning. Now teams are into the real stuff.
So what does it all mean? It means that whether by cosmic accident or intelligent design, the principles espoused in Moneyball seem to have won the day in the only place where it really matters: the front offices of Major League Baseball.
stick to cutting sausage and mushroom
Excellent findings, Cutter.
I kind of would like to see the trends carried out a little longer. Perhaps the downward ticks in ‘05 to ‘07 were just subject to randomness? Or, perhaps the field was being flooded with higher numbers of OBP-type players?
By ‘04 and ‘05, it’s also possible there might have been a healthy stock of pre-6-years-of-service, slave-labor, OBP-type players, so the market for OBP would have been essentially flooded. I don’t know, but it’s a super interesting line of contemplation no matter what!
Correlation does not equal causation.
Correlation may not equal causation, but correlation plus context does equal, “well, ain’t that funny.”
But I think one of the issues that was brought up by Bradley is that there isn’t enough context. I’d be nice to see more about the individual players that make up the correlation.
That context could be more interesting than the book context.
Exactly. The free-agent market is, by definition, inflated because only a certain group of players is available at a given time. John Lackey, for example, is going to get a bigger-than-deserved contract this offseason because he’s least-mediocre of a poor selection set, not because of how any particular team’s front-office philosophy, never mind the more salient thing known as a “budget.”
This paper mirrors Pizza’s findings.
http://business.clemson.edu/Economic/storage/papers/Hakes-Sauer-Moneyball-IJSF-Sept07-rev3.pdf
If you have the data available, whats the correlation between 2 year lagged .wOBA and salary?
If you have the data available, whats the correlation between 2 year lagged .wOBA and salary for the same time period?
All the data is available at http://baseball1.com.
It seems that the proper way to run this study would be to use Marcel to figure out the expected future WAR of each free agent, correlate it to free agent salaries and than run multi-variable regressions to see what other player stats were significant in determining free agent salary. For example, if Moneyball’s thesis was correct, before 2002 you would get something like Salary = a*Expected_WAR – b*Walks + c*RBI, and after 2002, the walks term would not be significant anymore.
Philly, you’re of course right that there’s always more context that can be incorporated and Bradley’s points are a good place to start.
ekogan, in an ideal world that would work, although back in 1997, I doubt that anyone in MLB or otherwise was thinking about Marcels!
PizzaCutter, if the objective is to determine if some baseball stat or skill was under/over-valued by MLB teams, then one needs to start at “proper valuation” baseline. Marcel’s predictions seem like a good candidate for “proper valuation”. Doesn’t matter what method teams were using in 1997 to value players.
ekogan, you have two studies before you that attempt to answer an interesting question. You seem unsatisfied. The data is freely available (link above) for you to run your dream model. That the study could be done differently (and superior in your opinion) isn’t really helpful. It shouldn’t be Pizza’s job to fight off criticisms of imperfection when he’s the one who put forth the effort to conduct the study.
ekogan, it’s a fair enough critique. My goal here isn’t so much to determine whether OBP was _really_ over/under-valued, but to show that something rather interesting happened after Moneyball. The question of the best way to rate a player is nice, but for today, just not what tickled my fancy.
Do not apologize for Star Trek references. Even if that final episode was not as good as it could have been.
Dear Pizza – The link at the bottom to statistically speaking is dead. Have one of the other geeks (er, baseball fans) fix it!
But wouldn’t a continuation of Moneyball mean that offices are finding other stats which are inefficiently (cheaply) exploited in the marketplace? Maybe “reached on error” is the key to those World Series victories.
I’m not sure we’re seeing a reevaluation of OBP here. The convergence of the OBP line with HR/RBI could just reflect an increasing correlation of OBP and power among players. Let’s compare 1995 (your first performance year) to 2002, the year with the highest correlation to salary two years later (2004). Looking at players in their 4th or later season, and with 250+ PAs, the correlation between OBP and SLG in 1995 was .60. But in 2002, it had risen to .79. Same pattern with RBIs: correlation with OBP is .43 in 1995, but rises to .57 in 2002. The high-OBP players in 2002 were just more likely to also be power hitters than the high-OBP players of 1995. So they really were more valuable. The result is that the OBP r rises, while the correlation with the power stats is basically unchanged.
I would be careful about reading too much into year-to-year fluctuations. A lot of things can move these numbers: a particularly high/low OBP cohort of 7th year players, a few high-$ FA contracts that go bust, etc. One thing that might smooth it out a bit would be to use the player’s average OBP/HR/RBI over the previous three seasons combined.
And we shouldn’t be dismissive of the correlations with HRs and RBIs. In fact, SLG is a bit more correlated with a player’s runs created than OBP is. And RBI totals are a good proxy for playing time (and lineup position), which should correlate highly with a player’s true value and which OBP misses.
As to why OBP became more popular, the answer is three little words—Boston Red Sox. When they hired Bill James and proceeded to challenge the Yankees for domination, people noticed. There’s a lot more to what the Sox do than analyze OBP, of course, but just the fact that the team that hired “a nerd” stepped up in class was enough to convince other teams, too.
Pizza: Do you really think your second graph comports well with the Moneyball story? I don’t really see it. Up through 2003, the salary correlations with both OBP and HR are trending slowly up, OBP probably moving up slightly faster. This can’t have anything to do with Moneyball.
2003 is the first year that could be influenced by Moneyball, and multi-year contracts mean there will be a lag in the impact of any increased valuation for OBP. So it should be hard to detect any change until at least 2004, and probably later. It’s true that 2004 and 2005 look different, with the lines converging—and that’s what Hakes-Sauer saw. But it’s followed by two straight declines. And by 2007, the gap in correlations is almost as large as it had been in 2003. It’s hard to imagine GMs suddenly valued OBP much more, then forgot about just as quickly.
This is a tough issue to sort out, with so many moving parts: OBP and SLG becoming more correlated, offense improving at key defensive positions, greater spread in salaries overall (I assume). You also had a pool of unusually old high-OBP players in the 2002-2003 period (the top 25 players had mean age of 32), so we might expect some falloff in the salary-OBP correlation in following years. And of course there’s the introduction of steroid testing, which likely led to some unexpected changes in performance (may explain the post-2004 declines in correlation you find). Almost certainly, the reduced correlation you see for HRs after 2003 is a function of an overall decline in the variance of HR talent (whether due to PED testing or other factors). The smaller the variance in any talent, the smaller your salary correlation will be.
I think it’s important to separate BA, BB rate, and SLG as Hakes-Sauer do in their 2nd paper (unfortunately, their salary model and methodology is so flawed that we can’t have any confidence in their findings). The most plausible version of the Moneyball thesis is that BBs were undervalued. You might want to look at the salary correlation for BB rate alone.
(By the way, your low r for BA is because it has a low y-t-y correlation—that doesn’t itself show that teams aren’t paying for it. Using a 3-year average would likely show a strong connection.)
Guy, I have to wonder if the philosophy contained in Moneyball was old news inside the business even before it hit the shelves. When the A’s signed some of those guys, a few other clubs probably thought “what the heck are they doing?” Maybe they reverse engineered the A’s mindset. Maybe not. Here I’m just speculating.
Actually, for the part about the 2006-2007 dropoff, I have two theories. One is that OBP was a fad. The other is that while OBP is nice, there was just another stat that supplanted it.
Maybe teams put a higher premium on OBP even pre-Moneyball. But isn’t the simpler explanation that OBP and SLG became more correlated over these years? So the correlation between salary and OBP would rise, even if teams were still paying for power. Occam’s razor…
As for why the OBP increase dissipated so quickly, I don’t see fad as plausible explanation. For one thing, multi-year contracts make that a virtual mathematical impossibility. And once you understand OBP matters, why would you stop acting on that? Honestly, these are small samples at the single season level. A couple of injuries, two or three retirements, and a Travis Hafner or two can send these correlations soaring or plunging. 2004 and 2005 were probably just anomalies.
Phil/Pizza: check out the 2nd version of Hakes-Sauer: http://business.clemson.edu/Economic/storage/papers/Hakes-Sauer-Moneyball-IJSF-Sept07-rev3.pdf. They look at BB rate, and find a jump in the salary coefficient in 2004-2005.
But there are 2 problems:
1) it returns to normal in 2006;
2) it varies wildly from year to year (as do other coefficients), so it’s hard to have confidence that the 2004-2005 bump is meaningful.
does the (apparent) impact of steroids, and subsequent tack away from them post-2004 have any bearing on this? Could it be that the stronger case for the “long ball” in more recent years is that not everybody is hitting 50 of them any more, therefore the value of the four-bagger increases due to relative scarcity?
Seconding Guy’s point … I don’t really see why BB isn’t the variable people look at, instead of OBP. Nobody is arguing that hits were undervalued, right? And OBP is just hits plus walks.
The moral of Moneyball couldn’t be that OBP was undervalued … it was that *walks* were undervalued.
Pizza,
did you consider multi-year contracts just in their first year, or every year? In 2004 GM’s payed players for what they did in 2001-2003 (mostly). But if they had multi-year contracts, you can’t include the same players in 2005.
Also, let’s not forget: Yankees 1995-2001 were 2,3,1,1,2,5,6 in OBP in AL. Only in 1996 were they relatively better in BA (2nd vs. 3rd), they were always worse relatively in SLG, and they were worse relatively in HR every year except 2001, when they were 4th in HR. Most of the time they were below-average in HR, in 1995 and 1996 12th in AL. In 1995, 1997 and 1998 they led the AL in walks. That, and more numbers-oriented managers who noticed such things, probably had as much to do with OBP popularity as BoSox and Moneyball.
Davor, I made no adjustment for when the contract was signed, as I didn’t have those data handy. Worth a shot.
Pizza, if you didn’t consider the time of the signing, the data is probably flawed. Take Giambi, for example. The data Cashman had was his 1995-2001 seasons. His pay for 2002 – 2008 seasons was based only on 1995-2001 data (probably mostly on 1999-2001 data). His performance in 2003 had nothing to do with his salary in 2005.