Visual Baseball: Introducing the BatCode
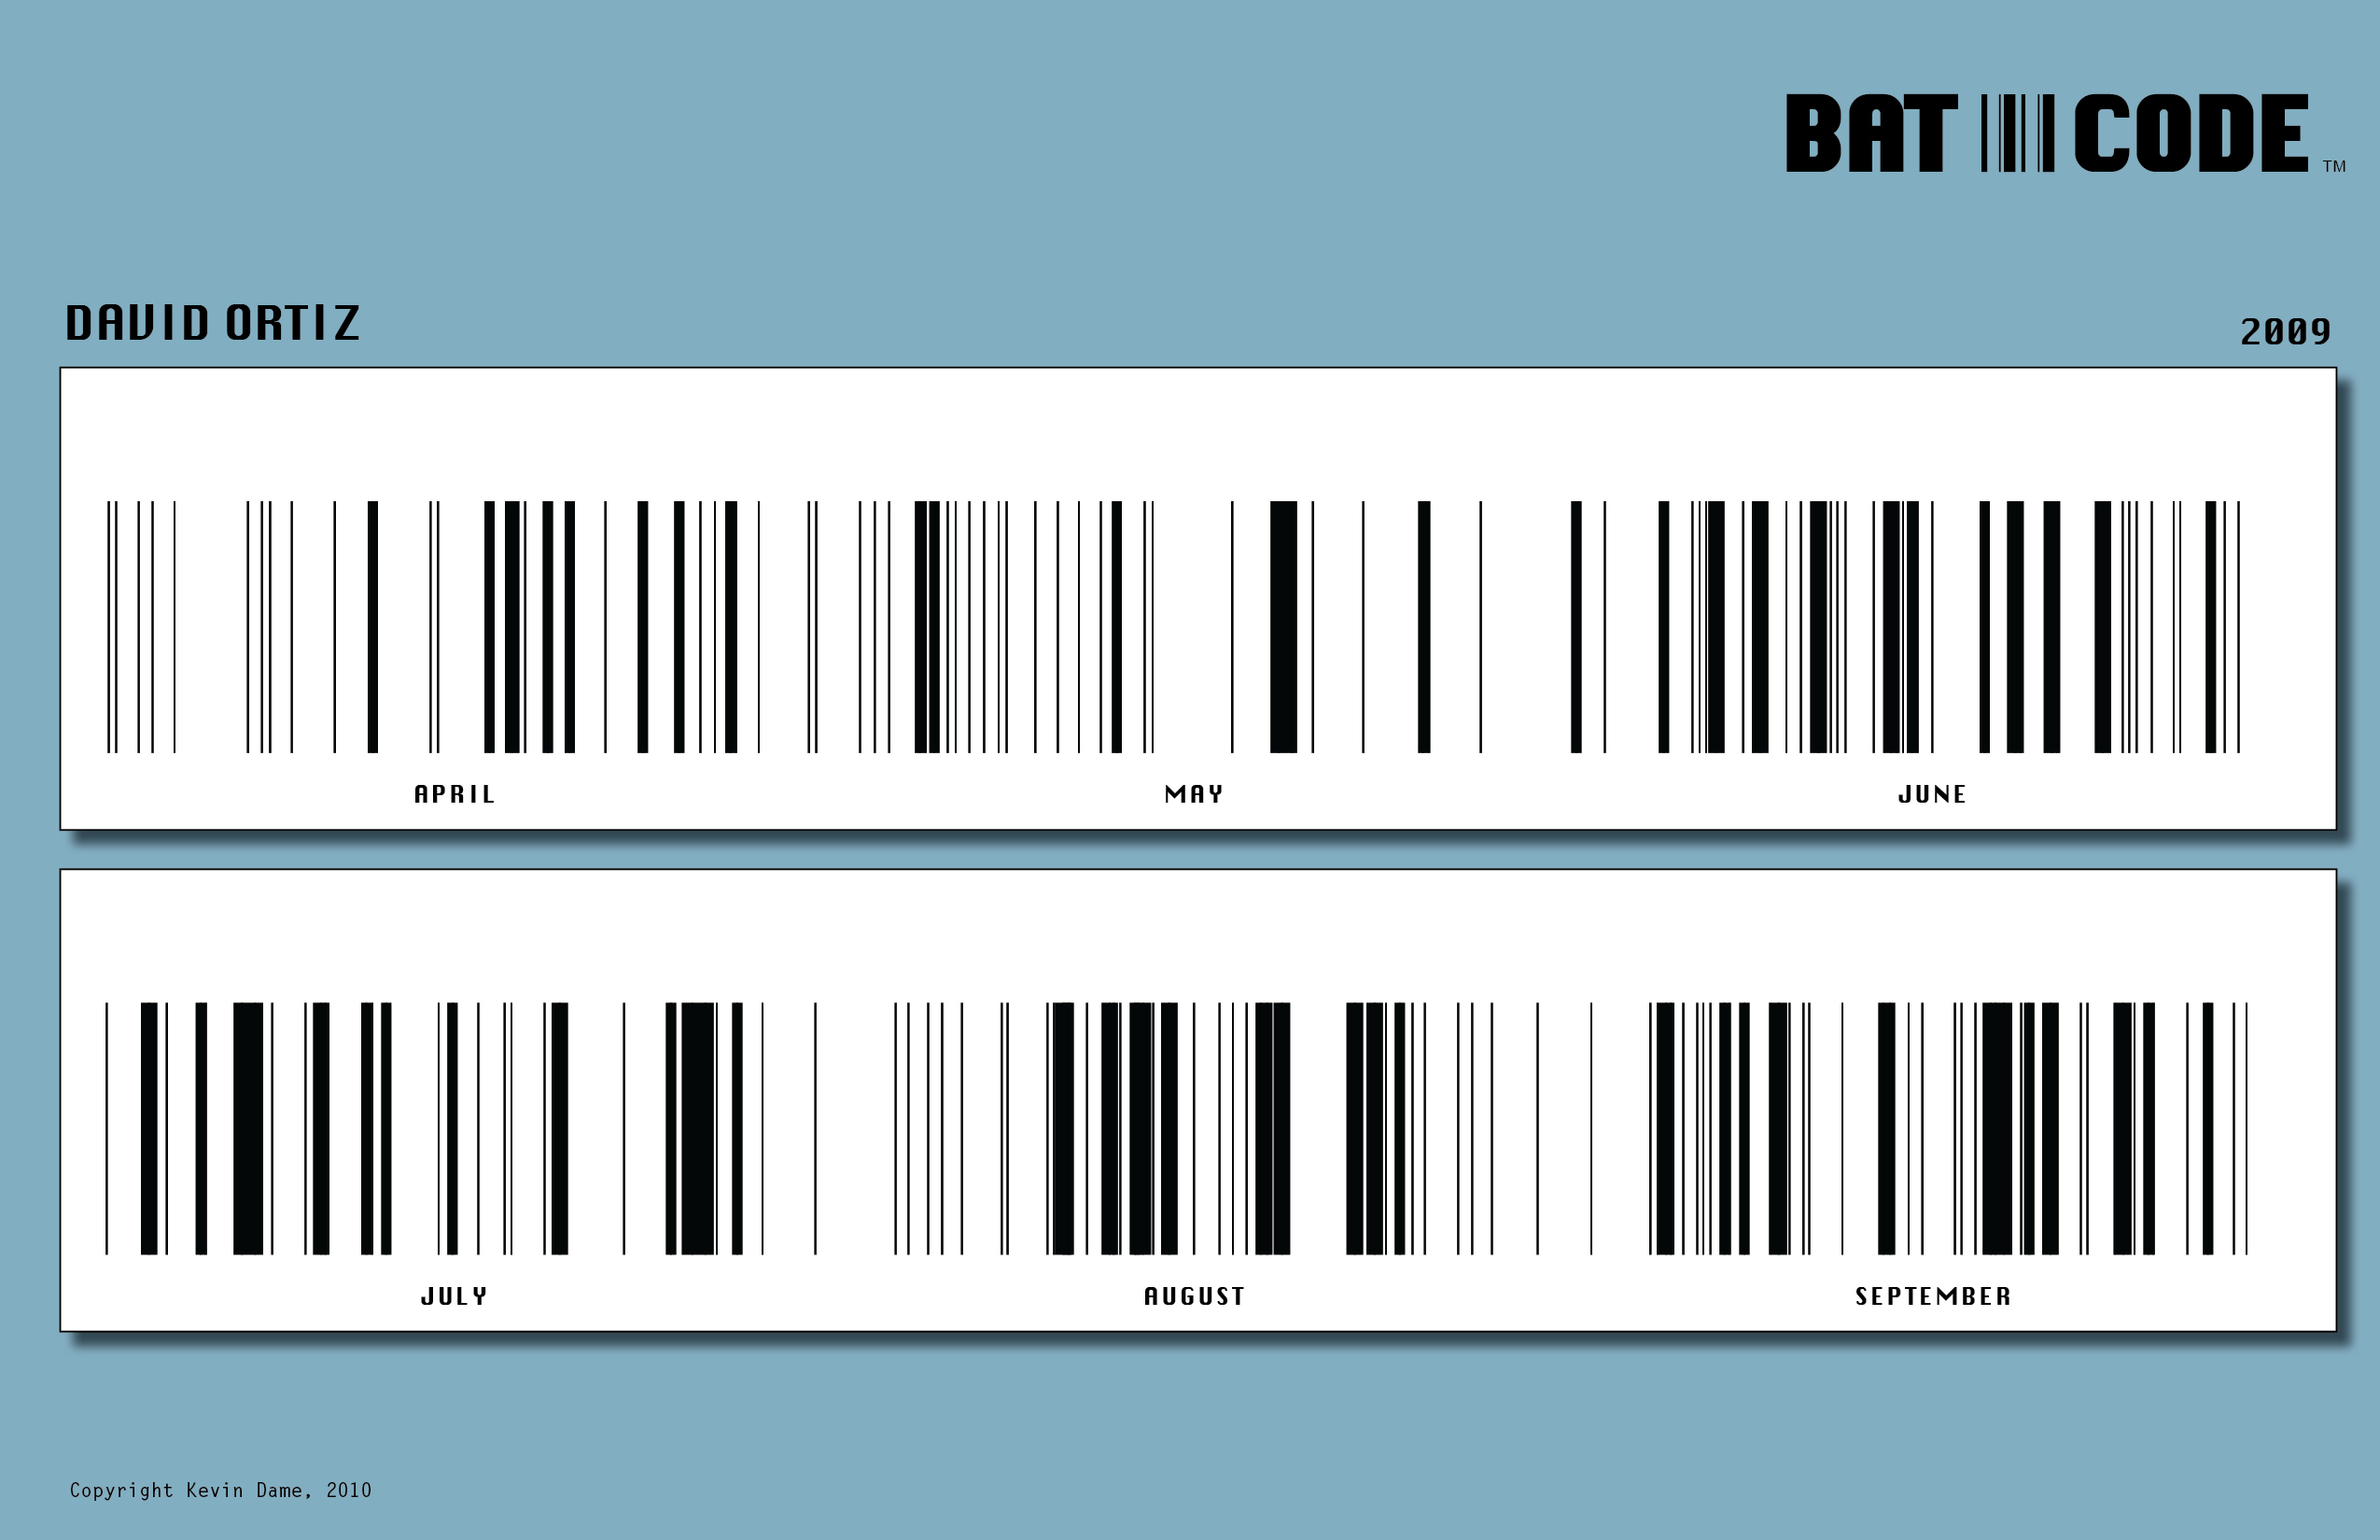
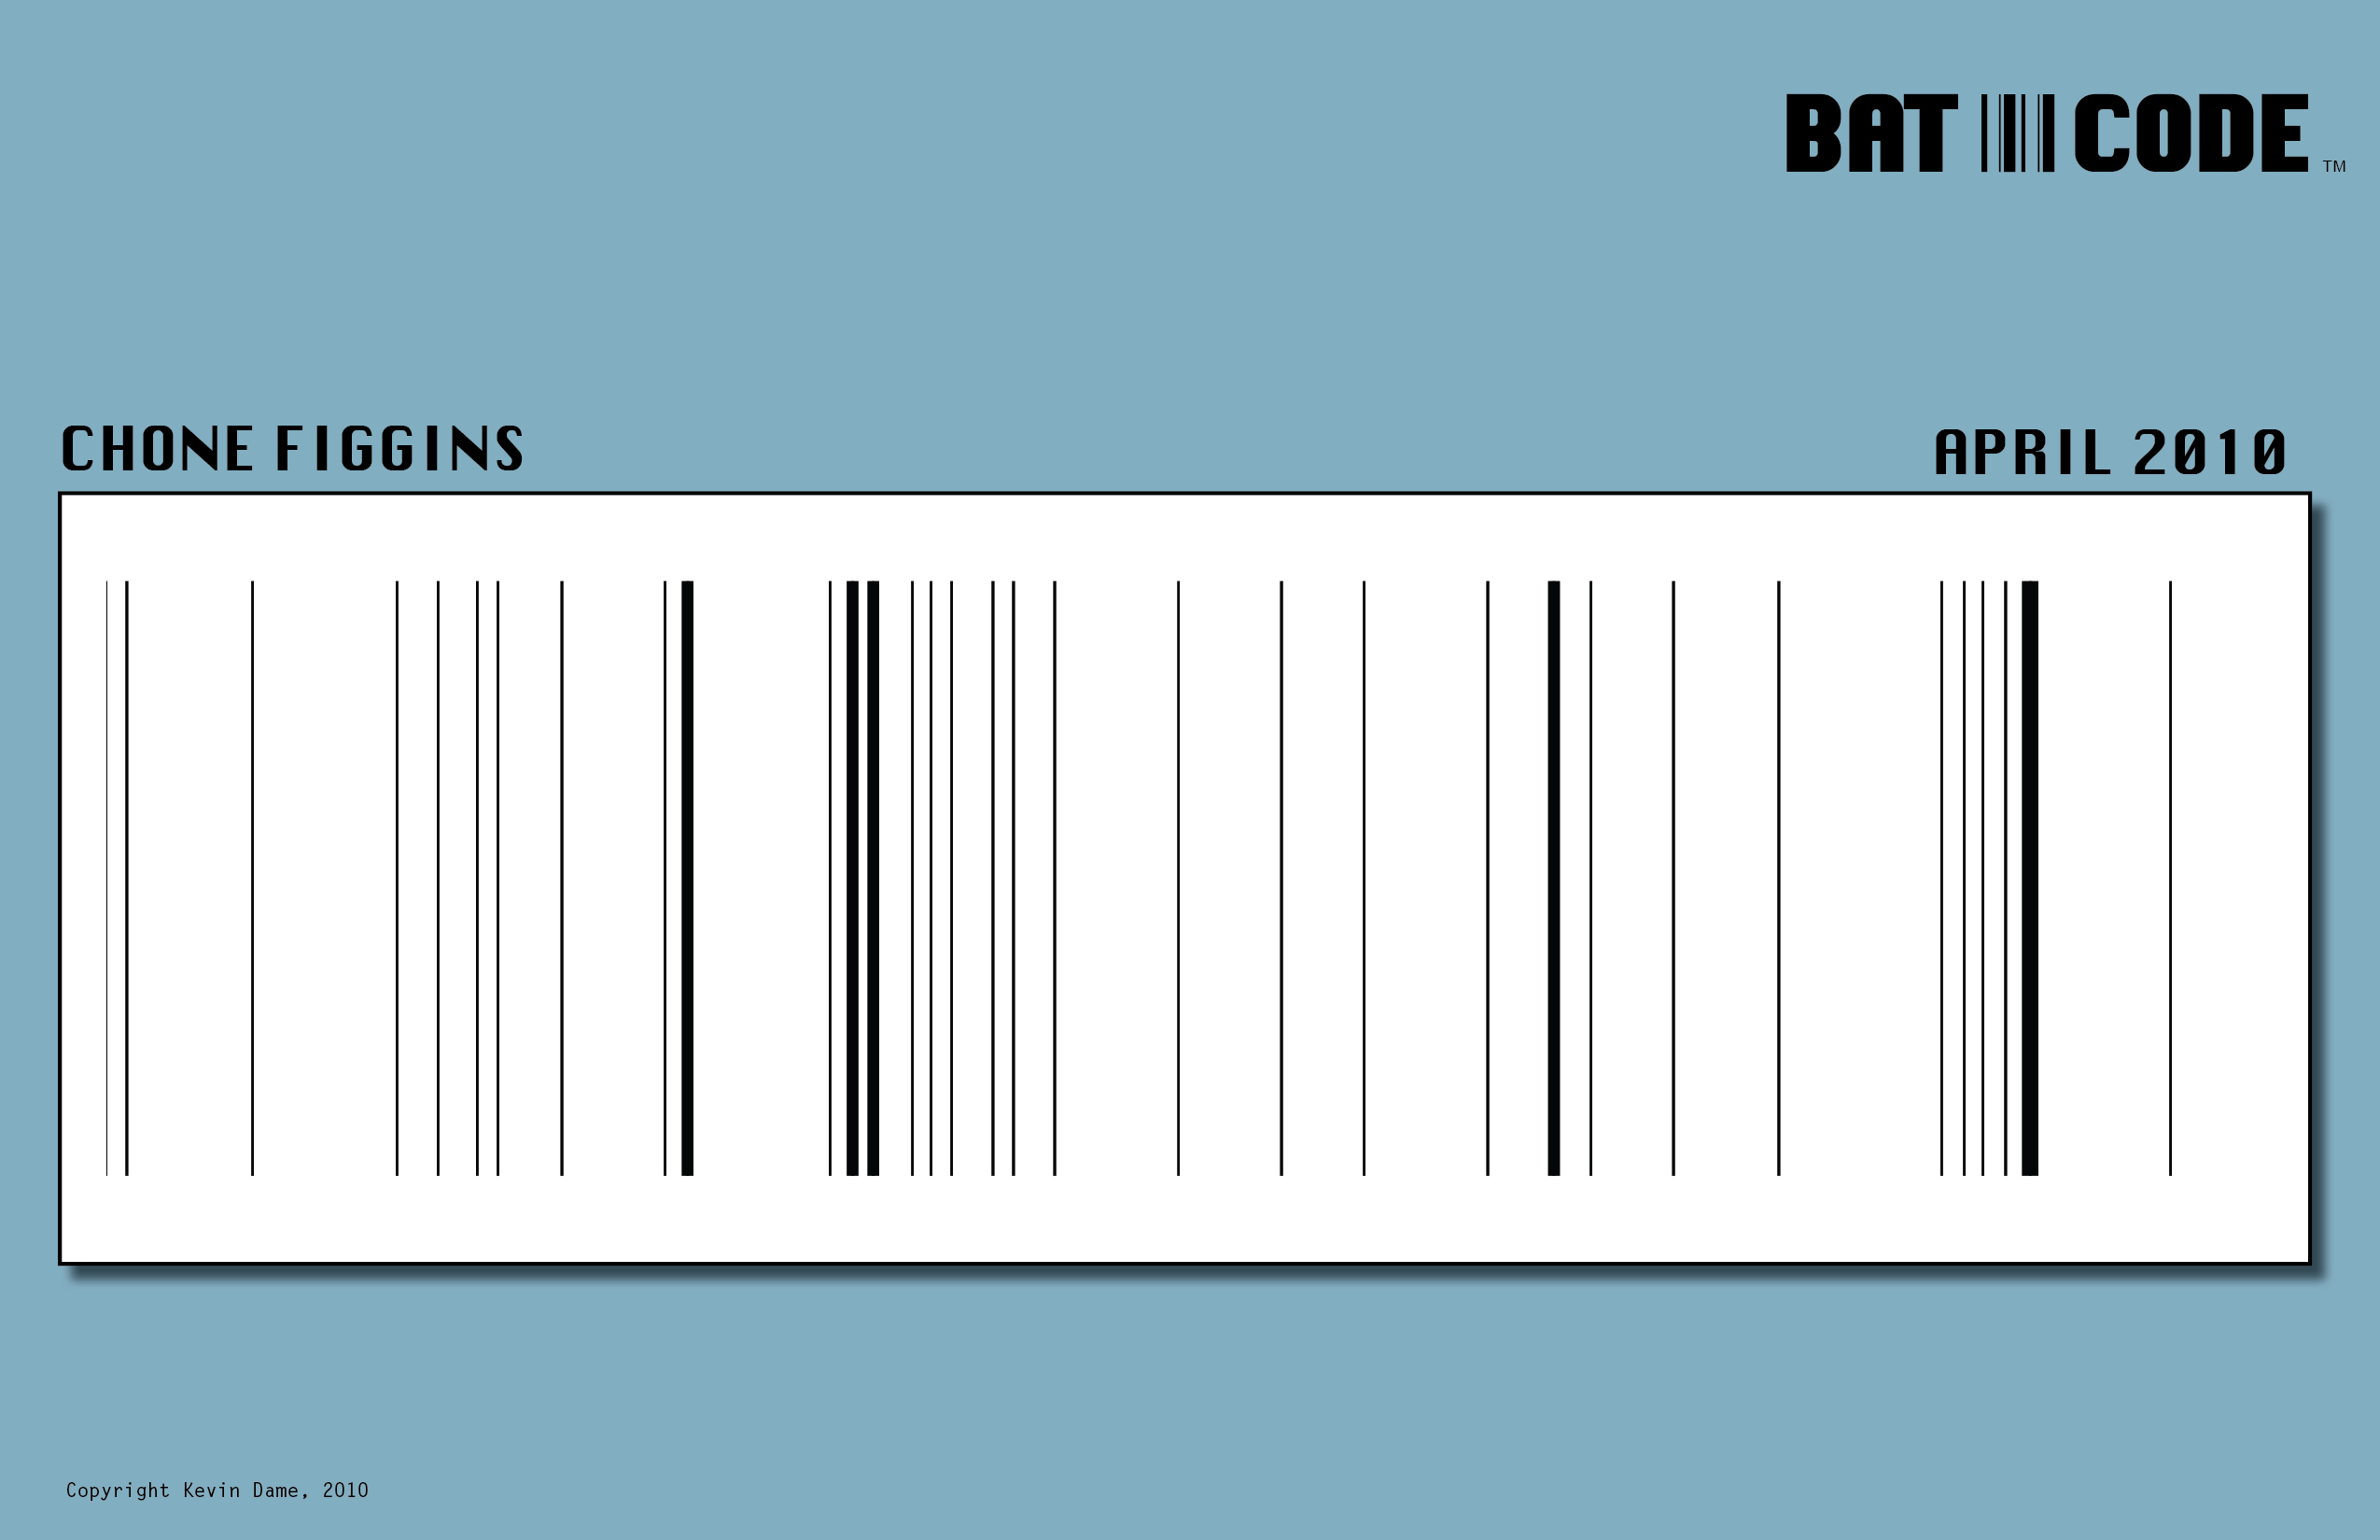
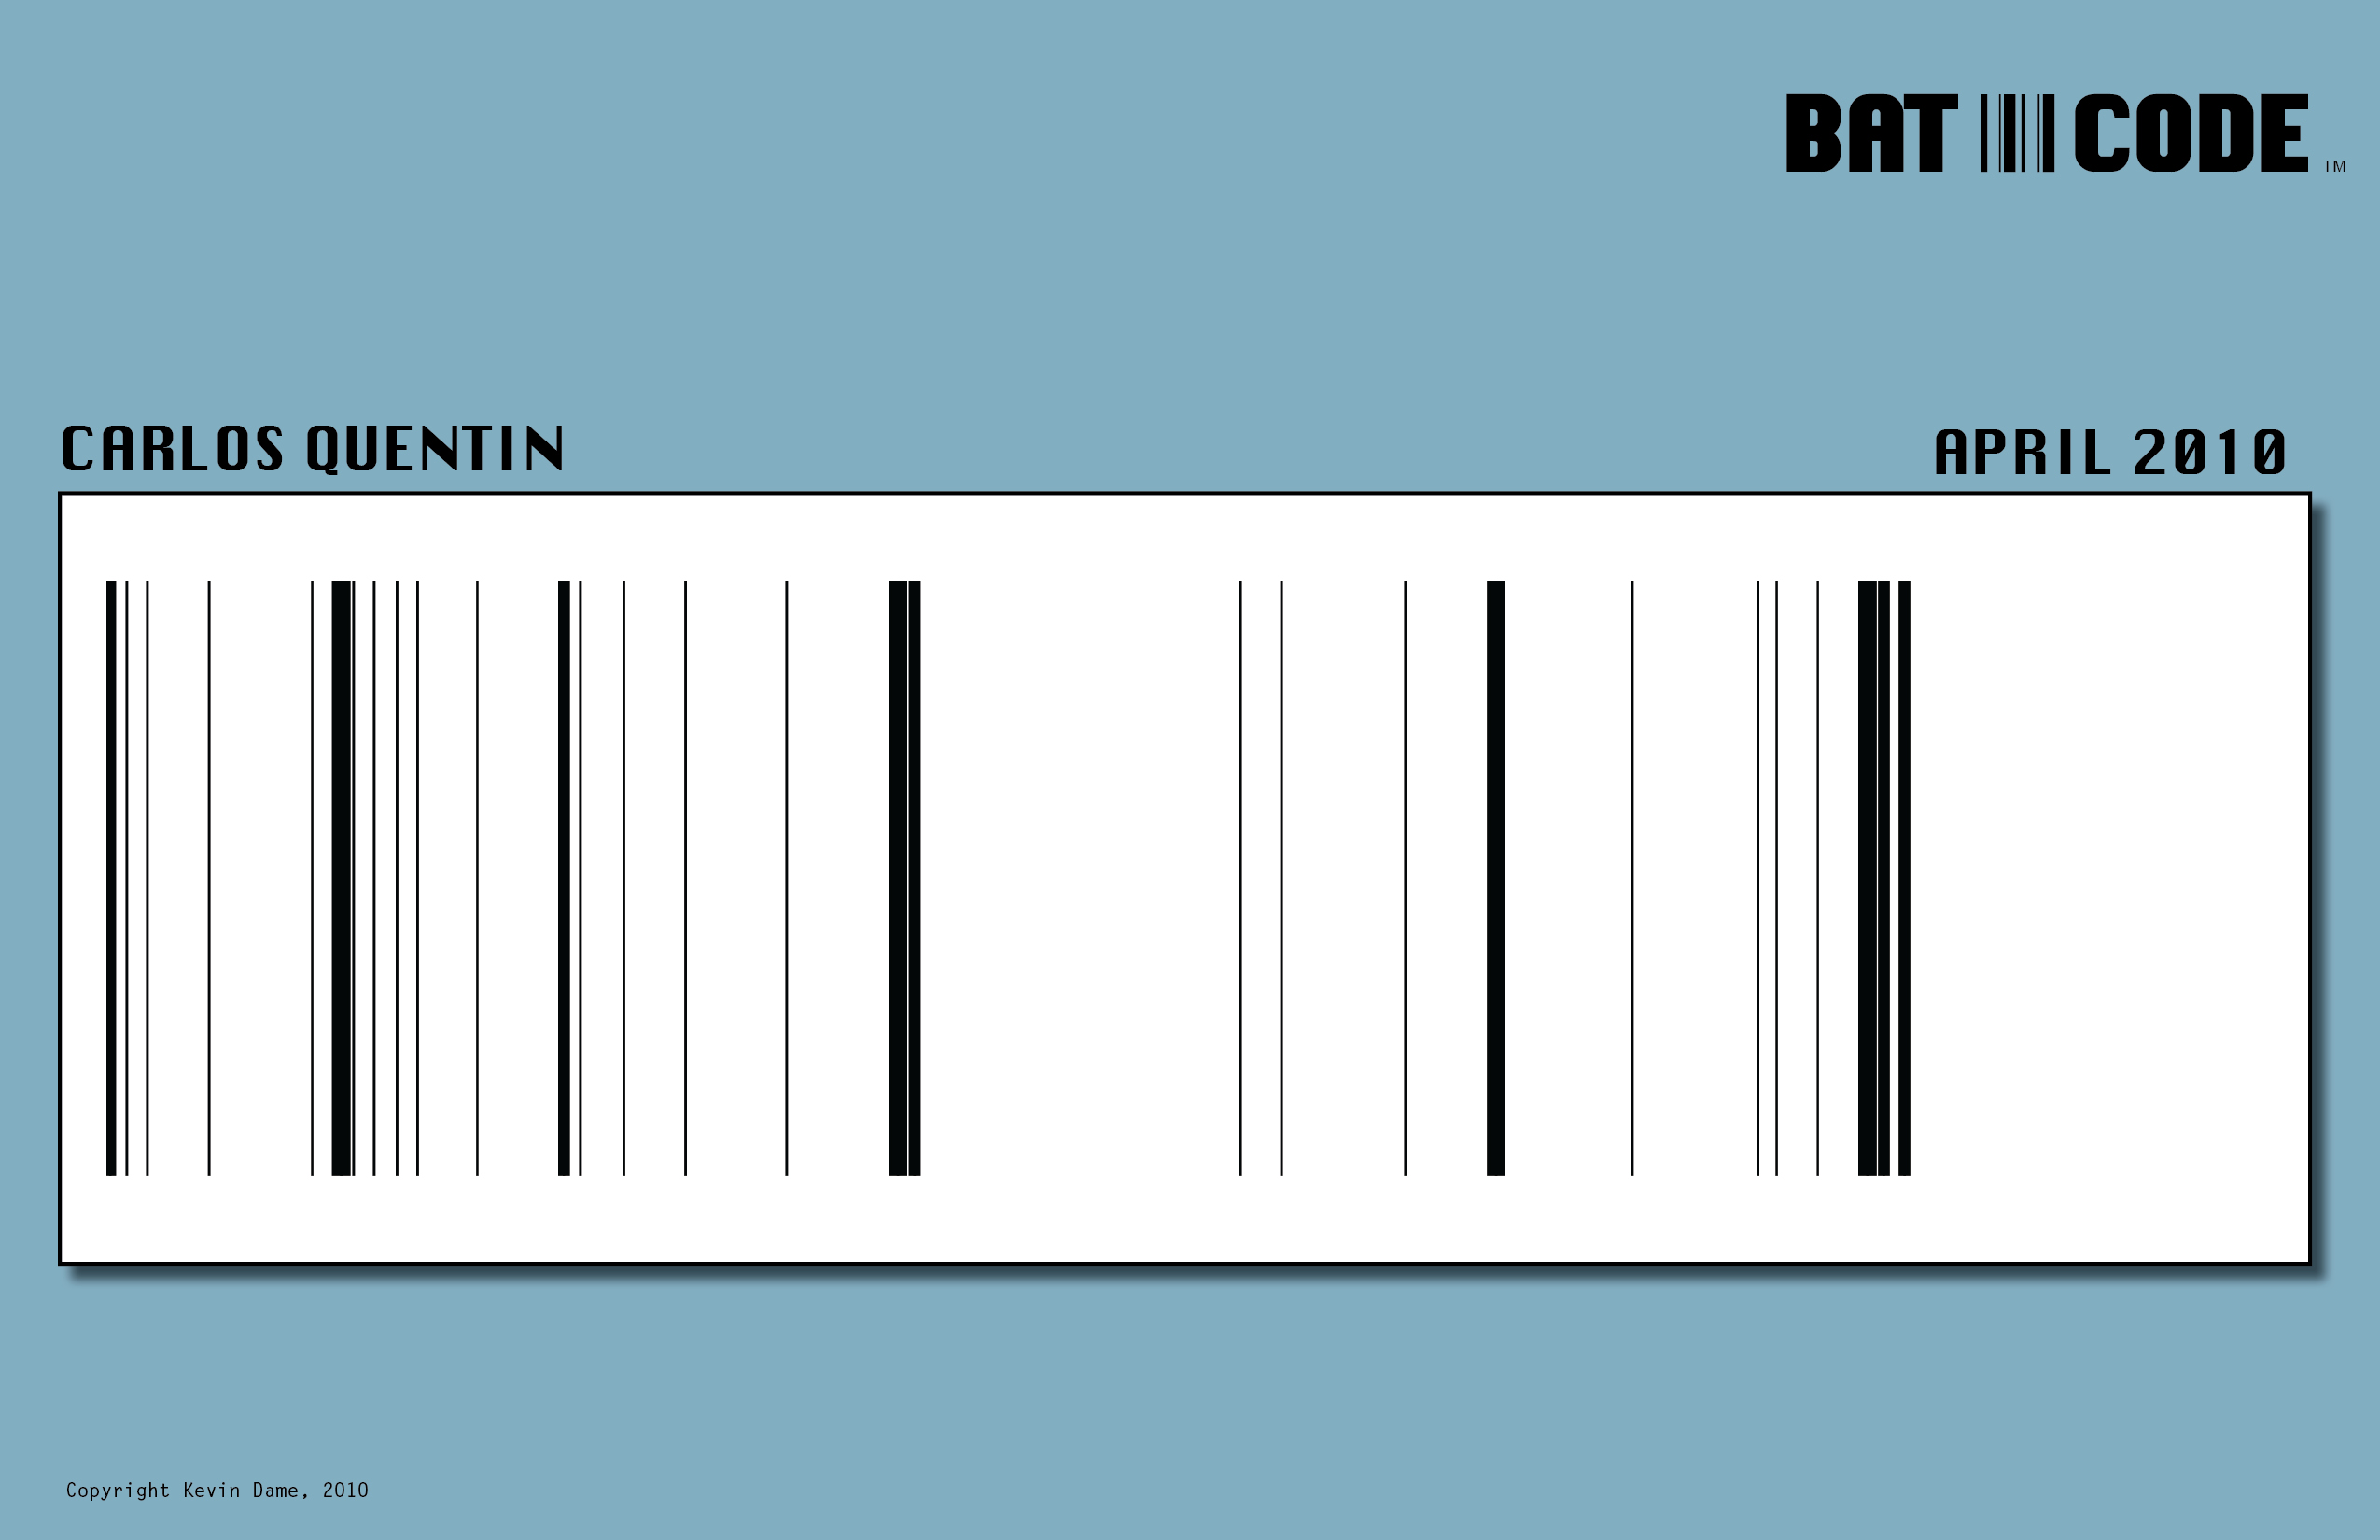
Happy Friday. Here’s an experiment that I’d love some feedback on. I’m using the barcode metaphor to visualize a hitter’s performance for each at-bat. Line thickness represents the type of hit (thinnest for walks and singles, thickest for homeruns) with each at-bat separated by a space. Big white areas represent long stretches of outs. Lots of lines represent a string of hits, with thicker patches representing power. Let’s take BatCode for a spin.
Here’s one of the league’s best hitters – Robinson Cano – for the month of April. Pretty consistent and with lots of power throughout.

Here’s a player – Curtis Granderson – who got off to a hot start but has really tailed off (both in terms of OBP and power).

And here’s David Ortiz’ entire 2009 season with all the ups and downs.
Click the link below to see more, including historic seasons of Bonds, Ichiro and Sosa.
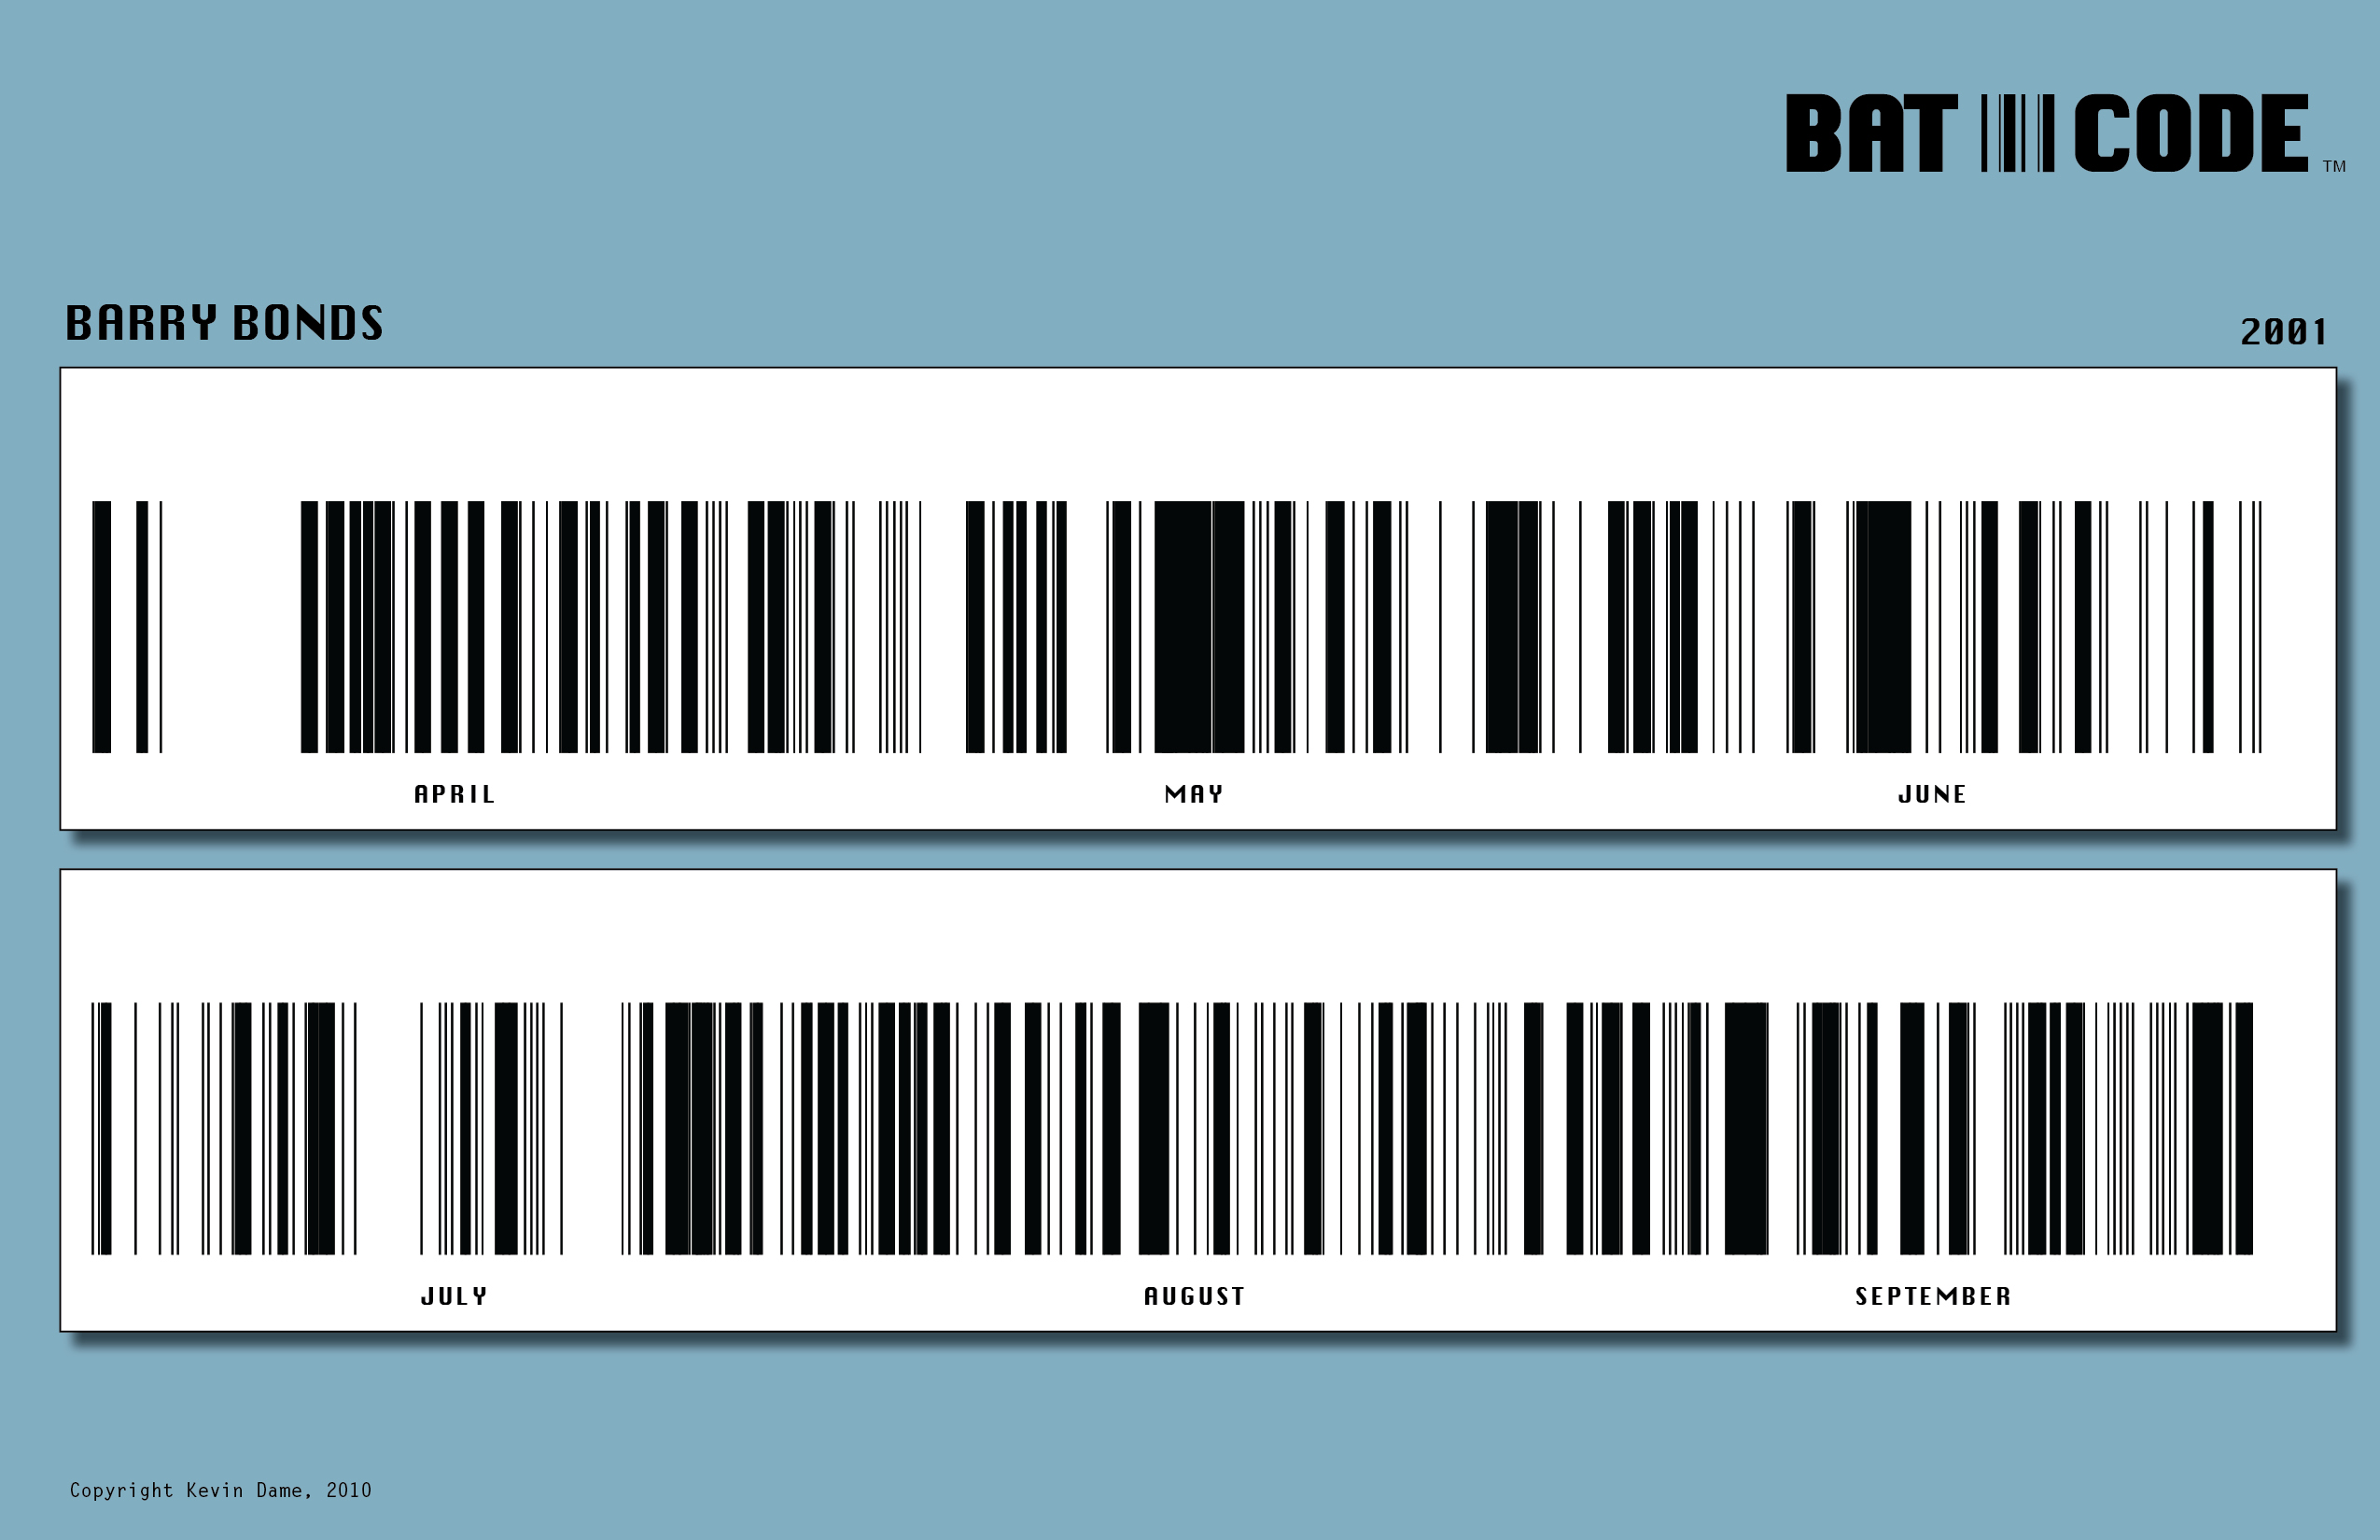
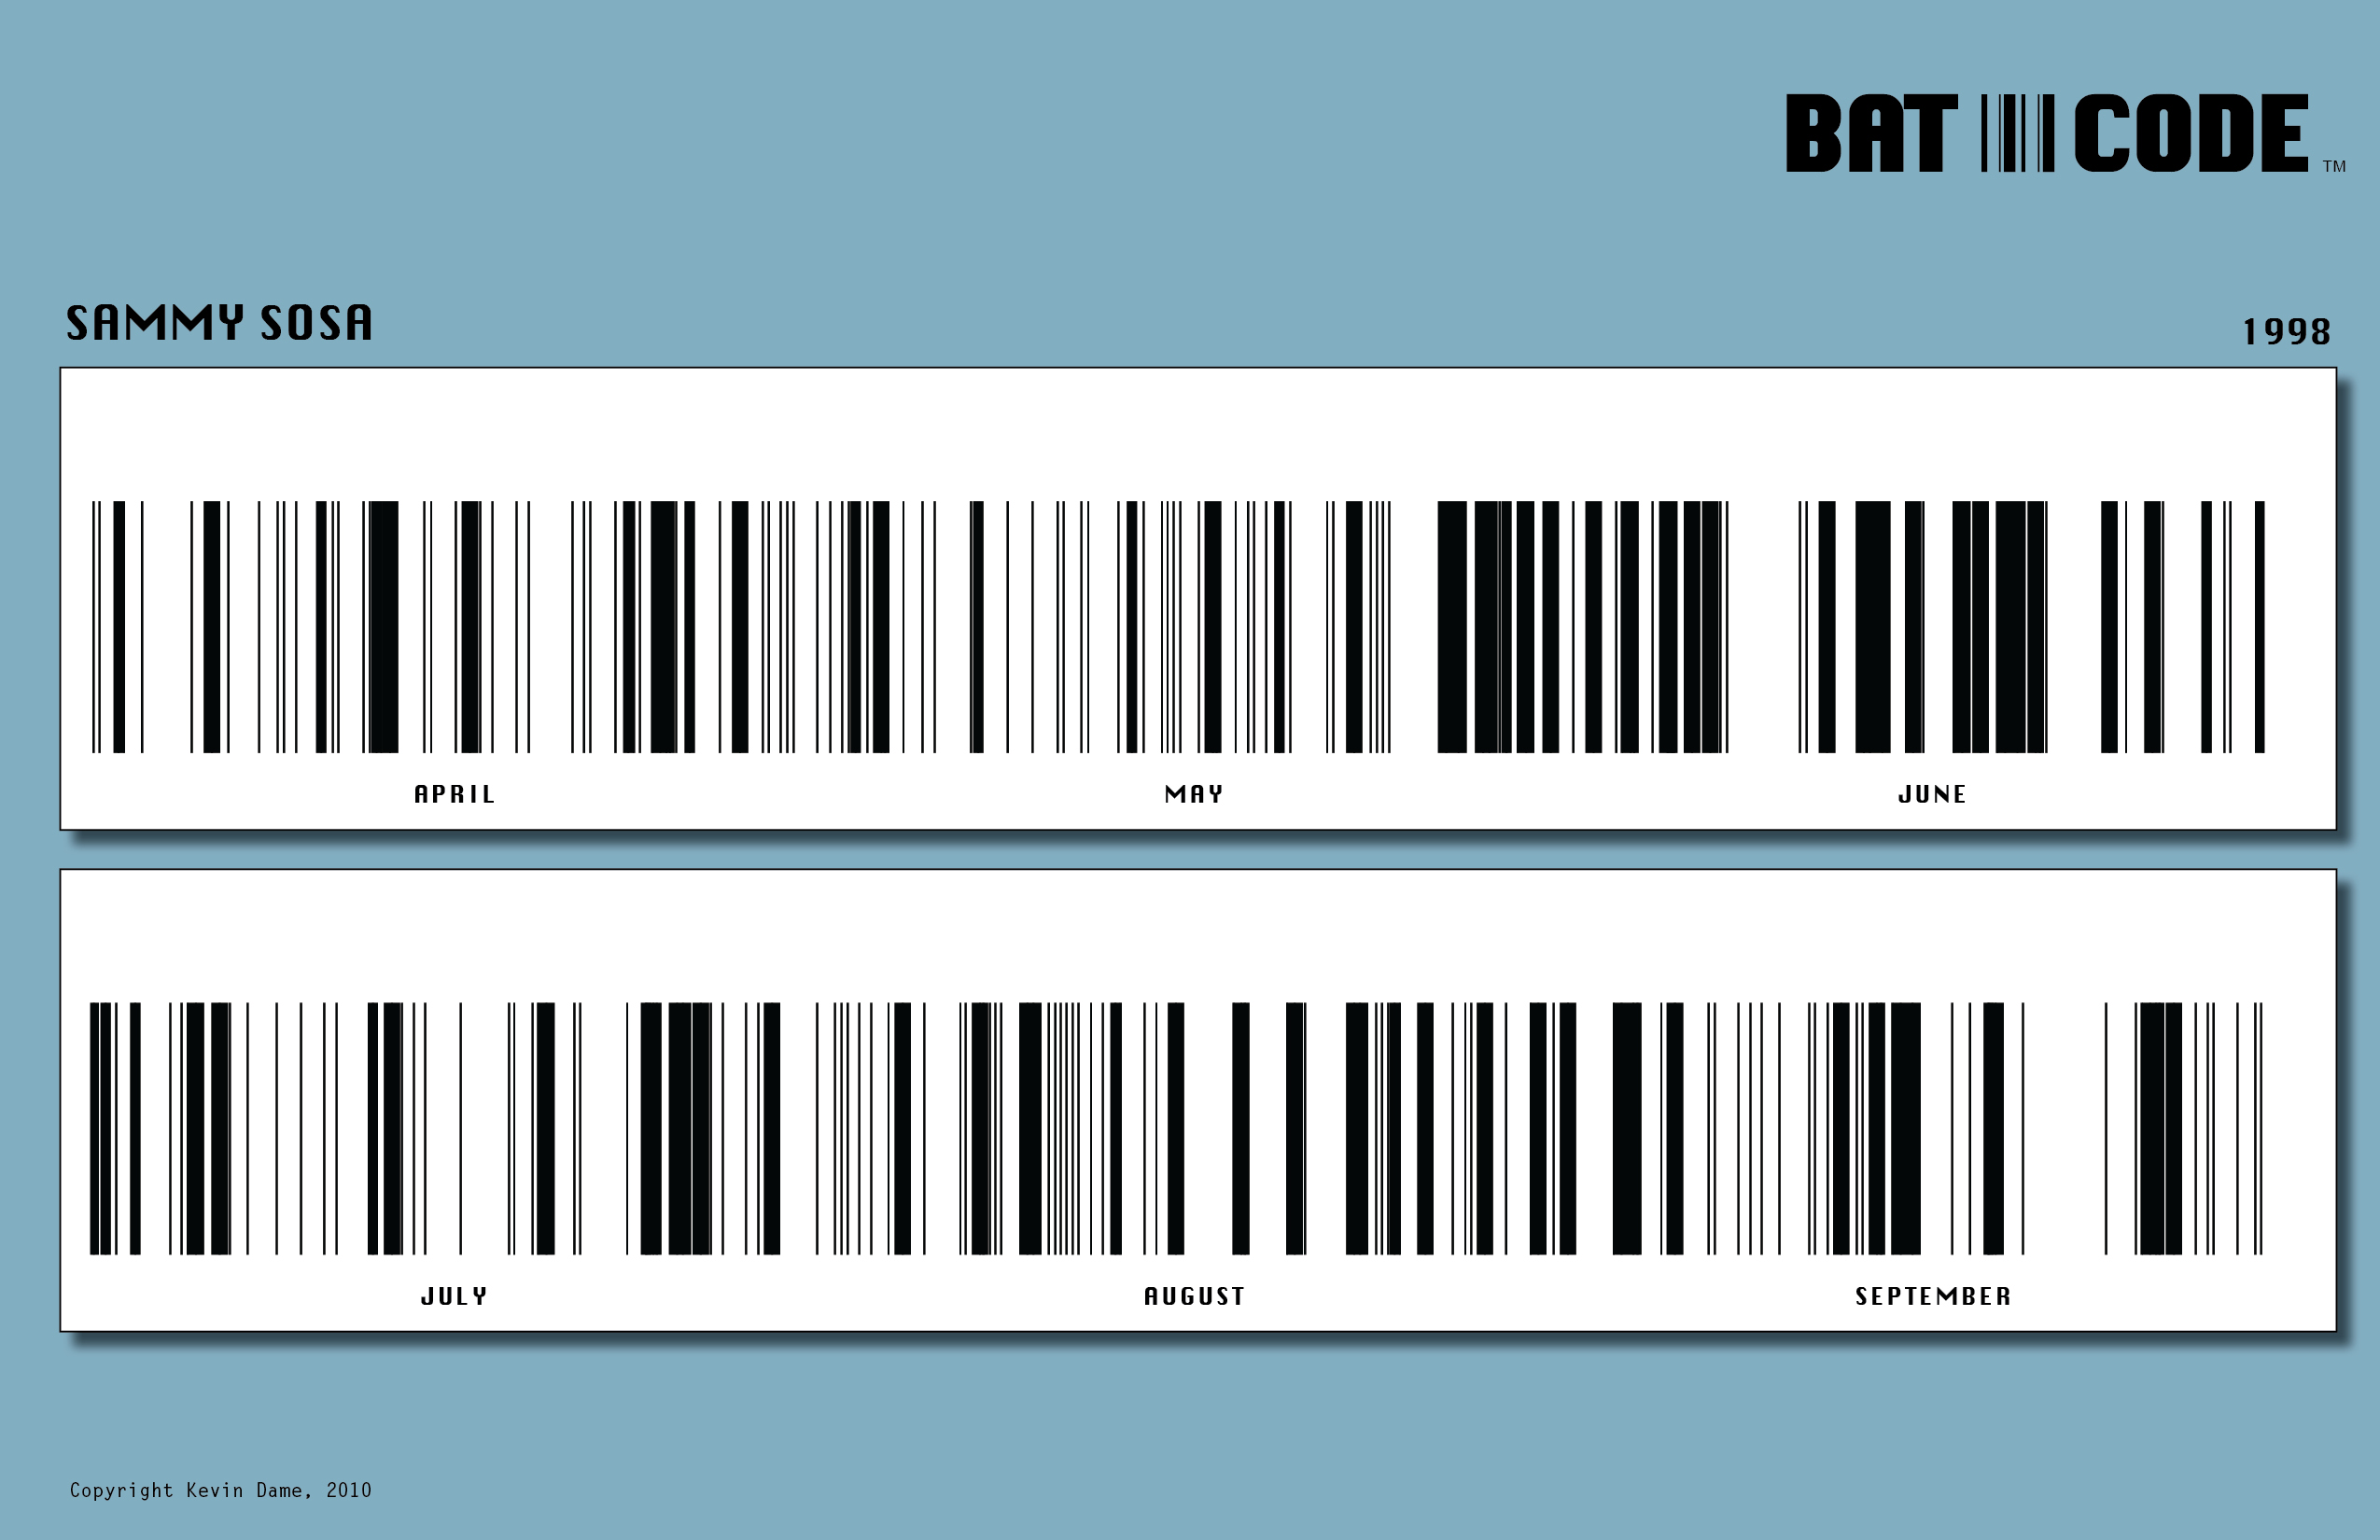
I got a request for Barry Bonds’ 2001 season, Ichiro’s 2004 season, and Sammy Sosa’s 1998 season. These BatCodes are pretty remarkable (albeit steroid-laden for two out of the three):

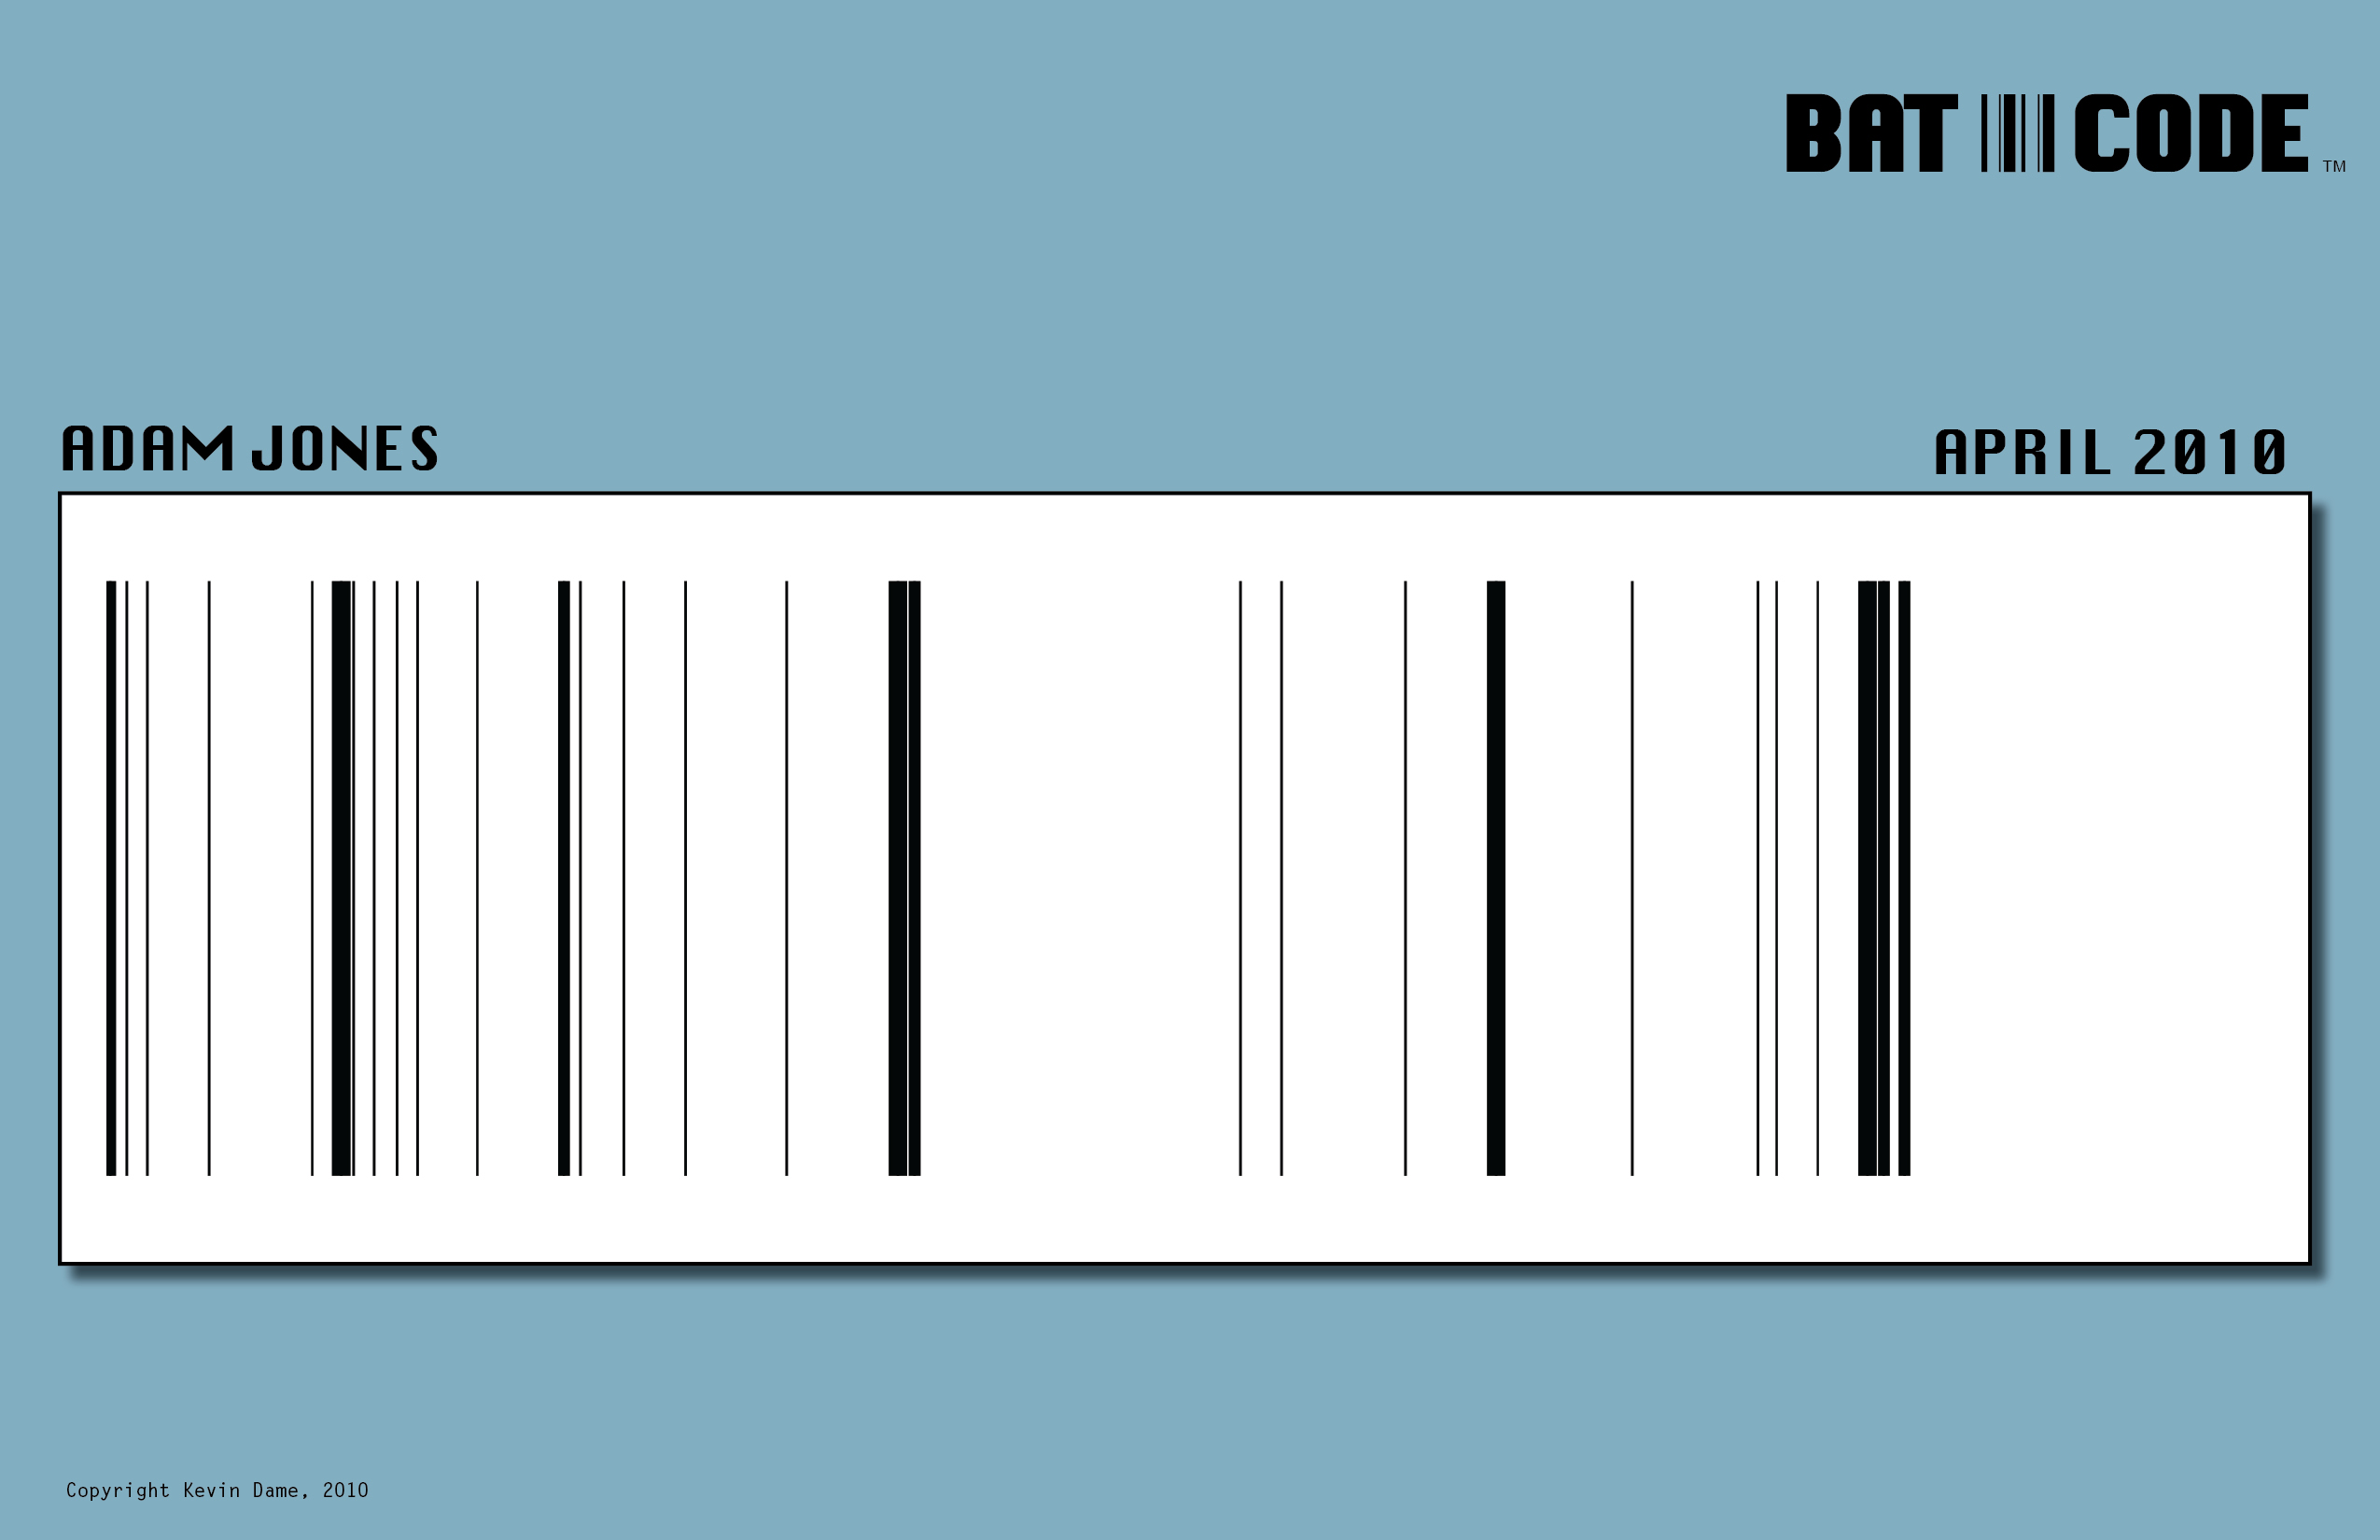
And here are a few more April 2010 BatCodes. What insight do you get from scanning them?

So if a player hits 4 singles in a row does it look just as thick as a home run?
Also, I don’t see the link to click for more.
Hi JK.
There’s a space between each at bat. So 4 singles in a row would look like 4 thin lines with spacing in between. If you look at Cano’s BatCode you’ll see he started the season with an out, a double, and a single consecutively.
I’ve been able to automate these in Excel (which has made it easier and faster to crank out more) but there’s a limitation in Excel. For thicker lines it doesn’t preserve as much spacing as with thinner lines. For example, with back to back homers the spacing between at bats is harder to see than for back to back singles. So there’s some distortion to how this is visualized, although I’d say overall it communicates the basics. If there’s interest in this as a visual medium I’d want to solve this spacing problem somehow.
There’s a red link that says “click for more” at the bottom of the post. Click that and you’ll see several more BatCodes…
Still not seeing the link. I really like this though. It seems that this would be much more helpful than seeing that somebody hit .278 over a season, when that season is probably filled with hot-streaks and cold-streaks and will give a very good visual impression of how consistent a batter is.
I assume this is only going to show hits, and not walks/errors/stolen first bases. Very cool though.
Thanks JK. If anyone else is having trouble seeing the red “click for more” link, let me know. Not sure what’s up with that…
Another option (to see more) is to click on the post on the left side of the site under “Most Recent Comments” and you’ll see the entire post.
Ok, the problem was I was seeing them all from the get-go. So the link wasn’t there, unless you go to THT-Daily. So I was seeing the result of the links to start with…
Anyway, I think it would be really cool to take a streaky player and do year over year to see if there are noticable patterns.
Interesting stuff! Can’t wait to see a barcode reader that translates them back again..
Just a cosmetic tip though, you should also include a mark that shows where the month/barcode ends. So you can see how many at bats a player has had during the month, that or make the graph as big as the number of at bats so you can still place them together like you did with Ortiz.
Can’t see the click more link either, got a Puljols barcode back there..?
This is a cool way to quickly see hot and cold streaks.
I’d love to see Bonds’ 73 homer season, Sosa’s 20 homer June in 1998, and Ichiro’s 262 hit (with 224 singles!) 2004.
This is awesome!
I agree with David. These are awesome, Kevin.
You don’t have to say “click link for more.” If there is more, our site says it automatically but only on THT Live.
One thought after staring at these for a few seconds: It’s hard to judge these unless you’re looking at several at the same time, because you don’t know what to think of the white space.
I think the full season codes are best (or, three months on a “line”) because there is less wasted white space. So I’d suggest picking a set dimension (like three months on a line) and keeping to it, even if less time has been played. You could “gray” the time remaining for players who have only played one year so far.
yeah, i’ve been thinking about the white space. does it represent a player scuffling or a dl stint or a trip to the bus leagues. easy fix though; red blocks could represent the dl and..say…green could represent the minors or other designation. then the white space would truely represent a major league slump period. and, yes, i know that is an incorrect use of the semicolon.
super idea. you get a quick overview of streaks, power and hitting. in a sport where stats have become almost intrusive to to the information they’re suppose to clarify, this system synthisizes everything into a quick snapshot of a streak, season, career. no matter if the lines lose their individual integrity, its a useful tool.