Tommy John Surgery Success Rates in the Majors
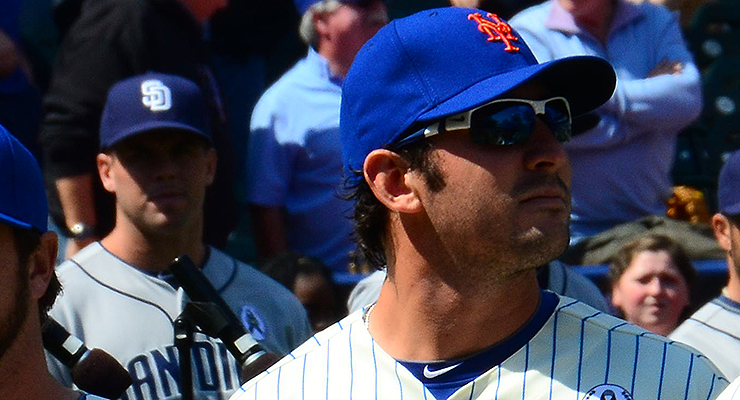
Matt Harvey is returning from Tommy John surgery this season. (via slgckgc)
There has been a growing public perception that with today’s skilled surgeons and rehabilitation experts, undergoing Tommy John surgery is more of a one-year layoff in a major league pitcher’s career than a procedure that puts his career in jeopardy. A corollary of this belief is that trying the rest-and-rehab route on a partially damaged ulnar collateral ligament is not worth the effort, as it ends up only delaying the inevitable Tommy John surgery, which while costly is a nearly automatic method of restoring a pitcher’s health so he can pitch at the major league level again.
A number of studies both in the academic arena and the public research space have arrived at similar success rates for Tommy John surgeries. The American Journal of Sports Medicine has published a number of such studies. One reported a return to major league baseball rate of 83 percent, one reported a return rate of 80 percent, and a third reported a return rate of 79 percent. My own Tommy John surgery database calculates a running total of return rates to MLB, for which the current rate for all surgeries performed before the end of 2013 is 78 percent. So right away we can see that full recovery from the surgery is not so automatic, that only four of five pitchers who undergo the surgery after making the majors return to pitch there again.
The definition of “success” in each of those four studies is a return to pitch in a single major league game. This is certainly an understandable and worthwhile metric to measure. It implies that a number of rehabilitation milestones were reached and that his organization feels the pitcher is ready for big league action.
I would submit that a more relevant question would be how often pitchers return and contribute in a meaningful way. After all, a pitcher returning to make an appearance or two over a mere handful of innings, then falling out of the major league level for whatever reason, can hardly be considered a successful outcome for the player or his organization.
Even with this in mind, there are a number of ways one could define a “meaningful contribution.” As one example, it would be possible to compare each pitcher’s performance to what it was before the injury. For the purposes of this study, though, I will look solely at the quantity of game action a player participates in following the return from the surgery. Merely appearing in major league games and accumulating innings pitched implies that a pitcher is both healthy enough to perform, and performing at a level deemed high enough for the organization to allow him to log major league innings. This feels like a more robust method of analyzing what can be expected from pitchers returning from Tommy John surgery.
Below are two graphs that attempt to convey the results of looking at recovery in this manner. The vertical axis in each graph signifies the percentage of major league pitchers who have returned from Tommy John surgery, while the horizontal axis shows the number of post-surgery game appearances in the first graph and the number of post-surgery innings pitched in the second graph. The set of pitchers has been broken down by era in which the Tommy John surgery took place: 1974-1999, 2000-2009 or 2010-2012.
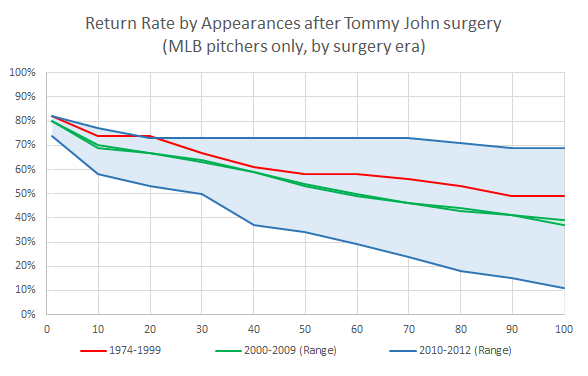

The data for 1974-1999 are complete, as all 57 major league pitchers who underwent the surgery in that time frame have retired. There are still 21 of the 138 major league pitchers who underwent the surgery between 2000 and 2009 still active. For this reason, this era is shown with upper and lower bounds on the return rates, which depends on the future participation level of these active pitchers. The final, most recent, era consists of 62 pitchers, of whom 42 are still active. Once again, the return rates are shown as a range of potential outcomes, which is relatively massive given the recency of the surgeries and the number of pitchers involved.
Several interesting observations can be made from the graphs. To start, it is apparent that overall more pitchers returned to pitch at the major league level for longer periods of time when they had their surgery last century than in the 2000s. This is represented by the green band being lower than the red line in both graphs. Consider the median number of post-surgery appearances and innings pitched based on the era:
| Post Tommy John Surgery Medians by Surgery Era |
|---|
| Surgery Era | Appearances (G) | Innings Pitched (IP) |
| 1974-1999 | 89 | 167 |
| 2000-2009 | 58-61 | 94-100 |
| 2010-2012* | 29 | 47 |
*includes games until end of 2014 season
The fact that the innings pitched totals look somewhat more disparate than the games played totals is at least partly a result of the increased use of pitcher specialization in more modern baseball. Pitchers are typically not asked to face as many hitters in a given appearance as they were before the turn of the century.
The range of potential outcomes for pitchers who have undergone Tommy John surgery since 2010 is still too wide to compare. What is possible to see from the graphs is that it will take the best case scenario from this point forward for this most recent range of years to live up to the 1974-1999 era as far as having pitchers return for at least a single major league appearance.
I find these numbers enlightening, but also quite staggering: In the most recent complete decade (2000-2009), the median result for a major league pitcher returning from Tommy John surgery is appearing in about 60 games or logging about 100 innings pitched over the rest of his major league career. That’s about the number of appearances we would expect from a typical healthy reliever in one season. It’s roughly the number of innings pitched a healthy starting pitcher would amass in half a season. That’s not the sort of post-surgery career one might envision.
To answer the question I am asking, it is important to include pitchers who did not return to the majors at all. But if you’re curious about the typical post-surgery career for just those pitchers who do get back to major league baseball, the median games played was 102 and the median innings pitched was 167 for all major league pitchers who underwent the surgery between 1974 and 2009. Even these totals hardly make for exciting post-surgery careers.
While the numbers are far from complete, it is also worthwhile understanding that of all major league pitchers who had Tommy John surgery in the past five years — who have had one to four seasons to theoretically recover (2010-2013) plus one to four seasons to theoretically contribute (2011-2014), the median contribution has been 29 appearances and 47 innings pitched. So: that mental math you do when it’s announced that a pitcher on your favorite team is having Tommy John surgery, when you picture them contributing at the same level as you’re used to one calendar year from then? It’s not as reliable as you may believe.
It would stand to reason that a 23-year-old pitcher a year or two into his major league career may have a different typical recovery profile than a 35-year-old journeyman reliever. While seeing the overall numbers is helpful, it also seems pertinent to break down the return rate information by age of the pitcher at the time of surgery.
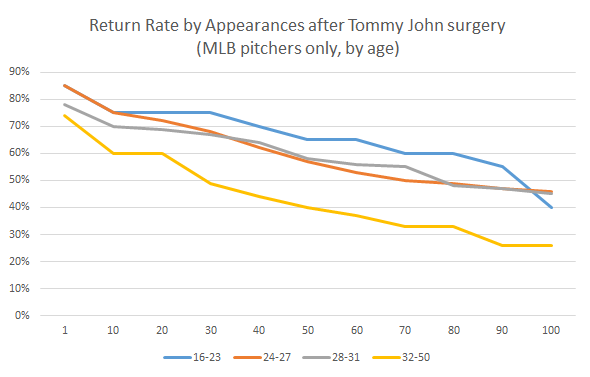
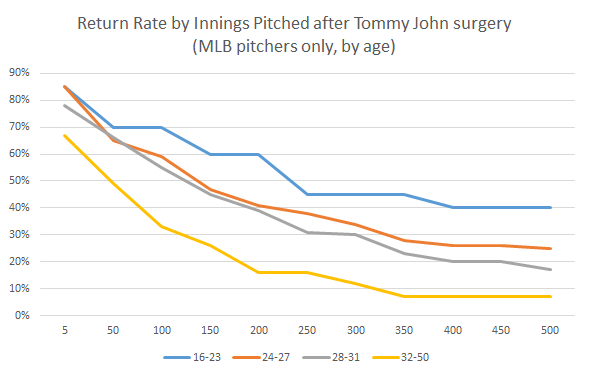
For these two graphs, I used only the 195 Tommy John surgeries performed on major league pitchers between 1974 and 2009, since the data from this period are basically known at this point. The images show the expected relationship between age and post-surgery game participation, with pitchers typically appearing in fewer games and accumulating fewer innings pitched the older they are at the time of surgery.
Let’s also look at the median results by age grouping:
| Post Tommy John Surgery Medians by Age Groups, 1974-2009 surgeries |
|---|
| Age at Tommy John surgery | Appearances (G) | Innings Pitched (IP) |
| 16-23 | 93 | 221 |
| 24-27 | 70 | 137 |
| 28-31 | 74 | 130 |
| 32-50 | 29 | 46 |
Again, we see that younger pitches contribute for longer, but these are still modest figures.
One final way we can break down return rates is by the number of months it took for the pitcher to return to major league action fom the time of his Tommy John surgery. This topic was of particular interest in the case of Matt Harvey; it was reported that Mets GM Sandy Anderson believed 11 months was an appropriate recovery time from Tommy John surgery, while Scott Boras trumpeted doctors’ recommendation of 14-16 months.
The following graphs use the same sample of 195 surgeries from 1974-1999, although they select only those pitchers who did return to major league action and for whom their surgery date is known specifically enough to calculate their return time accurately. This leaves 141 pitchers in the sample. Note that the numbers and percentages will be higher now, since by definition we are excluding those pitchers who never returned to the majors after their surgery.

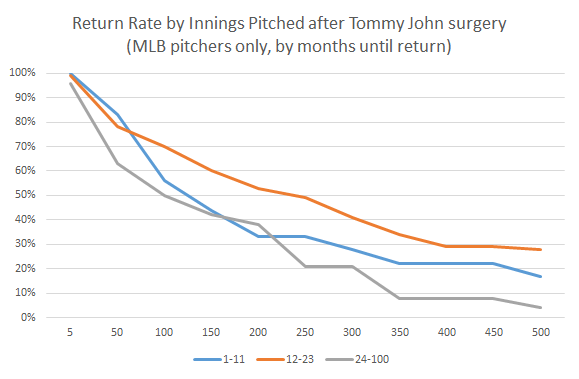
Below is one final table showing the median appearances and innings pitched by return time range. I have increased the resolution here as much as possible and cited the number of pitchers included in each grouping.
| Post Tommy John Surgery Medians by Return Time to Majors, 1974-2009 surgeries |
|---|
| Return, Months after surgery | Appearances (G) | Innings Pitched (IP) | # of Pitchers |
| 1-11 | 87 | 106 | 18 |
| 12 | 124 | 155 | 22 |
| 13 | 128 | 179 | 19 |
| 14-16 | 129 | 239 | 20 |
| 17-20 | 102 | 254 | 21 |
| 21-24 | 122 | 195 | 18 |
| 25-100 | 49 | 104 | 23 |
The data here certainly appear to favor Boras’ more conservative 14-16 month time line over Alderson’s 11-month schedule. In both appearances and innings pitched metrics, return times of fewer than 12 months as well as times of over two years both have proven to be far less successful. Perhaps this suggests there is such a thing as returning too soon. On the long end, slower returns mean wasted time and may also indicate rehabilitation issues that might affect performance.
When assessing by the number of games entered post-surgery, the 12-16 month recovery window has shown to produce the best results. By considering post-surgery innings pitched, history has shown that pitchers returning after a slightly longer span, in the 14-20 month range, have out-pitched those returning slightly more quickly or further removed from the procedure.
When we think about pitchers who have recovered from Tommy John surgery, our minds tend to lock onto the successful ones. Tommy John himself. A.J. Burnett. Adam Wainwright. Jordan Zimmermann.
What is critical to understand is that one out of every five major pitchers who undergoes the operation never throws another pitch at that level. These are less familiar names, given their career-ending injuries. Ambiorix Burgos. Anthony Reyes. Macay McBride. Bill Simas.
The most recent data suggest that one out of two major league pitchers who has Tommy John surgery will throw fewer than 100 innings the rest of his big league career. Bill Bray. B.J. Ryan. Taylor Buchholz. Victor Zambrano.
Let this study be yet another combatant against the way of thinking shared by an incredible number of amateur players, parents and coaches who believe elective Tommy John surgeries are a good idea to improve performance and throw harder<. This injury is no joke, and successful recovery from this surgery is no guarantee.
References & Resources
- Jon Roegele, Tommy John Surgery List
- Anthony A. Romeo, MD, Midwest Orthopaedics at Rush, Rush University Medical Center, The American Journal of Sports Medicine, “Rate of Return to Pitching and Performance After Tommy John Surgery in Major League Baseball Pitchers”
- Christopher S. Ahmad, MD, Columbia University Medical Center, The American Journal of Sports Medicine, “Performance, Return to Competition, and Reinjury After Tommy John Surgery in Major League Baseball Pitchers”
- Jimmy J. Jiang, MD, Department of Orthopaedic Surgery, University of Chicago Medical Center, The American Journal of Sports Medicine, “Analysis of Pitching Velocity in Major League Baseball Players Before and After Ulnar Collateral Ligament Reconstruction”
- Mike Vorkunov, NJ.com, “Scott Boras, Matt Harvey’s agent, preaches conservative approach in return from Tommy John surgery”
- American Sports Medicine Institute, “Position Statement for Tommy John Injuries in Baseball Pitchers”
Wow! The numbers do not lie. While its great to see and hear of the pitchers who succeed and come back and pitch meaningful innings as a Major League Starting Pitcher, the data shows most individuals will have a long term reduction in arm stamina and strength. Leading to reduced roles and, or, a reduction in efficiency. That chances are a pitcher may never return to his former self with the election of surgery. And those who attempt to rehab an injury are only delaying the inevitable? Is there data on those individuals who attempt that route? Very good, but sobering article. Even with medical advances today in surgical procedures and rehab techniques. The message seems to be, as a fan of your teams player, or even a organizational view, may be, don’t get your hopes up.
I would tend to believe that most players caught in this situation, although very determined, given the nature of reaching the pinnacle of even being considered a Major League player, face an uphill battle in a successful return to the highest level of pitching efficiency.
The numbers don’t lie accepting for by omission. I don’t think they tell the whole story here. I’m not sure how to do it better, but this study doesn’t accurately filter out bad pitchers. How many of these TJ survivors would have pitched more than 60 innings regardless? Young pitchers already have a high failure rate – perhaps we should be looking at the difference in the failure rate between young TJ survivors and young pitchers in general. I
Yes, I agree that some of these pitchers may have fallen out of the league quickly anyway. We don’t really have any way of knowing as every case is different. All we know is before the surgery these pitchers were pitching well enough to hold an MLB roster spot.
Really the point I wanted to make here is that only about 80% return, and the rate is lower if we look beyond just returning to MLB, but being able to be injury-free enough when you do return, and to perform at a level high enough to remain employed as a pitcher at the playing level you were at before the surgery.
Just do a control group with all pitchers of that age and put it next to all the graphs.
Right. Any how many healthy pitchers ever pitch in the majors again after T+12 months? Is it a lot more than 80%? That’s the question that will determine whether TJ surgery actually is a huge factor or not.
Really, really interesting stuff. One thing I’d like to see is the appearances/IP numbers broken down into relievers and starters. I know that might be difficult to do with complete cleanliness, since lots of players straddle the line, but a successful recovery, when measured in IP or appearances, means totally different things to a reliever versus a starter. I guess that, since starters will have lower appearances and relievers higher innings, this still provides an accurate aggregate measure, but I think splitting it would be ideal. Still, this is really important research to have out. Thanks!
Along those same lines, I think it would be informative here to show pre- and post-operative innings/appearances by era.
Part of this seeming decline may simply be due to the fact that teams once saw a young pitcher struggle due to possible injury, so they cut him loose and moved onto the next guy. These days, teams may be more willing to invest in the pitchers where the benefit is less certain.
In other words, teams may be lowering the average by being less selective — by increasing the number of failed procedures in hopes of finding a few more successes.
I’d wager the percentage of surgeries performed on pitchers with an ERA+ > 100 has gone down over time.
I like this as far as it goes, but it is slightly pessimistic. Some of the pitchers in this sample are likely marginal major league players even prior to surgery. The question is, what is the chance they would have been in the league 16 months later in any case. I guess the best you could to is pair them with another pitcher who had a similar profile and compare their innings pitched two year later and beyond. That should take care of the starter/reliever bias as well. After all, were we expecting big things from Burgos even without the surgery?
Another facet I’d be curious to see: How much of the decline in appearances/innings after TJ surgery can be attributed to an abundance of MLB-ready talent waiting in the wings? (Non-baseball example: Drew Bledsoe replaced by Tom Brady.)
With the “easy does it” pitching culture that has evolved lately, it certainly feels like MLB coaches ease a returning player back into the fold while relying more heavily on those who have been getting the job done in his absence. And of course, once someone is getting the job done, it’s more difficult for someone returning from injury to reinsert himself, especially if he wasn’t a perennial All-Star or potential Hall of Famer.
This is just conjecture, of course. I haven’t run those numbers, and the effect may be insignificant. It just struck me as I was reading.
I like this as far as it goes, but I think the overall picture tends to be too pessimistic about the success of the surgery. The problem is that some of the sample were likely marginal players to begin with. They may have been out of the league in any case. I guess the best you could do is pair them with someone who has similar per-surgery stats, and then compare the innings pitched two years out and beyond. That should eliminate the starter/reliever bias as well. After all, were we really expecting big things from Burgos even prior to TJ?
Interesting, interesting stuff. Losing a pitcher for a season to Tommy John surgery is bad enough, but to think that it could have such an effect on the pitcher’s career. Many, myself included, make the mistake of assuming, once the player is back on the field, they’ll be 100% the player they were before. Thanks for helping enlighten me a little.
Having said that, it would seem the best course of action is to prevent the need for Tommy John surgery at all. That is, there has to be a way to prevent pitchers from tearing their UCLs to minimize the risk of needing Tommy John. Have their been studies done which compare pitchers who’ve had the surgery to contemporary pitchers who have not had the surgery?
Excellent article. The most interesting part for me with the time of return to previous levels and their eventual number of innings pitched. 14-16 month returns had the higher innings. There are success stories of pitchers returning in 12 months or even early but over a larger samples size the 14 month return for professional pitchers makes the most sense. This is critical for front offices to make plans for upcoming years. If you think overall TJ surgery is 90+% successful and they return in 12 months, you may be left short a starter or reliever when they can’t return to a reasonable performance level by April. This sure seemed to be the philosophy in 2014 when a large number of pitchers underwent the surgery in March and April while the average over the previous 15 seasons showed June to be the highest number of surgeries performed. Many of these injuries occurred in spring training but were not operated on until June. This may be because they failed conservative treatment. (Conservative treatment is another interesting topic. See Podesta’s article in AJSM). The other big issue that needs to be addressed is the huge number of 2nd TJ surgeries (revisions) done from 2012-2014 with 11 occurring in 2014 and the possible reasons for that number.
Much to talk about in this subject but an excellent study and discussion. Thanks for doing the research.
I do wonder if the skill of the pitcher prior to TJ surgery has an affect on the success rate.
The line between a low end pitcher and a tripe AAA pitcher is razor thin. If a low end pitcher has TJ surgery, it might be enough to push him out of the MLB. One would assume that most better pitchers will be able to better handle the loss of stuff.
A lot of people seem to want to parse this article one way or another. But it certainly makes the case that TJ surgery, like all surgery, shouldn’t be entered into lightly and is best considered an option of last resort. Thanks for the work Jon. A great read and an important message.
I would be curious to know if the averages you have here in terms of innings and games after TJ surgery are polarized averages? In other words, many players that when they do come back pitch very very little or don’t come back at all, mixed in with many of those that pitch for many years afterwords. I would think Stephen Strasburg would be an outlier on the positive side at this point, or close to it.
Thanks for the question. What are listed here are medians, not averages. I wanted to avoid having large outliers skew the average, and I thought a useful question to answer would be “if an MLB pitcher is about to undergo Tommy John surgery, what sort of career could we expect from him afterwards?” The numbers I’ve published mean 50% of MLB pitchers appear in less G/throw less IP after TJ surgery, and 50% appear in more G/throw more IP after TJ surgery.
I think the timing of the TJ surgery has a lot to do with the recovery time. A surgery that happens very early in the season might result in the player only missing that season. They might be ready to go at the start of the next one (Alderson’s 11 months). But if the surgery happens late in the season, there might not be enough time in the following season for the player to recover and so the team and player decide it is safer not to try. This would be Boras’ 14-16 months.
The general narrative is that it really takes two years to fully recover (or recover as far as possible). Players can start contributing 11 months or so after the procedure but when the procedure happens will play a large role in whether the contribution happens 11 months or 17 months later. Naturally, the players who take the 17 months will be further along.
Thanks for the question. The numbers posted here are medians, not averages. I wanted to avoid large outliers skewing the average. So basically I calculated numbers such that 50% of MLB pitchers appear in fewer G/throw fewer IP after TJ surgery, while 50% of MLB pitchers appear in more G/throw more IP after TJ surgery.
I agree that the article does a good job of promoting the idea that TJ surgery is not “automatic.” However, to help clarify the issue, we really need some data for the alternative strategy: resting a partially torn UCL. Anecdotally, my sense is that rest almost never works (e.g. Cliff Lee). But we all know how misleading anecdotal “evidence” can be.
If I were a pitcher with the choice of surgery or rest/rehab, I’d like to see the data from both sides.
terrific data and written article, thanks. I’m happy to see the return from TJ surgery success is pretty decent in general.
As others have commented, the one thing that’s missing here is a control group.
At any random point, how many more appearances/innings did the average (non-TJ) pitcher have left in his career? How many of those occur more than 12-18 months into the future (i.e. after a TJ rehab, which is what’s relevant when we’re looking at long-term effects rather than just the surgery recovery time)?
Notably, all three studies you cited actually found that TJ survivors (those who made it back to the majors) pitched at least as well as non-TJ victims:
#1: “When compared with demographic-matched controls, patients who underwent UCL reconstruction had better results in multiple performance measures.”
#2: ” Finally, performance declined across several metrics after surgery compared with preinjury levels […]. However, these declines were not statistically different from similar declines found in age-matched controls who did not undergo Tommy John surgery.”
#3: “There were no significant differences in pitch velocity and common performance measurements between players who returned to MLB after UCL reconstruction and pair-matched controls.”
What is the median career length or IP (or G). I suspect its pretty low and UCL injuries affect both elite and non-elite pitchers. Those non-elite pitchers might find TJS career limiting or ending (at least at MLB level)
I think the reason for the apparent decline in success is pitchers are being rushed back after being injured. TJ surgery is not all about surgical technique or rehab. A tendon is quite a different animal than a ligament, having more strength but less elasticity. Over time, when used as a ligament, a time dependent process called ligamentization occurs where the tendon changes its properties to be more like that of a ligament. While proper rehab helps, it can not accelerate the process beyond a certain point. Coming back too early can cause problems with the immature UCL.
Better stay with 14 months-16, 12-14 months may be pushing the envelope too much and while there will still be some successes, there will be more failures
My poster Murphdogg replied again “John Smoltz wasn’t in the minors in 2000. Nor were Scott Aldred or Kevin Ritz in ’93.”
Tommy John is taking over baseball
How carefully was this data checked? According to the spreadsheet that is referenced in the article, Erik Bedard pitched no innings in the majors after his 2002 TJ surgery. In fact, he pitched 1,303 innings. That was just one random guy I happened to notice.
One of my posters, Murphdogg said this –
“Yeah, that chart is seriously messed up. Just glancing through I found several players who had the surgery before reaching the Majors and none of them were credited with any post-surgery MLB innings. Darren Oliver, Billy Koch, Jay Payton, and Eric Gagne, Jarrod Parker, among dozens of others never reached the Majors according to the chart. There are also other players who had it during their MLB careers who are also not listed as having returned. Scott Aldred is one, as is the aforementioned Bedard.”
I would like to respond. Can you assist?
My Poste srock commented this –
“78% is a meaningless figure without something to compare to. At first glance I actually think 78% of pretty high because my perception is the rate of return without surgery is likely approaching 0%.
I wonder if anyone knows the rate of return for pitchers who opt not to have surgery after the doctors recommend it. Is the sample size on this even meaningful? Pretty much every pitcher I can recall going down with this injury gets the surgery.”
Do we have a good response?
My esteemed poster Frobby added these comments.
“This comment got me to thinking: what is the median number of innings a pitcher throws in a year? For 2014, the answer was 46.
Having considered the additional mistakes MurphDogg identified, and the fact that the author didn’t really provide any context for how many IP would be considered “normal” when presenting his data, I reluctantly conclude that the article isn’t very reliable. There’s a big distinction between a guy who had a cup of coffee in the majors, had TJ surgery later and never pitched in the majors again, and an established major league pitcher who has TJ surgery.
And just to give a little more context here, I had a look at the list of all pitchers who debuted in 1996 (who I figured would all be retired by now). The median number of innings they threw in their careers was 105.”
Is any of this valid or helpful?
I also think the article should provide some context about the median number of appearances or innings thrown by pitchers who didn’t have TJ surgery. In 2014, the median pitcher who appeared in the majors threw 46 innings for the season. In 1996 (a year I picked because I assumed everyone would be retired by now), the median career IP for all pitchers who debuted that year was 105.
Thanks for the comments. To respond to several of the most recent ones regarding pitchers not included in the study/graphs, it is because I only included pitchers who were pitching in MLB at the time of their surgery in the study. Those are all pitchers with a “Y” in the Majors column in the database. I listed “MLB pitchers only” in every graph to try to make that point clear.
Erik Bedard for example had some MLB experience prior to his injury, but was last pitching in MiLB before undergoing Tommy John surgery in September.
This sample set was chosen so that it was fair, or consistent,l at least, to expect a pitcher to return to MLB following the surgery, since he was pitching at that level in the last game before his injury.
Certainly many pitchers had TJ surgery in the minors before making MLB. They could be included in another study.
All this said, data collection of this nature is very time consuming and manual, so I would not expect the database is completely error-free. Please let me know if you see any errors. Thanks.
Your spreadsheet states that only 59% of all pitchers from 2012 to 2013 have recovered.
But when I manually look at all pitchers from 2012 to 2013, I see that 74% have recovered (and that omits starters like Matt Harvey while adding relievers like George Sherill). I can’t figure out why this was the case. I had thought that this field included all pitchers from 2012 to 2015 but then the figures would be lower.
Given that this is a clear outlier would it be possible for you to check to make sure there isn’t an error there?
I just checked 2012-2013 surgeries. Remember, the 59% is for MLB surgeries only, of which there are 54, as it says in the spreadsheet. Also, note that the spreadsheet is counting all Tommy John surgeries for all players (including non-pitchers), whereas the study conducted in this article is for pitchers only. Of all players who I have marked as MLB (a “Y” in the Majors column) who had Tommy John surgery in 2012 or 2013, 32 have made it back to MLB. Returned in the spreadsheet means to the same level, so an MLB pitcher having returned to MiLB action does not count. 32/54 = 59%. Both Matt Harvey and George Sherill would be included given my criteria and neither have returned to MLB regular season game action yet. They still may, and so during the 2015 regular season that 59% number will climb, as it is a running total, but as of the end of the 2014, it is correct.
My apologies. I simply didn’t read your methodology carefully enough. Given that it takes two years for roughly 40% of pitchers that return from the surgery to actually return I would expect those percentages to increase as well.
In any event, thank you for your time.
Poster MurphDogg again
“John Smoltz wasn’t in the minors in 2000. Nor were Scott Aldred or Kevin Ritz in ’93.”
Really interesting stuff. LOTS of follow-up questions. I’d love to see how it breaks out by team. For instance, what do the different teams look like for TJ surgery rates and then return rates? Are some teams outliers? That could be really difficult to interpret by the way. A team with a high TJ rate, might have typical injury-rates but be more willing to pull the trigger on TJ surgery.
This article is an approach but not detailed enough. As someone pointed out earlier, this article doesn’t take into consideration the failure rate of pitchers regardless of TJ surgery. Perhaps it is better to comparisons of pitchers who have already had 500, 1000 or 1500 innings pitched in the majors before the surgery.
Out of curiosity, what are the median future performances of any pitcher who threw a pitch in July of year T performing in year T+1 and beyond (or any other similar comparison that excludes year T cups of coffee)? The TJ medians look horrible, but it’s hard to evaluate them without context, and the overall MLB medians are probably a lot lower than people’s impressions since nobody remembers all the nameless back end guys falling out quickly.