Using Recurrent Neural Networks to Predict Player Performance

The future might not be far away. (via Trollan Magician, Doug Kerr, Keith Allison & Michelle Jay)
Editor’s Note: This article initially was a presentation at the marvelous 2017 Saberseminar.
The year is 3047. Advancements in technology allow Buck Showalter to unplug a USB drive from a port behind his left ear and transfer it to an iPad. They don’t call them iPads anymore, but there’s no need to be bombarded with a bunch of unnecessary jargon right now. If that’s what you came here for, sit tight. As you may have guessed, USB connections to the brain are not the only medical technological advancements, since Buck Showalter is still alive in 3047.
The iPad loads a color-coded multi-layer map with connections running across each layer and between the layers. Data from the flash drive load into one end of the map causing nodes and connections to light up as each new data entry travels deterministically across the layers. After a few seconds of rainbow-colored flashing, a recommendation appears: Manny Machado is likely to go into a hitting slump over the next couple of weeks. Rest is advised as a preventative measure.
Buck thought it over. Over the past couple of weeks, Manny’s outcomes at the plate had not been favorable. Outcomes were what the system used to make recommendations, but outcomes tell you only what happened, not how it happened. Manny looked fine at the plate. He wasn’t swinging at bad pitches, his timing didn’t appear affected, he was spraying the ball to all sides, he had no notable injuries. Buck could see why the system recommended rest, but there was nothing to suggest that resting Manny would improve his outcomes or prevent the slump.
…
What if, at some point in the future, we could tell an algorithm what a player did in a baseball game, or several baseball games, or all of the baseball games, and it would process that information, then tell us what the player would do in the next game, or the next several games, or for the rest of his career? Sounds like some fancy 3047 sci-fi voodoo, right? Maybe not.
Before you start imagining a baseball version of a K-2SO droid that sits next to the manager on the bench and snarkily spews statistical probabilities void of explanation or context, let’s consider the advantages and limitations of such a system. Short-term predictions could be used to optimize pitcher/hitter matchups on a game-to-game basis, or predict slumps and recommend rest days as discussed above. Long-term predictions could be used to gauge free agent contract valuations, or construct a balanced roster of power hitters and high OBP. But as with any all-numbers approach to projections, limitations exist. Outcomes describe what happened, but not how it happened. That said, high accuracy predictions still have value even if they can’t explain how or why.
High-accuracy predictions still seem like a futuristic pipe dream. That’s where neural networks come in. Neural networks are a brand of machine learning used for pattern recognition, classification and prediction tasks. They are called neural networks because they are modeled after the manner in which the human brain processes information. First, the network is trained by feeding it data from which it can learn how to process and interpret future data.
The network is composed of interconnected neurons, or maps, which are also referred to as layers. Inputs and outputs are passed between the layers. Weights within the layers determine how the inputs are processed and used to determine the output. The weights are updated throughout the training process to reflect what the network has learned.
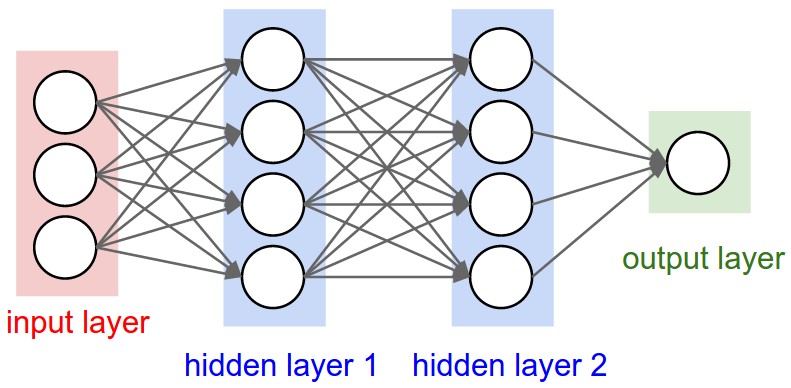
Both the data and weights are formatted into matrices. Each node on the input’s journey across the map reads and processes the input. To avoid having to tag this post with a *gory math* trigger warning, it will suffice to say, the processing consists of a series of matrix multiplications and derivatives, the outcomes of which determine the updates to the weight matrices and which node on the map the data will be sent to next. Because of the neural network’s layered model of connections, which is more complicated and nuanced than traditional statistical regression models, it has the potential to pick up on more of the subtle and varied lurking human factors that traditional models miss. Neural networks will still not be able to identify or label these factors, but if it can factor them into predictions in its “subconscious” way, that’s meaningful progress. A simplified visual depiction of how neural networks are structured is shown below.

Neural networks can be further customized based on the specific task. For example, recurrent neural networks are generally better suited to sequential data, where events do not happen independently of each other, but rather in a specific order, such as language where words are structured into sentences in a specific order based on the part of speech, or as in a baseball season where games happen in order over the course of a season. Recurrent neural networks (RNNs) perform better on sequential data because they include a mechanism for looping over or repeating a layer, or in terms of the human brain, they have a stronger long-term memory, allowing them to recognize longer patterns.
The comparison between a vanilla neural network and an RNN is shown below. Each input is given its own color to indicate its presence in the network. Notice that by the end of processing four inputs, the vanilla network remembers only the previous two, while the RNN can still remember all four.

Vanilla Neural Network:

Recurrent Neural Network:

The following graphic demonstrates a simple RNN processing four inputs.

A RNN provides one useful customization, but we can do better, if we want our baseball expert, K2SO droid, to actually be useful, rather than just a source of snark. For data prone to noise and anomalies (most data, if we’re being honest), a Long Short Term Memory network (LSTM), preserves the long term memory capabilities of the RNN, while filtering out irrelevant data points that are not part of the pattern. Mechanically speaking, the LSTM adds an extra operation to nodes on the map, the outcome of which determines whether the data point will be remembered as part of a potential pattern, used to update the weight matrix, or forgotten and cast aside as noise.
With a network customized to the task at hand, the next consideration is what data to pass through the network and how it should be formatted. The possibilities are endless given the volume and types of data available, so to begin testing, the most basic data and formatting were chosen. To focus on a single player’s patterns and performance, game log data for the player’s career to date were used to train the map, with one season’s worth of games held out for verification and accuracy testing.
The data were broken into the most basic units, with one game used per event or data point. A separate map was trained for each of the following counting stats: PA, AB, R, H, 2B, 3B, HR, RBI, BB, IBB, Ks, HBP, SH, SF, ROE, GDP, SB, CS. For example, to train the HR network, the first input to the network is the number of homers the player hit in his first game, the second input to the network is the number the player hit in his second game and so on. Once trained, the networks can be used to predict the numbers posted in each category by the player in subsequent games.
With a network to train and data to train it with, we can now look at a test case where the network attempted to learn Manny Machado’s performance patterns and then made some predictions. Machado was chosen as the initial test case, since his career has not followed a standard linear progression, but rather has been interrupted by two knee surgeries, and also showcases spurts where certain measures, such as doubles and stolen bases, have arced while others, such as home runs, have dipped, only to oscillate not long after. Such a career is not as conducive for traditional statistical regression models, which are more limited by the many, varied human factors.
The first test trained the neural map using the first four years of his career and then predicted his 2016 season, looking only one game into the future at a time, meaning the map benefited from all real data up to the game in question. The graphs below show the predictions compared to the real data. The blue lines model the numbers actually posted by Machado. The green lines show predictions using the same data used to train the map (note, we don’t want the blue and green lines to match up exactly because that would mean the map had simply memorized the training data). The orange lines show the predictions made based on new input data that the map did not see during the training process.


Though the output is not shown for all statistical categories, those selected provide a representative look that demonstrates the strengths and weaknesses of the model as currently configured. Of note is that the model seems unwilling to predict the extreme values for any category. To maximize overall accuracy, the model sticks close to the averages. The model also struggles significantly with sparse data, such as stolen bases, home runs, etc., which are far more likely to not happen in a given game; therefore, the model plays it safe and predicts all zeroes.
The next test for the model is predicting further than one game into the future. In this experiment, the first future game is predicted, then that prediction is tacked onto the end of the real data and fed to the model to generate the next game’s prediction. The obvious concern here is a loss of accuracy as time progresses. The graph below shows the aggregation of a full season’s predictions in each category.

Again, the model is very stingy with the sparse categories, though there are a few exceptions, such as triples, intentional walks, hit-by-pitch, and caught stealing (maybe Machado saw this prediction somehow and that’s why he stopped stealing in 2016). Clearly, there is significant room for improvement in both the short-term and long-term predictions. Since neural networks provide a highly nuanced and customizable model there are several ways to go about building on this baseline.
The first area for modifications is the data. For these experiments the data were fed into the model one game at a time, as categorical data, meaning numbers posted in each game were treated as category labels, which forced the model to choose a whole number for each prediction. Had the numbers been treated as actual numbers, the calculations done at each node would have output decimal values, which could then be rounded at the end, possibly allowing the model to occasionally predict some of the more extreme values that it shied away from during initial testing.
Additionally, the data do not have to be fed in one game at a time, but could be grouped by weeks, months, or even full seasons, depending on the amount of data available and the focus of the specific prediction. Grouping the data into a larger time window would eliminate some of the existing issues with sparse data. Normalizing the data or applying other standard transformations could also provide a potential fix for the sparseness issue.
Additionally, there are several parameters within the network that could be adjusted to improve performance. The inputs are passed through functions at each node that determine the output. Certain functions are used by default that tend to produce the best performance; however, this is a generalization. Since each individual application of neural networks is unique, testing all options is the only true way to know which will work best for tasks within a specific field. Further configuration components to consider are the number of layers in the network, and the number of rounds of training used to teach the network. Both add to the “smartness” of the network, so in both cases, it’s generally true that more is better, though overfitting the network to the data is a risk. Also of note, adding layers and training come with increased computational costs, so to really do the thing right requires some high-end computer hardware, far beyond the mid-level laptop used for this first round of experiments.
Beyond tweaking this specific network for this specific task, the powerful flexibility of RNNs open up several areas for expansion. There exists room to experiment with different types of data, perhaps from the gold mine that is Statcast, or perhaps by letting pitchers join the fun. The smartness of the map could also be improved by exposing it to data from multiple players, including those whose careers have ended, which would allow the model to learn full career arcs and ramp up the long-term predictive power. To prevent muddying the water with too much information from too many disparate sources, one might use a clustering algorithm to group players with similar performance output and then train a network for predicting within that group.
As noted, the accuracy isn’t quite ready to predict every game of every player’s career, but we may not have to wait until 3047 to let human/robot hybrid Buck Showalter decide whether to take the neural network’s advice, and give Machado a couple of days off. Maybe a couple of years from now, Showalter will be checking an iPad prior to a one game, Wild Card play-in, and a neural network will inform him with startling accuracy how his relievers will respond in various high-level situations. Maybe it will tell him exactly when to use Zach Britton, and when not to use Ubaldo Jimenez. But will he listen?
References & Resources
- Baseball-Reference
- Orphin Tanz & Cambran Carter, TechCrunch, “Neural networks made easy”
- iamtrask, iamtrask Github, “Anyone Can Learn To Code an LSTM-RNN in Python (Part 1: RNN)”
- Christopher Olah, colah’s blog, “Understanding LSTM Networks”
- Keras, “Keras: The Python Deep Learning library”
- Jason Brownlee, Machine Learning Mastery, “Time Series Prediction with LSTM Recurrent Neural Networks in Python with Keras”
Great article, but I feel you missed an opportunity by using K-2SO and not C-3PO. After all, he could tell Buck that no matter what Machado does the next day, the odds of the Orioles making the playoffs at this point are 3,720 to 1.
On a more serious note, I’d be interested in seeing a comparison against a couple other players, perhaps some who haven’t had significant injuries, to see if the odd season tallies (for things such as predicting no hits, but over 150 triples) are consistent across the board or just an outlier for a player like Machado. I almost think that a more average player would approach a 0 in every category except plate appearances and at-bats, but that’s just a gut feeling and I’d love to see the actual data.
Isn’t the premise of this approach at odds with the general belief among sabers that there is no such thing as clutch, i.e., that recent past performance provides no insight into future performance? If we look at a player’s stats for a whole season, or better yet, several seasons, we can certainly expect to project with some accuracy how he will perform in a future season. But the fact that he hit exceptionally well in the past week is not supposed to suggest he will continue to hit well in the following week; analytics tell us that the best projection is still that based on the whole preceding season or more. (To be precise, the more recent the data, the more predictive they are supposed to be, but the weighting difference is relatively slight).
Another way of stating this is to say–again, I’m just following what I understand to be the general belief among sabermetricians–that there are no meaningful short term patterns in a batter’s stats. Anything that appears to be a pattern is in reality just the result of random chance, just as six heads in a row doesn’t mean the next flip is more likely to be heads than tails (or for that matter, no more likely to be tails than heads). So if this approach were actually to work, to have some predictive value, it would seem to count as evidence against the prevailing view.
Having said all this, if one is going to try to train neural networks in this manner, wouldn’t it be better to use the “purest” data available, namely, exit velocity and launch angle? Those are the best measures we currently have of a batter’s prowess, whereas hits, 2B, 3B, maybe even HR (let alone parameters like runs and RBI) are for sure the result in large part of chance, and thus I would think would obscure any patterns in performance that might actually exist.