Using Statcast Data to Predict Hits
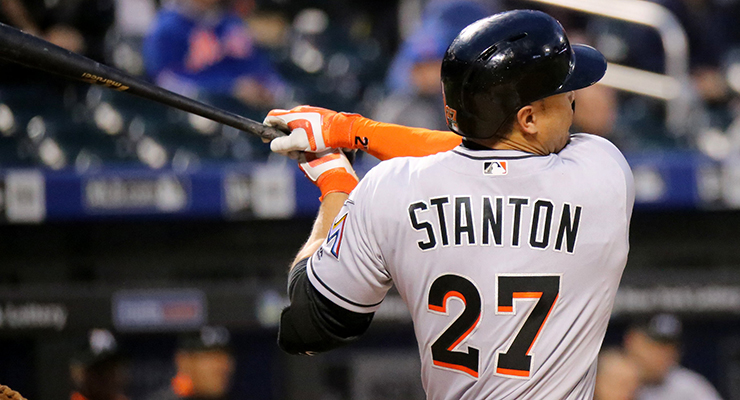
Giancarlo Stanton has the hardest-hit ball, but the launch angle prevented it from being a hit. (via Arturo Pardavila III)
Introduction
Ever since Statcast was announced as a concept I have been waiting to get access to begin examining to what we extent we can build models with the data. We know various teams have been doing similar work with the data available to them for a few years now, but, given how MLBAM essentially made PITCHf/x publicly available, the hope was the general public would similarly have access to the new data generated by the Statcast system.
A little over two months into the season there have been quite a few batted balls that include the three most critical pieces of Statcast information–batted ball distance, launch angle of the ball, and exit velocity. In fact, we have more than 40,000. That seems like a good amount to build and validate at least an initial model of how those three factors determine whether a ball will fall for a hit or be turned into an out.
Although the data are new, some similar work has already been released by a number of researchers.
Alan Nathan has done some amazing work with both HITf/x data and now the Statcast data here at The Hardball Times around what constitutes the optimal swing and contact.
Jonathan Judge, Nick Wheatley-Schaller, and Sean O’Rourke of Baseball Prospectus have examined to what extent there may be park factors that impact the raw readings we see in terms of exit velocity.
Rob Arthur has recently published some work at FiveThirtyEight in which he appears to model expected hitting outcomes based on batted ball launch angle and exit velocity. There is no code, or much in the way of a discussion about the methodology he used, but it appears he took an approach similar to what I’ve done here; namely, using a random forest algorithm to classify batted balls into different outcomes based on elements of Statcast data. Rob was looking at linear weights, while I am starting simply, with whether a batted ball is an out or a hit.
Data and Modeling Methodology
To build the model, I used data acquired from Baseball Savant and its Statcast Search feature. I created a list of MLBAM IDs for all players who put a ball in play in 2016. I then adopted some code shared by Jonah Pemstein to loop through the list of MLBAM IDs and download the available Statcast data in csv format.
The data I pulled included games played through May 28 of this year. That provided me with more than 38,000 records. I then coded each record for whether the batted ball resulted in a hit (1) or an out (0). I also coded which team was fielding and which team’s park the ball was hit in.
I considered a number of variables for the model: launch angle, batted ball speed, overall distance of the hit, the location of the batted ball (i.e. the hc_x and hc_y coordinates of the ball on the field), the handedness of the batter, the fielding team, and the park.
I sampled 15 percent of the data and used that to train my models. Both the training and test sets had similar ratios of hits to non-hits (34 percent hits, 65 percent non-hits) and were similar in terms of the distributions of the features (predictor variables). Additionally, I trained the models and then validated them on different sampling ratios and found that 15 percent appeared to be the lowest required to build the optimal model. This left more out-of-sample data to apply the model to for additional analysis. With random forest models the model is generally fit perfectly to the training data, making applying the model to the training data a futile exercise and will introduce a chunk of over fit data if the training data is mixed in with other data.
Next, continuous variables were transformed using the scale function in R so that each variable had a mean of zero and a standard deviation of one. Transforming continuous variables that are normally on different scales can aid in building a classification or regression model.
Armed with a pre-processed training set, I experimented with a few different versions of the model using the random forest algorithm. Random forests can be used for both classification (hit or out) as well as regression, but in this case I am focusing on classification.
Model Results & Discussion
I experimented with a number of different models tuned in different ways.
- Model 1 included all the variables mentioned above.
- Model 2 excluded park, batter handedness and the fielding team.
- Model 3 included only batted ball distance, speed off the bat and launch angle.
- Model 4 included only batted ball distance.
- Model 5 included launch angle, speed off the bat, park, batter handedness and the fielding team.
The results of the five models are compared below. The data reflect each model’s performance when applied to the holdout or test data–data not used to build the model:

| Performance Metrics | Model 1 | Model 2 | Model 3 | Model 4 | Model 5 |
| Sensitivity (Recall) | 85.80% | 83.70% | 73.90% | 52.30% | 68.90% |
| Precision | 85.80% | 90.50% | 84.20% | 54.90% | 66.70% |
| Specificity | 92.20% | 95.20% | 92.30% | 76.20% | 81.00% |
| Overall Accuracy | 89.90% | 91.10% | 85.70% | 67.70% | 76.70% |
| F1 Measure | 0.858 | 0.87 | 0.787 | 0.536 | 0.678 |
I’ve used five performance metrics to judge the models.
First, the sensitivity or recall of the model. This simply is how well the model is able to identify true positives (True Positives / (True Positives + False Negatives).
Second, the precision of the model, which is related to how accurate the model is when it predicts a positive result (True Positives / (True Positives + False Positives).
Third, specificity refers to how well the model classifies negative cases (True Negatives / (True Negatives + False Positives)).
Fourth, the overall accuracy of the model, which is simply the percentage of accurate classifications it makes ((True Positives + True Negatives) / All Cases).
Finally, the F1 Score (or, simply, F score), which provides a measure of how well the model balances its precision and recall (2*((Precision*Recall)/(Precision+Recall)).
The first and second models are the best performing when we consider all the metrics together. Model 3 does have strong overall accuracy, but its F1 Measure is lower than Model 1. However, if we think about what we are including in those three models it becomes clear those models are “cheating” compared to Model 5. Why? Because those models include information about where the ball was hit that is based on the end of the play.
The batted ball location provided in the Statcast data tells us where the ball was touched by a fielder. But what we are more interested in is the general direction of the batted ball, especially for ground balls. Think about ground balls that get through the infield for a hit. They appear to travel farther and end up with a different hit location than similarly struck balls that happen to be stopped by an infielder. What would be better is simply the horizontal angle of the batted ball. Using the actual distance measure potentially introduces similar bias into the model.
For this reason, I have used Model 5 as the go-forward model for classifying hits. Model 5 makes full use of launch angle and speed off the bat, as well as controls for batter handedness, the park the ball was hit in and the fielding team.
Each of the models does a better job predicting outs than hits, and Model 5 is no different. We can see the difference by plotting the correct classifications in orange and the incorrect classifications in blue, and comparing actual hits and outs side by side:
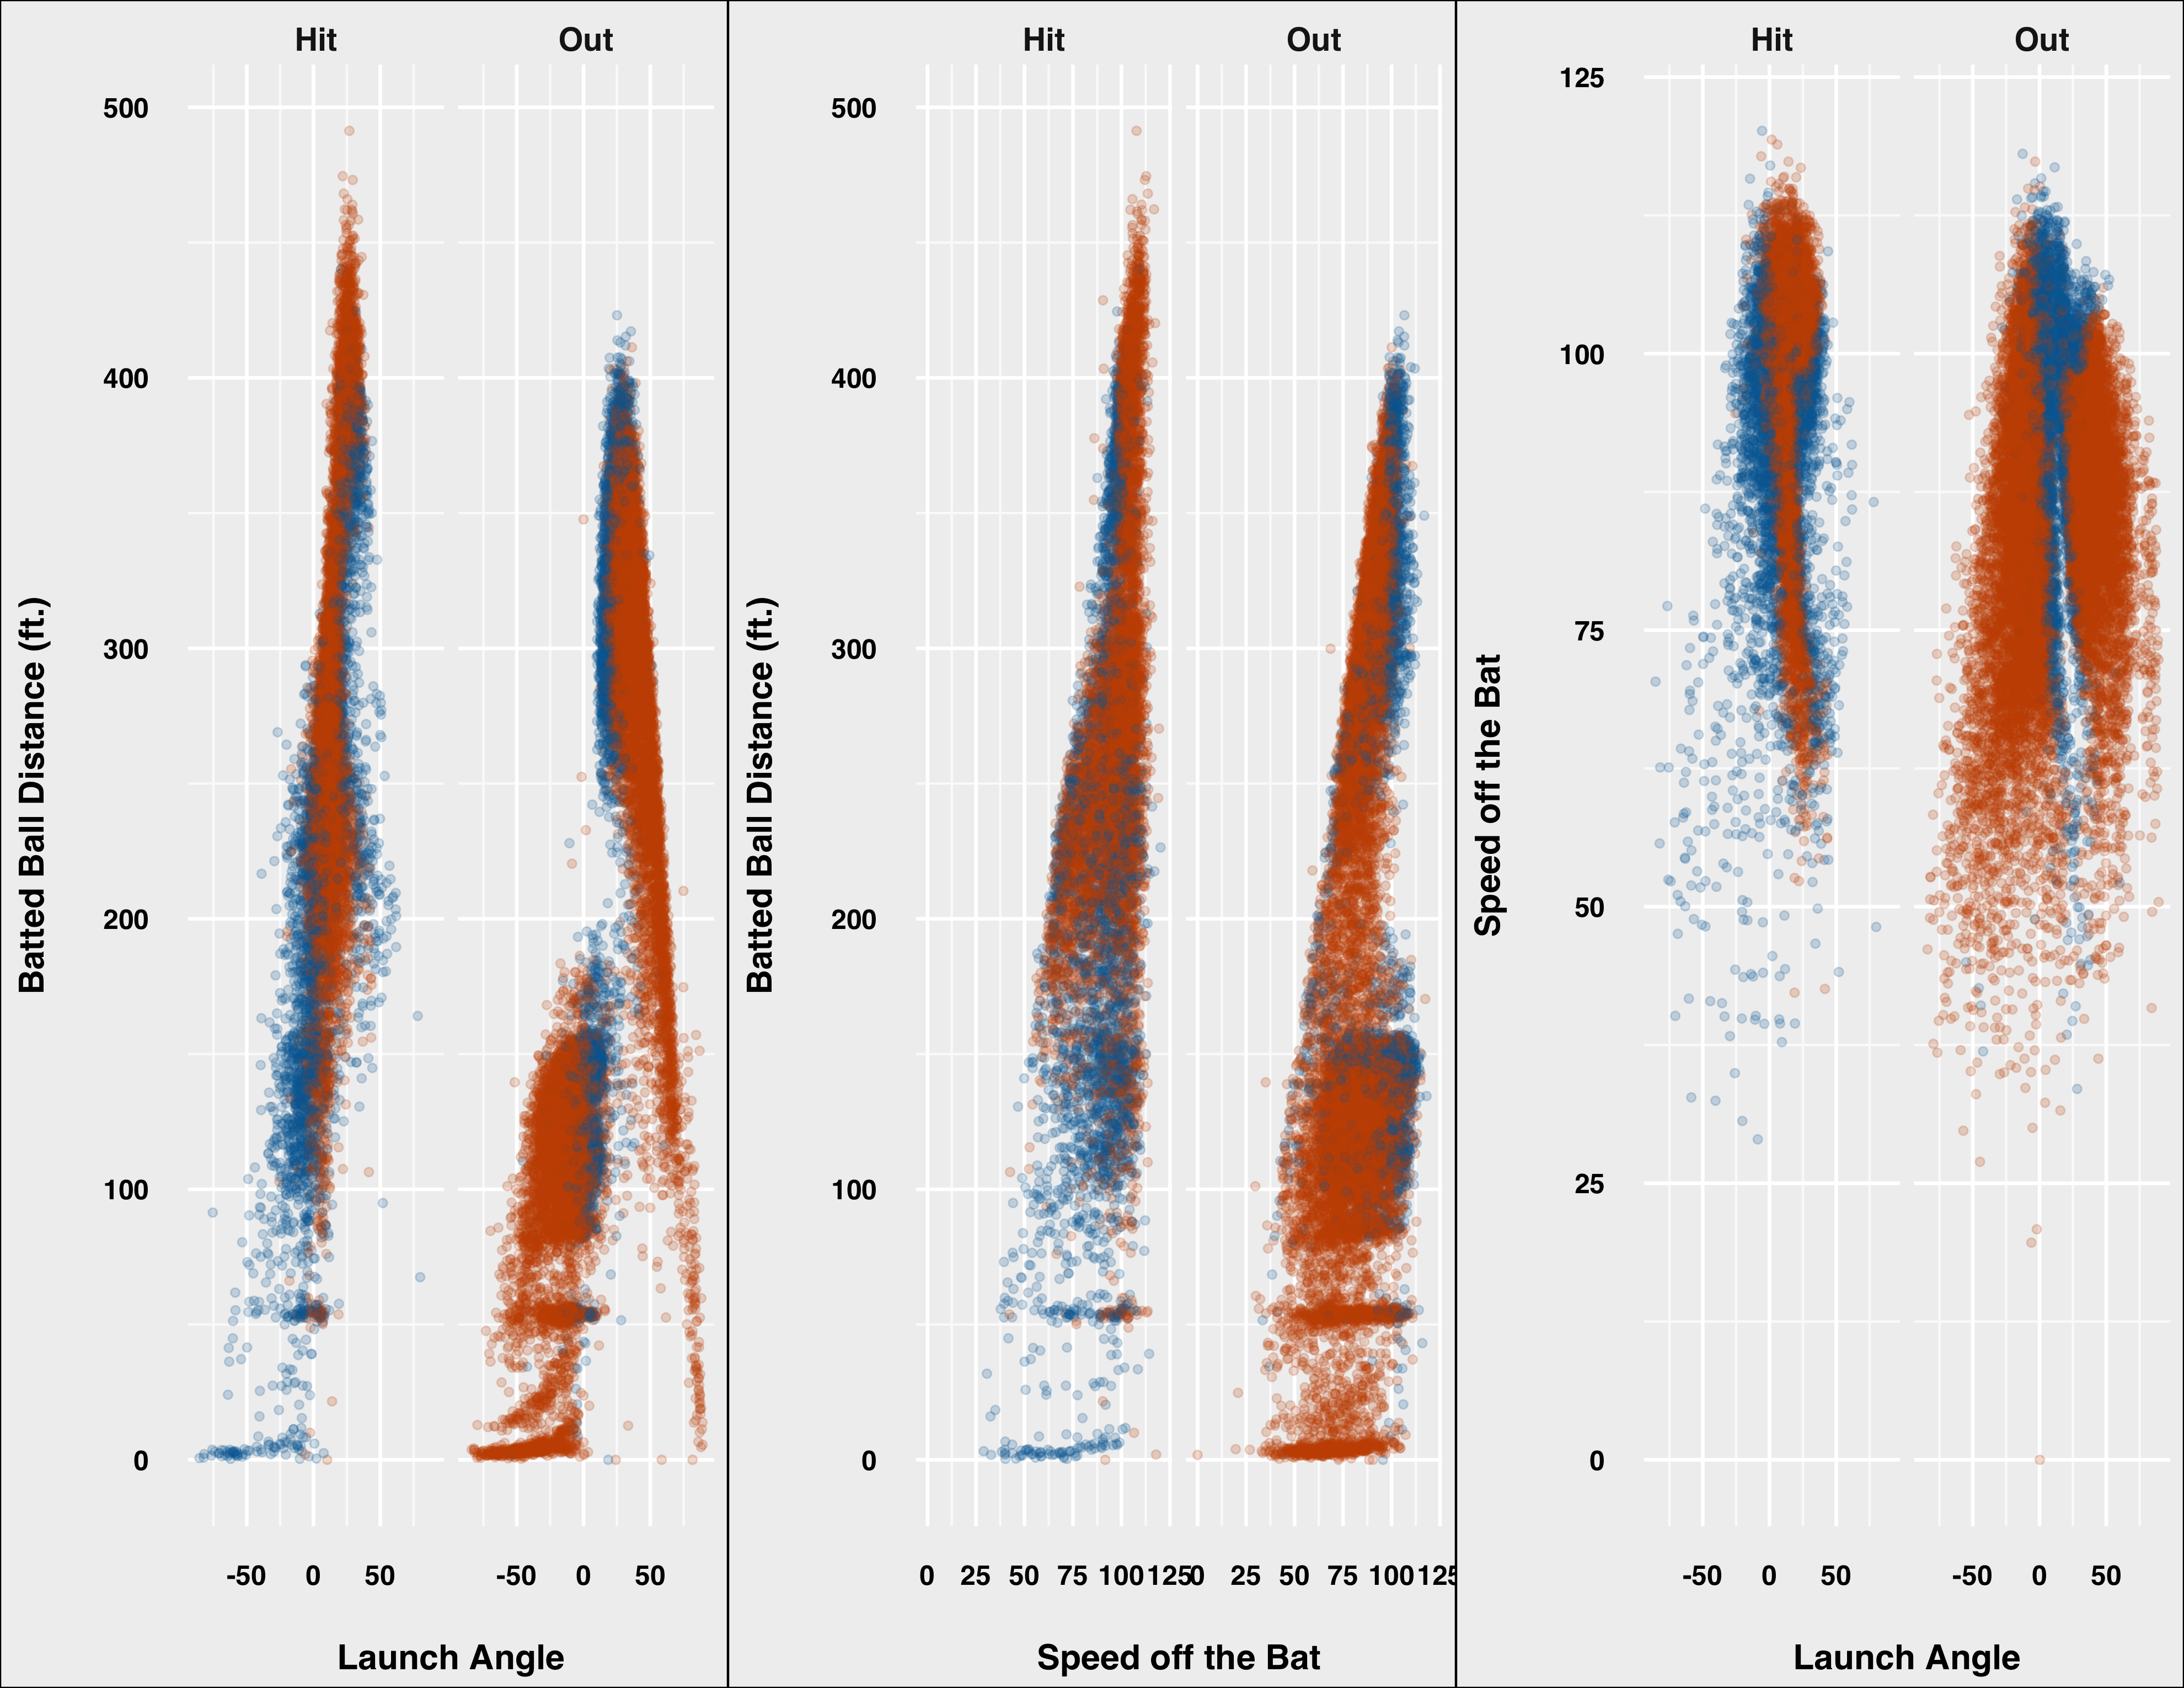
We can see that for outs it is much tougher to make out the blue incorrect classifications, whereas we can see more incorrect classifications when it comes to hits. In either case, the accuracy is extremely high for both hits and outs.
Random forests classify by calculating the probability that an observation belongs to each class (here, hits or outs) and then classifies an outcome based on the class for which it has the highest probability of belonging to. We can take the raw probabilities from the model when applied to the out of sample test set and graph the predicted probability of a hit depending on different combinations of the new Statcast data–namely, distance, speed and angle.
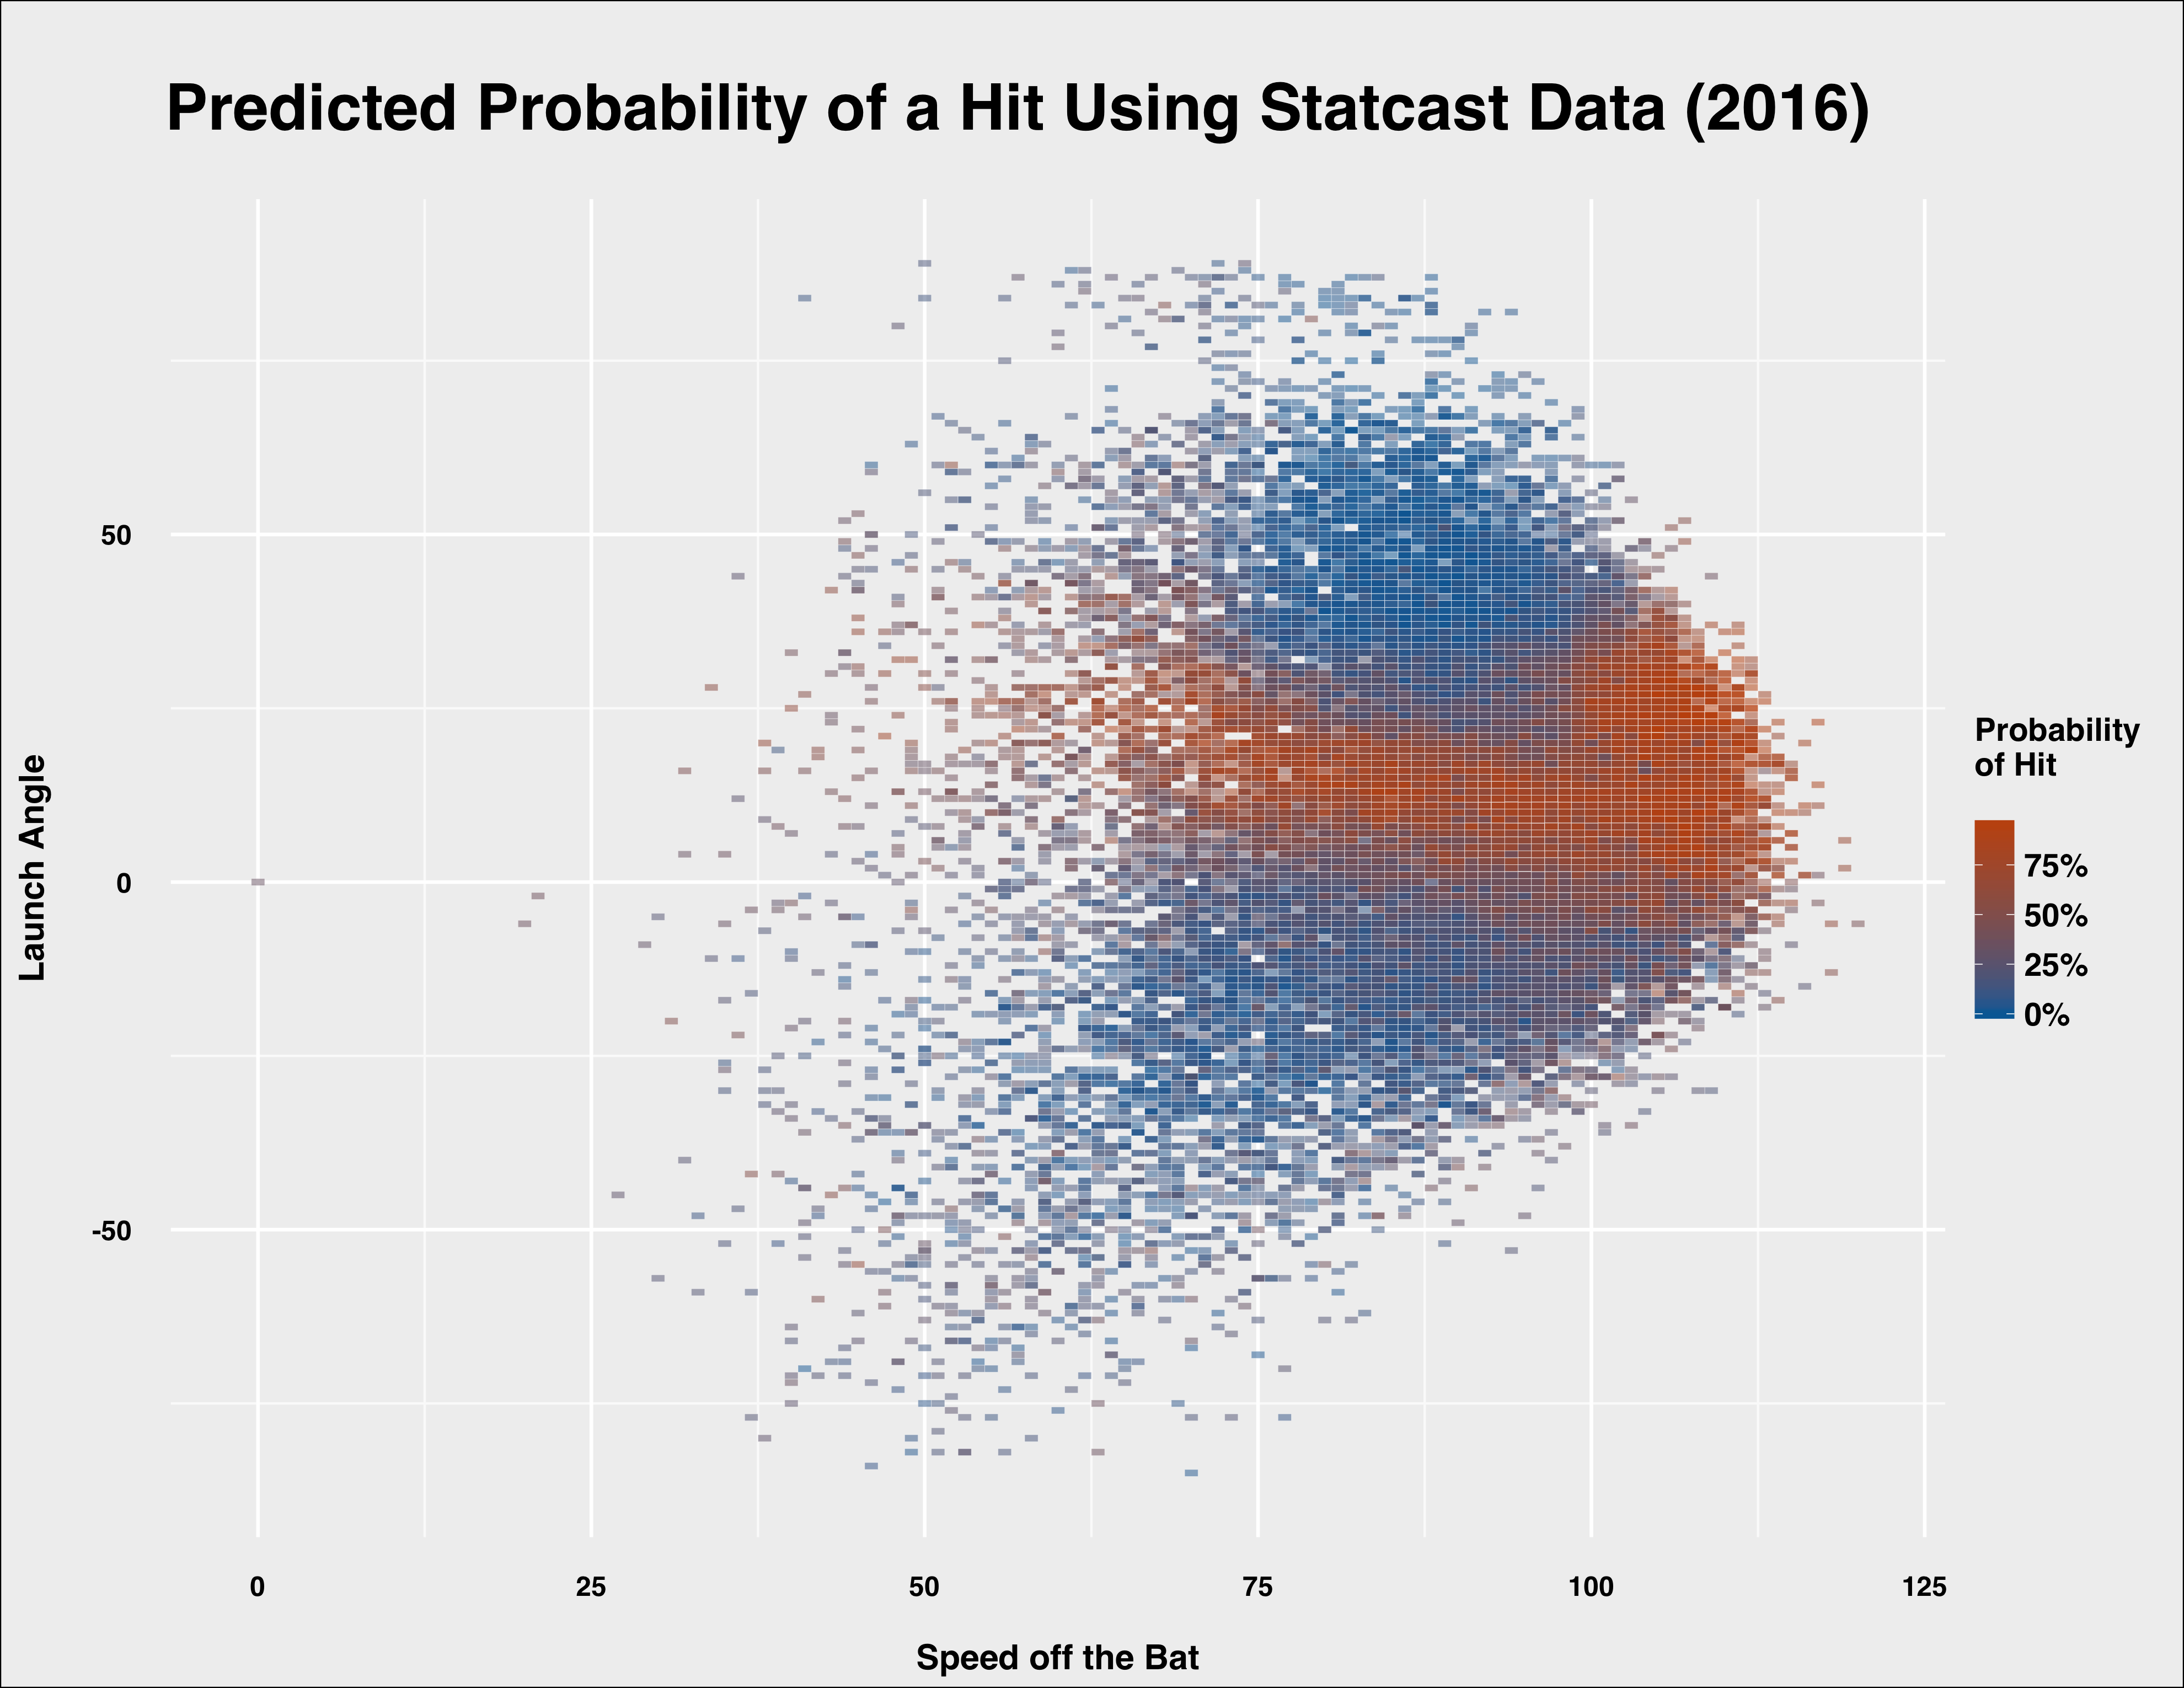
We’ve seen that a launch angle between 20 and 40 degrees appears to be optimal, and when you mix in batted ball speed over 100 miles per hour you are looking at essentially a guaranteed hit–in many cases, a home run. That aligns with the predicted probabilities of the model.

Comparing launch angle to distance we can see that a launch angle between zero and 20 degrees gives hitters a high probability of avoiding an out for any distance over 150 feet. When the launch angle gets too high (e.g. over 20), batters are generally looking at fly outs between 250 and 360 feet.
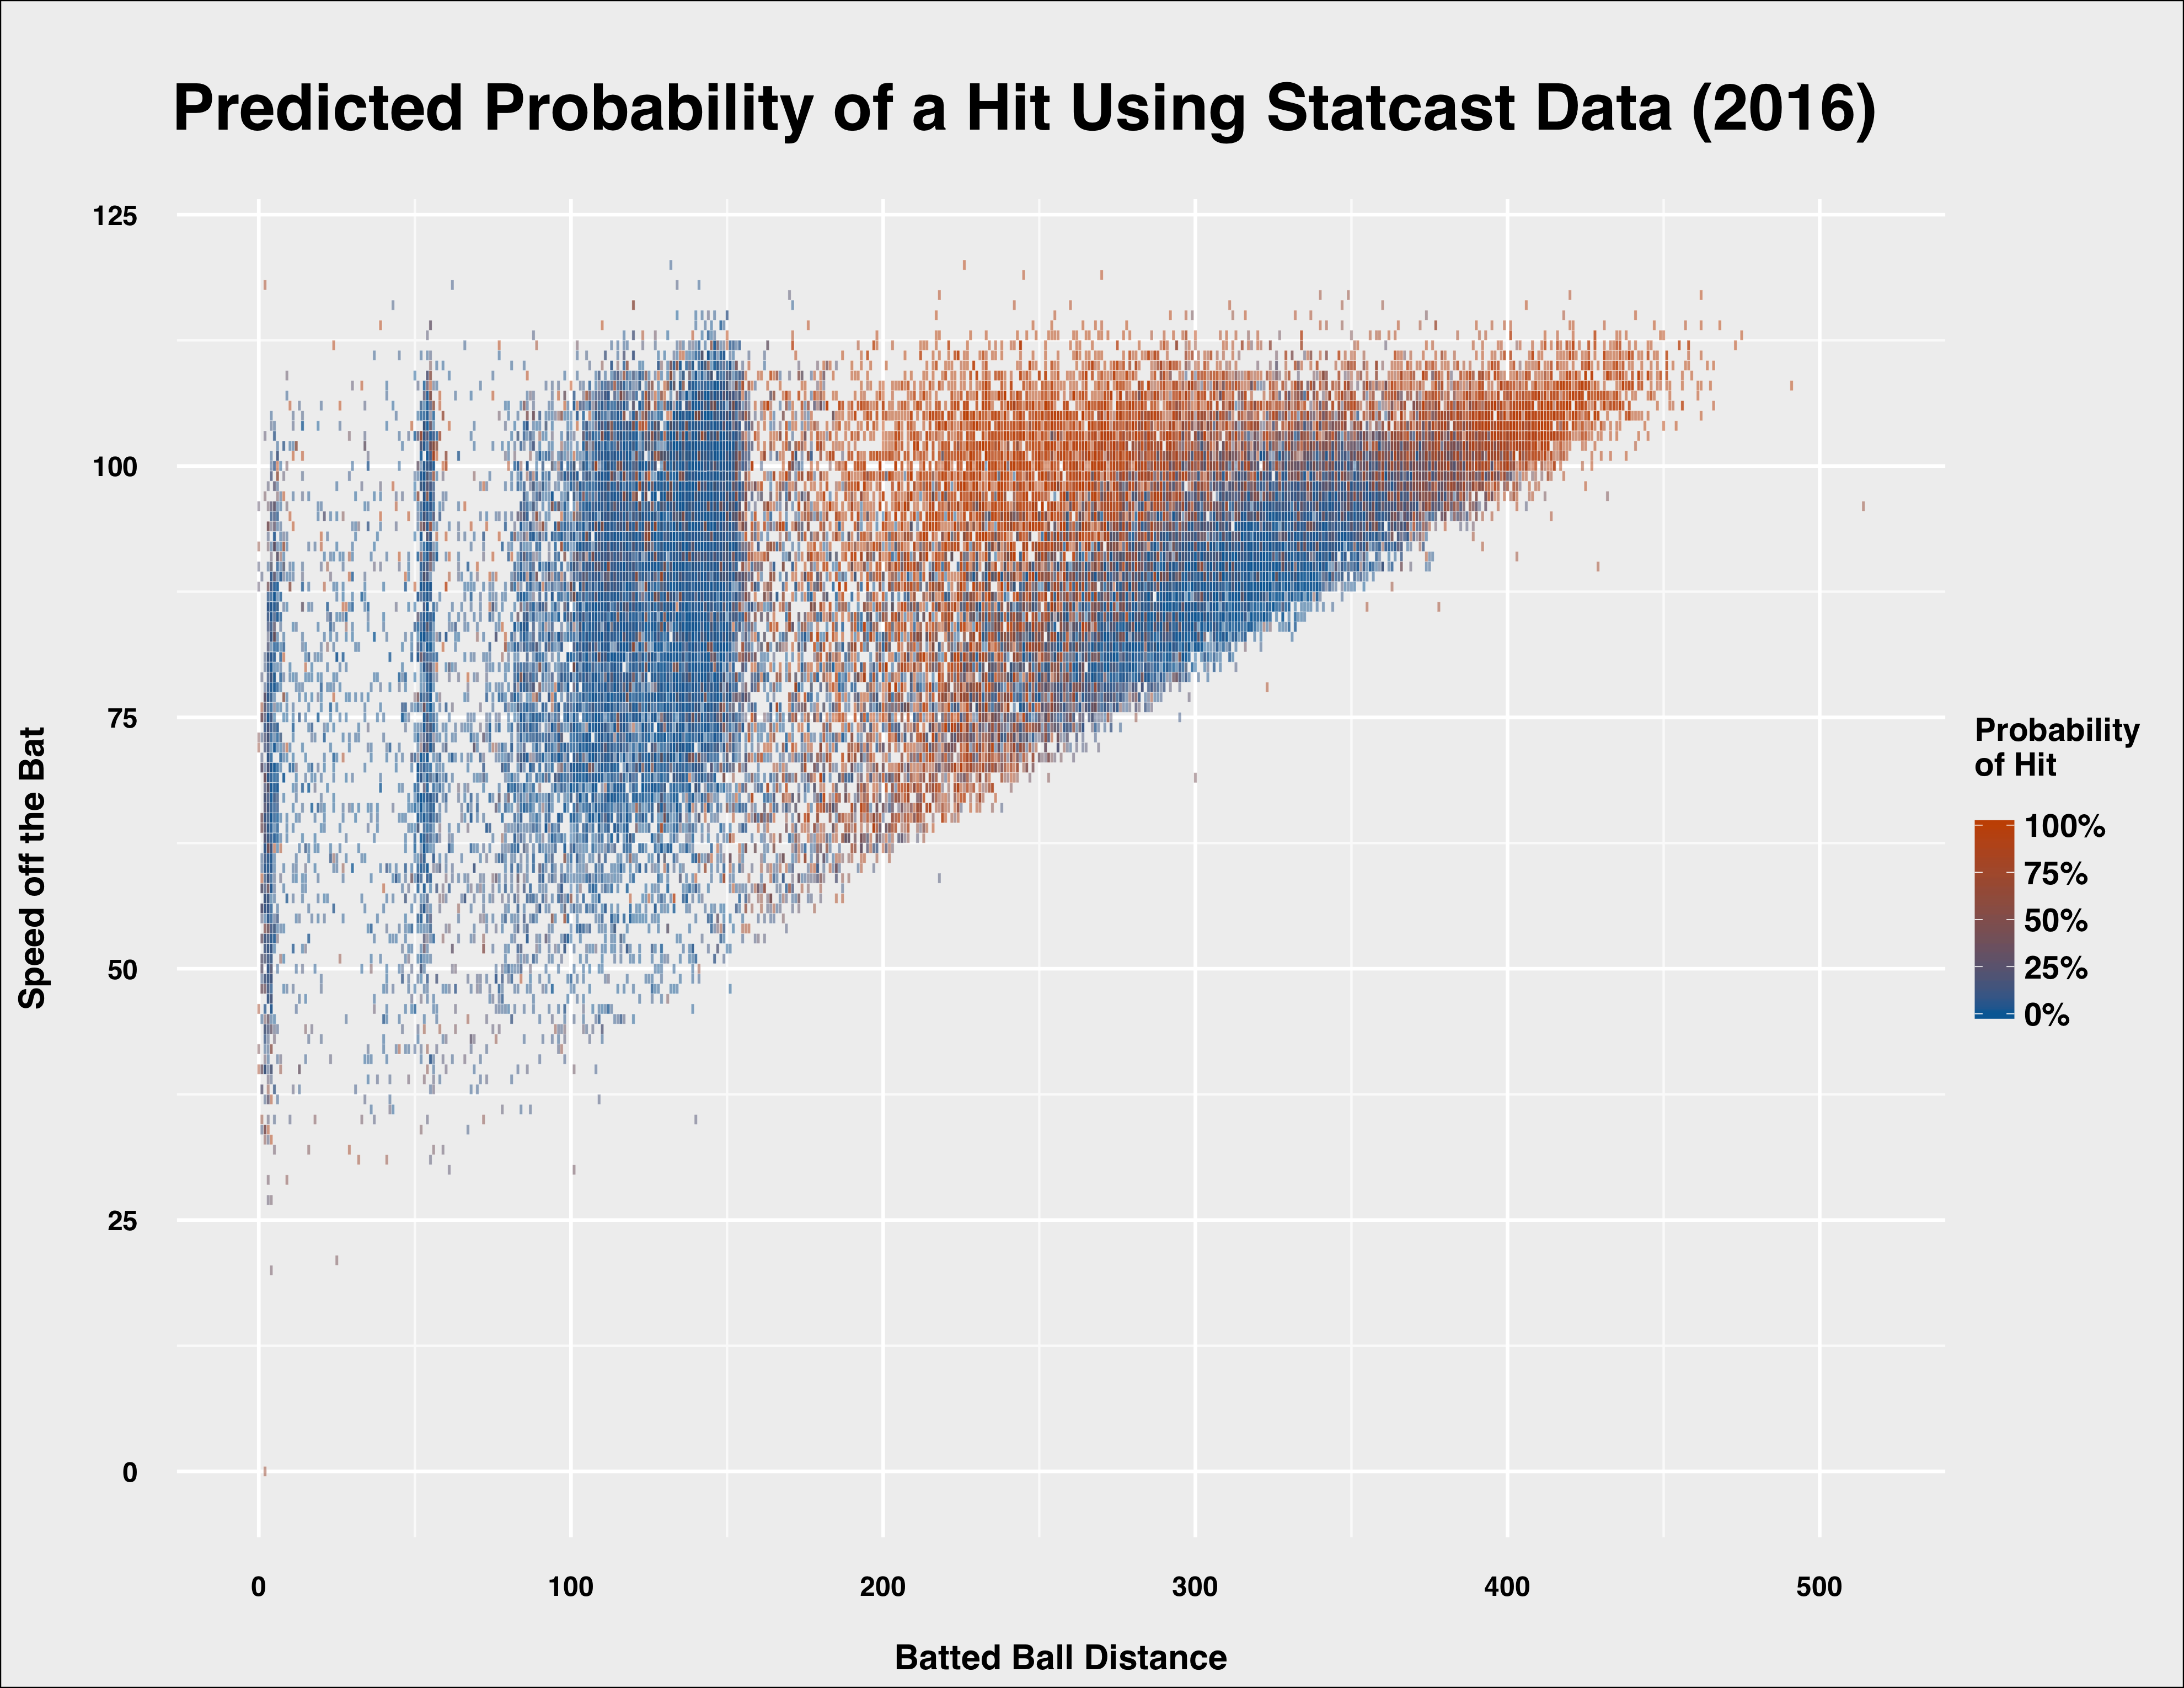
The model gives balls that are hit at a distance less than 100 feet a greater chance of being converted to outs, regardless of speed off the bat. This begins to flip as distance increases–which is related to launch angle. We can also see the diagonal boundary that indicates how distance relates to increasing speed.
These graphs align nicely to similar visualizations of batting outcomes based on Statcast or HITf/x batted ball data, so this provides additional confidence that the model is sound.
Another way to examine the fit between the model and actual outcomes is to compare the relationship between the average predicted probability of a hit based on ranges of batted ball angle and speed based on the model and the actual average probability.
I bucketed the test set in ranges of 10 degrees and 10 miles per hour and then compared the average probabilities a hit for the actual outcomes and those generated by the model.
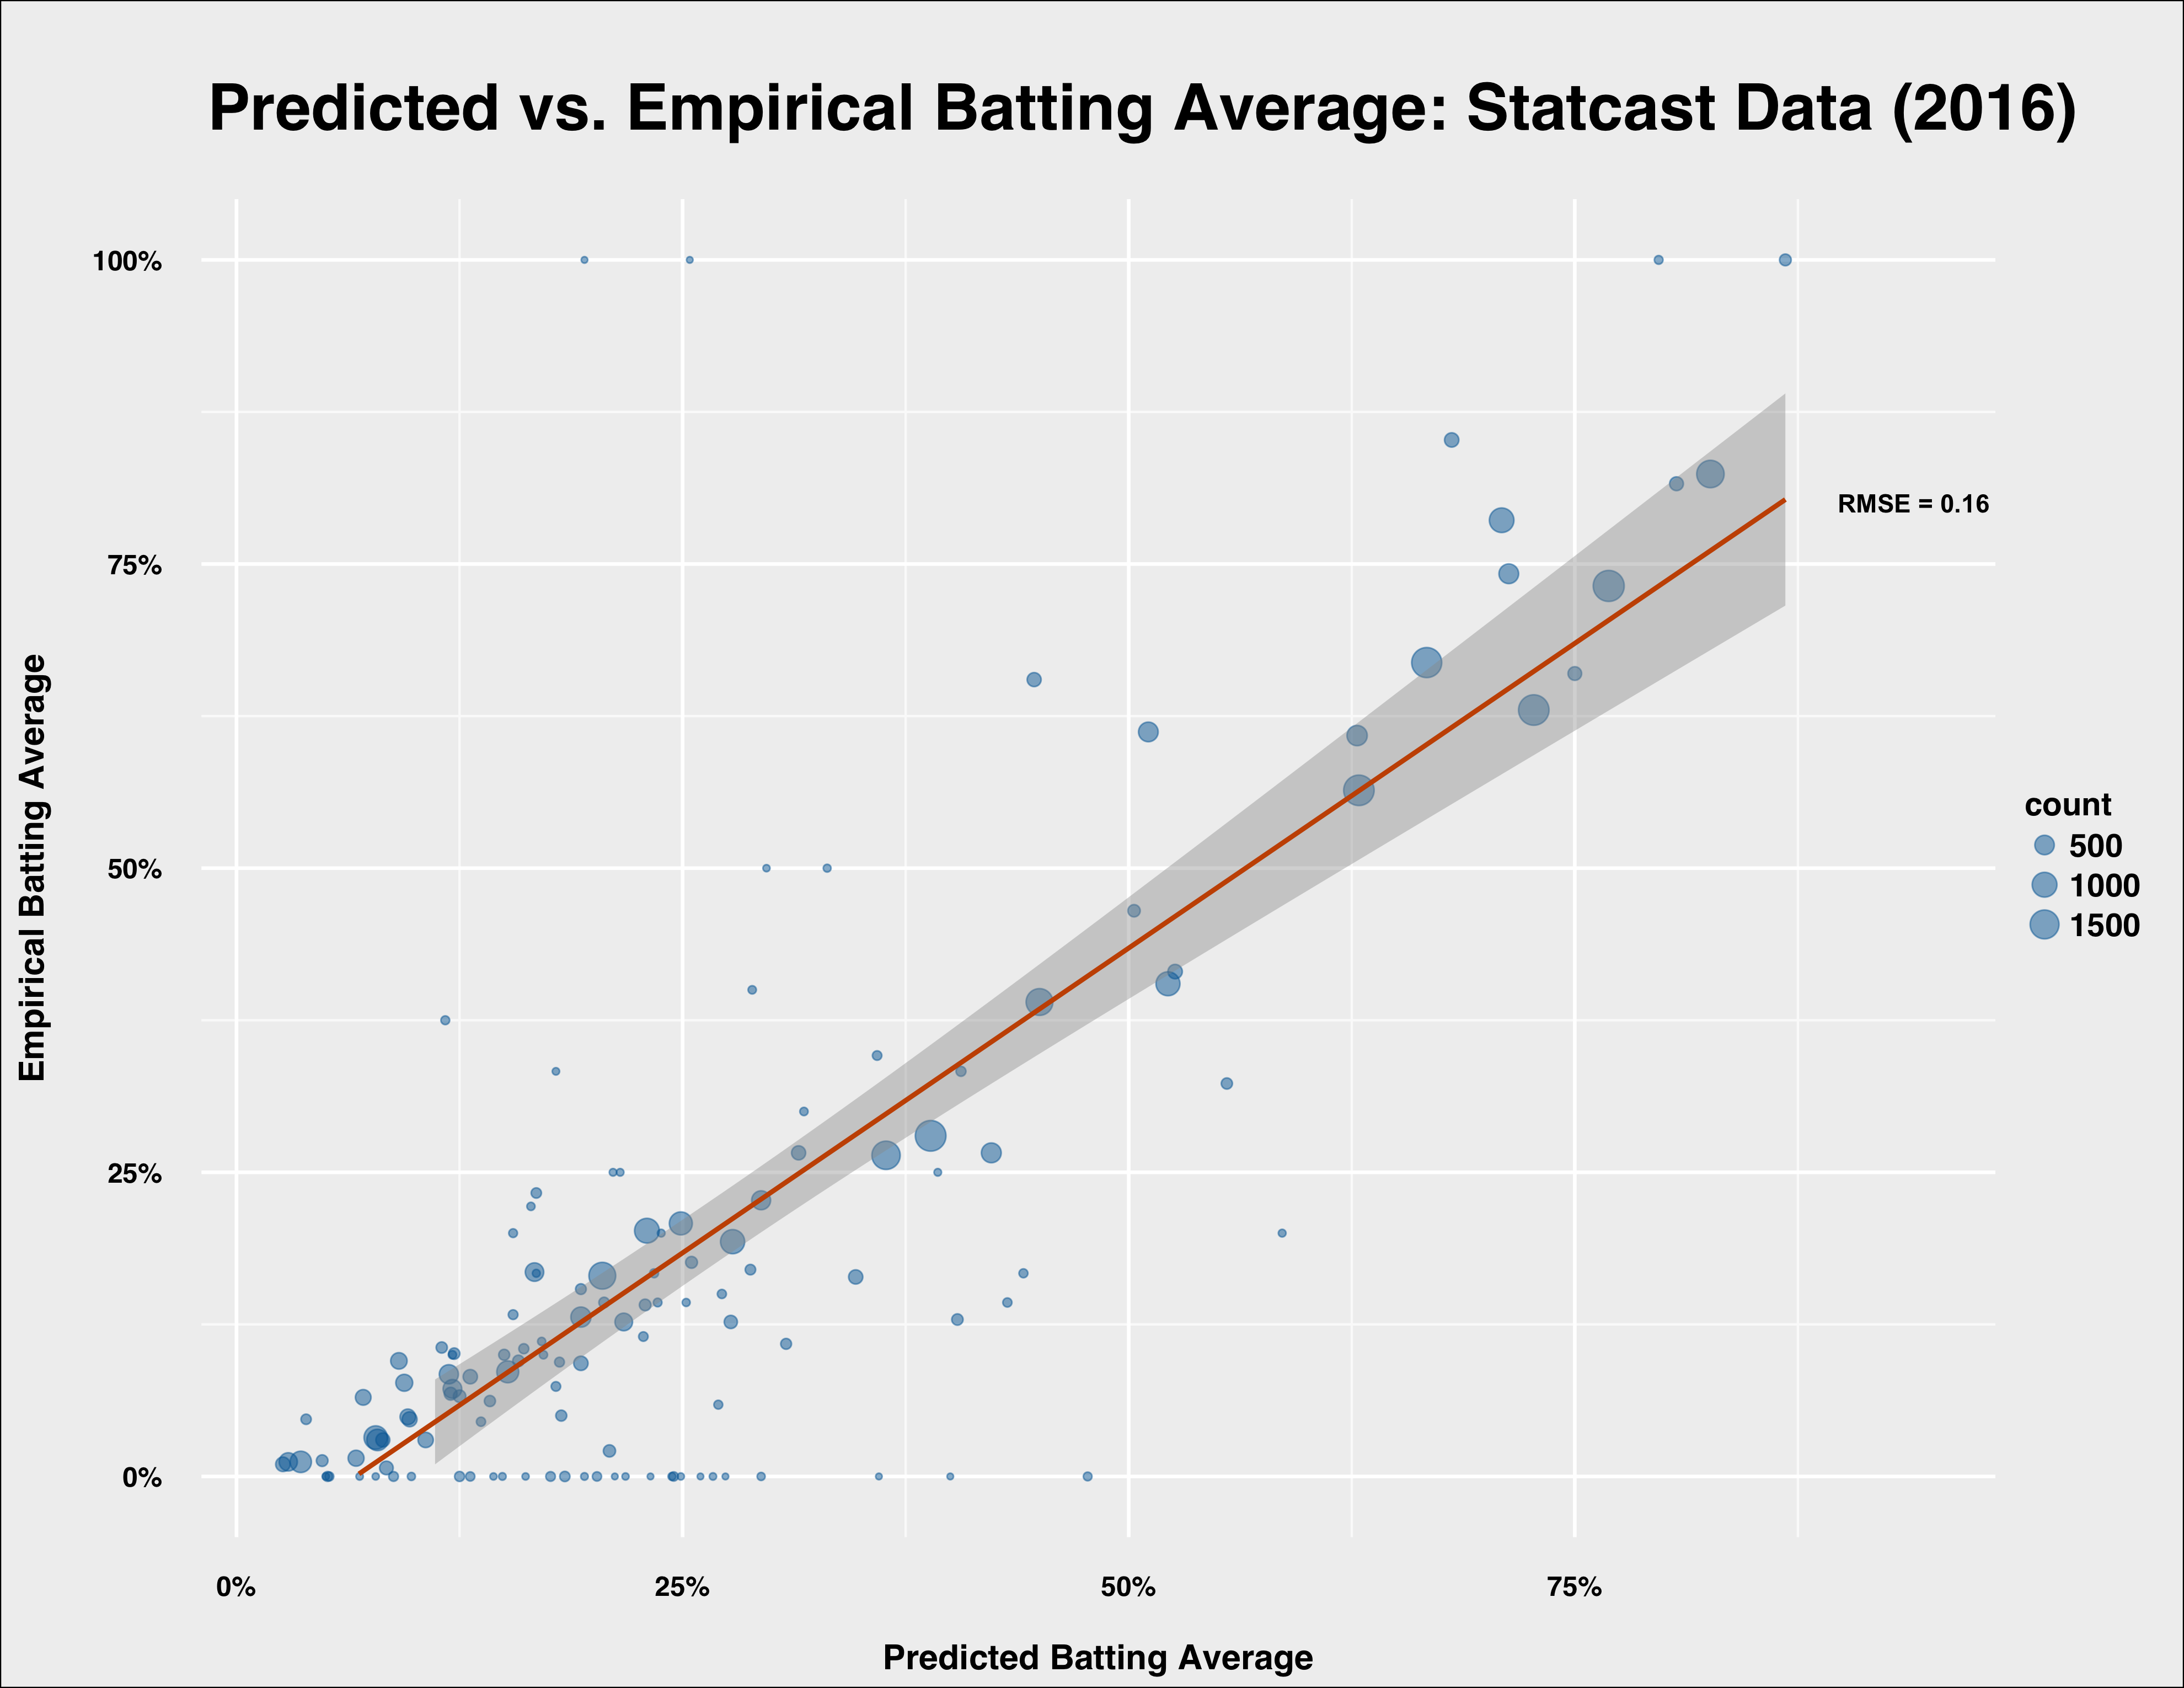
The fit is pretty good. The data points that are a significant distance from the regression line–basically, where actual data and the model disagree–are generally cases where we have only seen 10 or fewer actual batted balls with those characteristics.
However, there the model does appear to have some systematic issues with how well it classifies batted balls. Let’s plot and compare the location of batted balls that the model correctly predicted versus those where it missed.
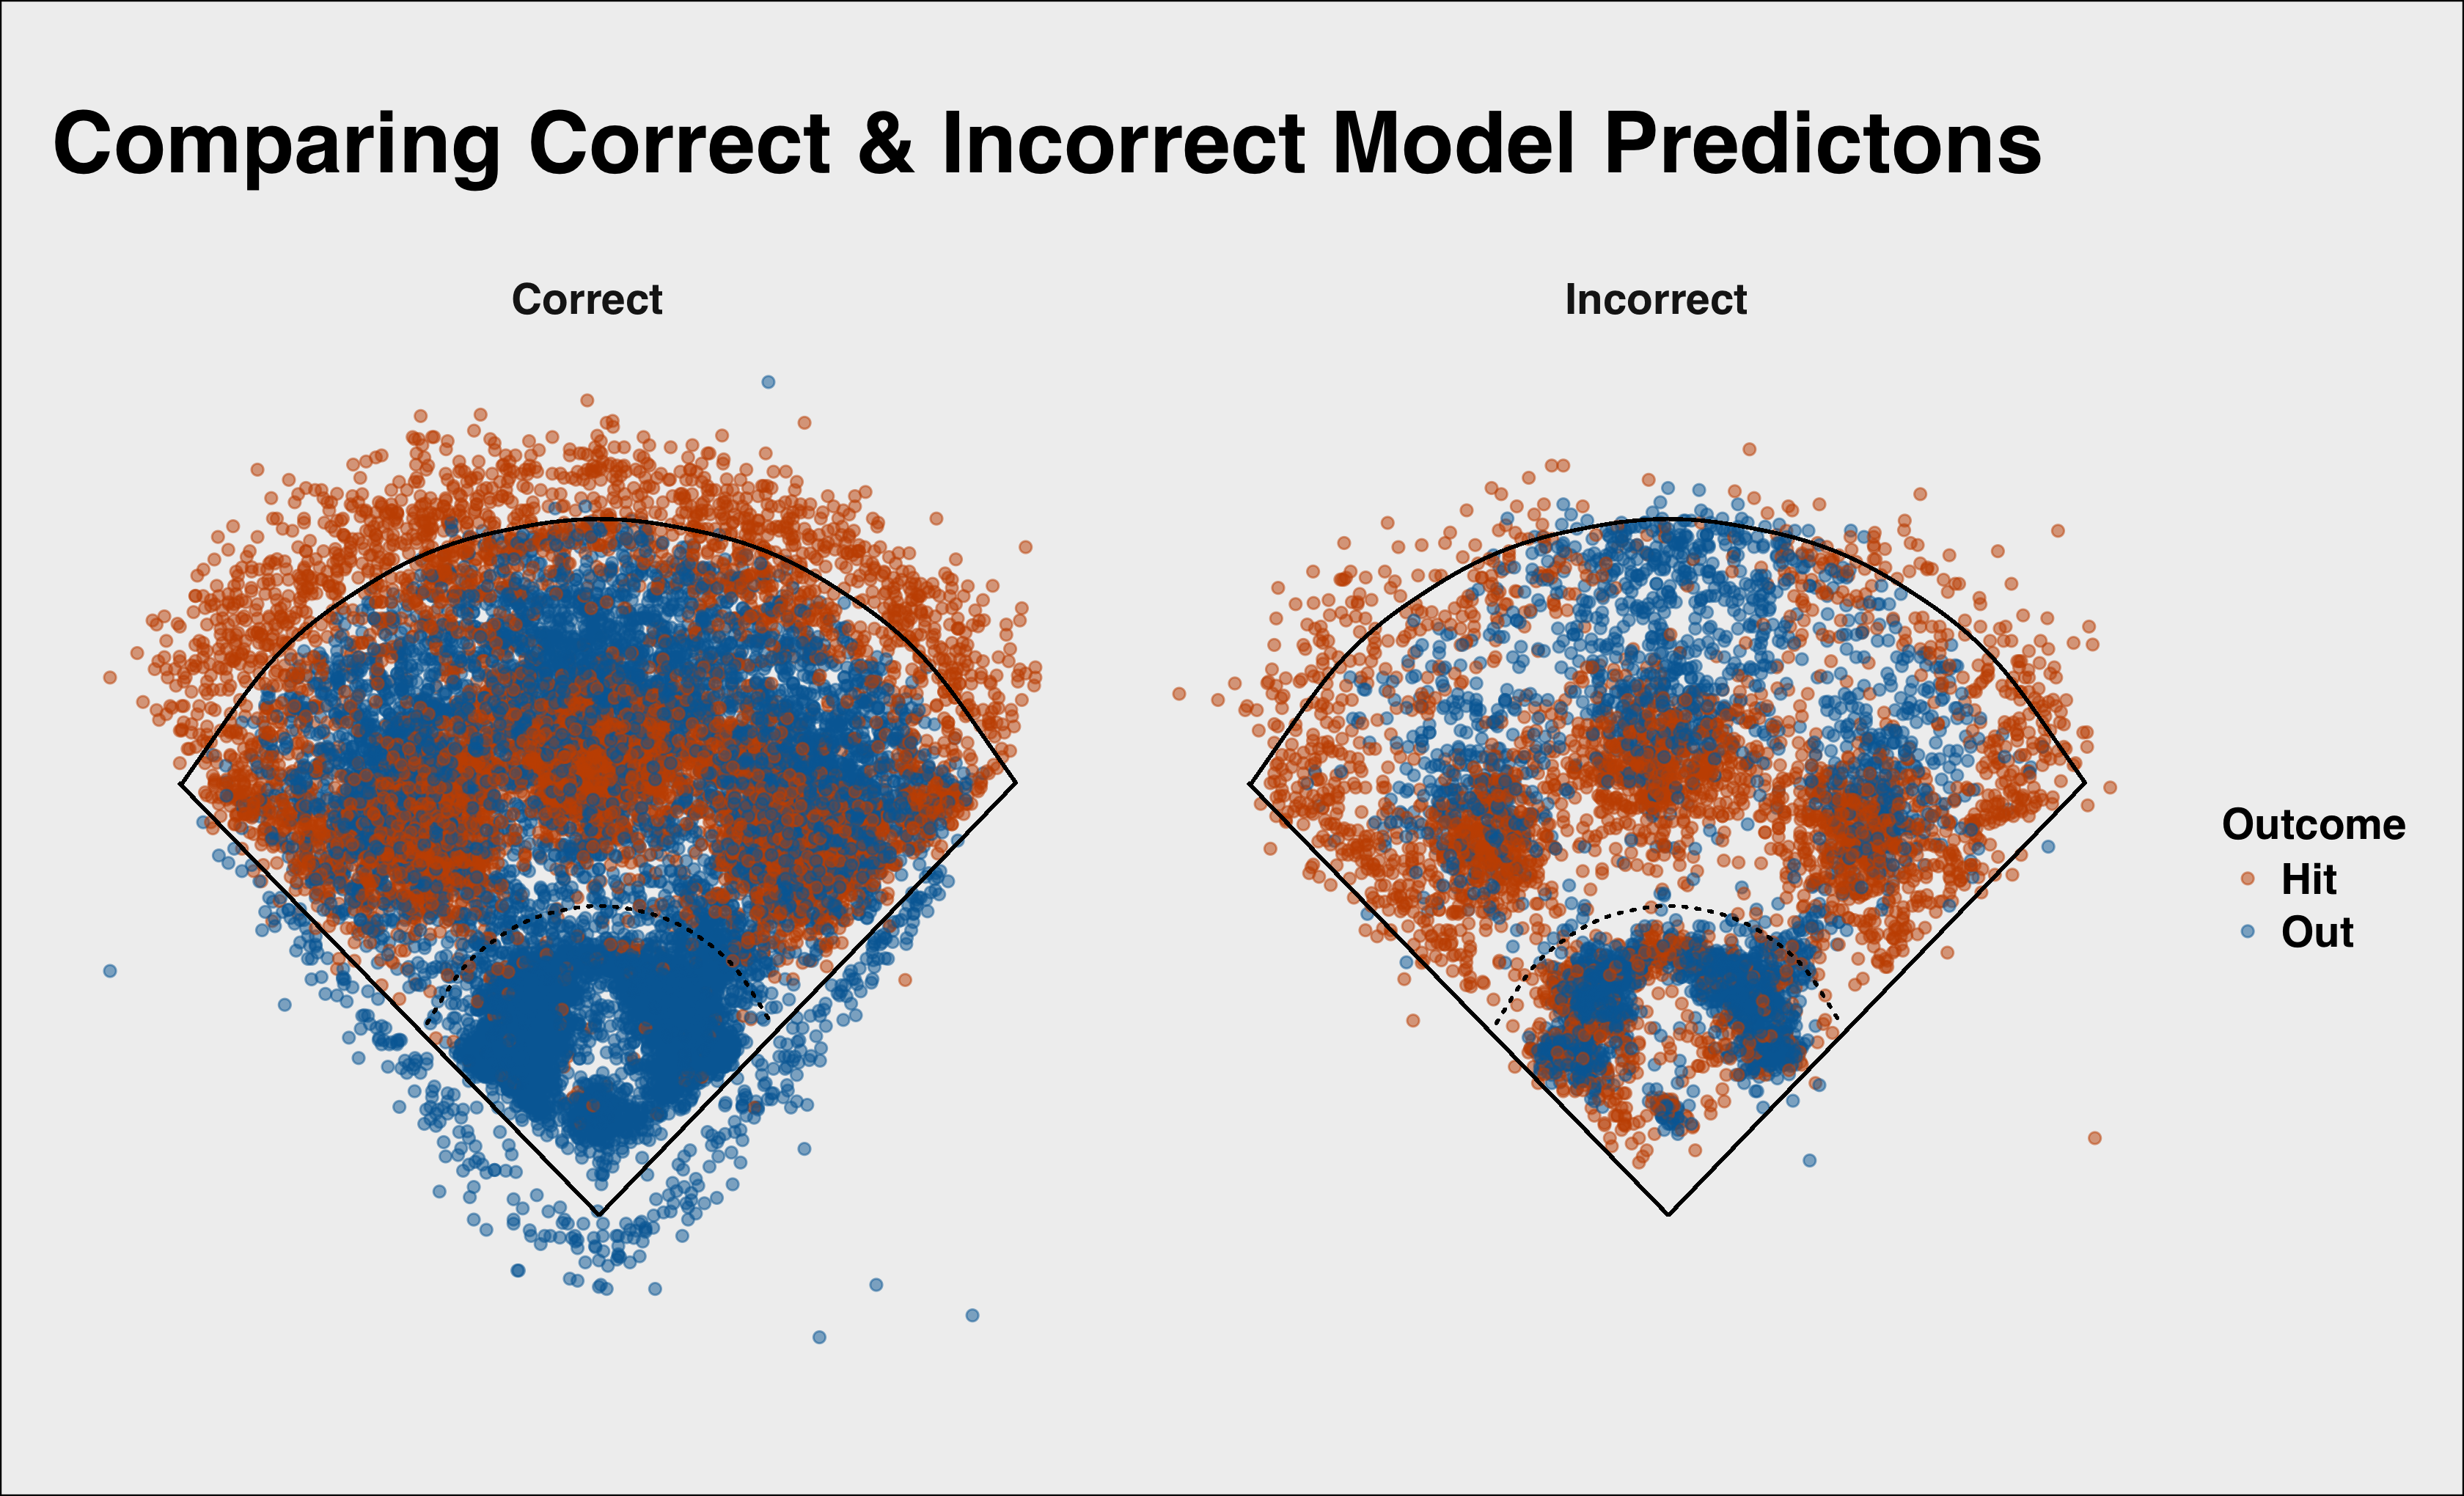
We see that, as noted above, the model tends to call outs better than hits. This appears related to some extent to the distance of the batted ball. The model can infer distance based only on launch angle and speed off the bat, since we excluded distance and batted ball location.
This is easier to see if we plot the accuracy of the model given different batted ball distances.
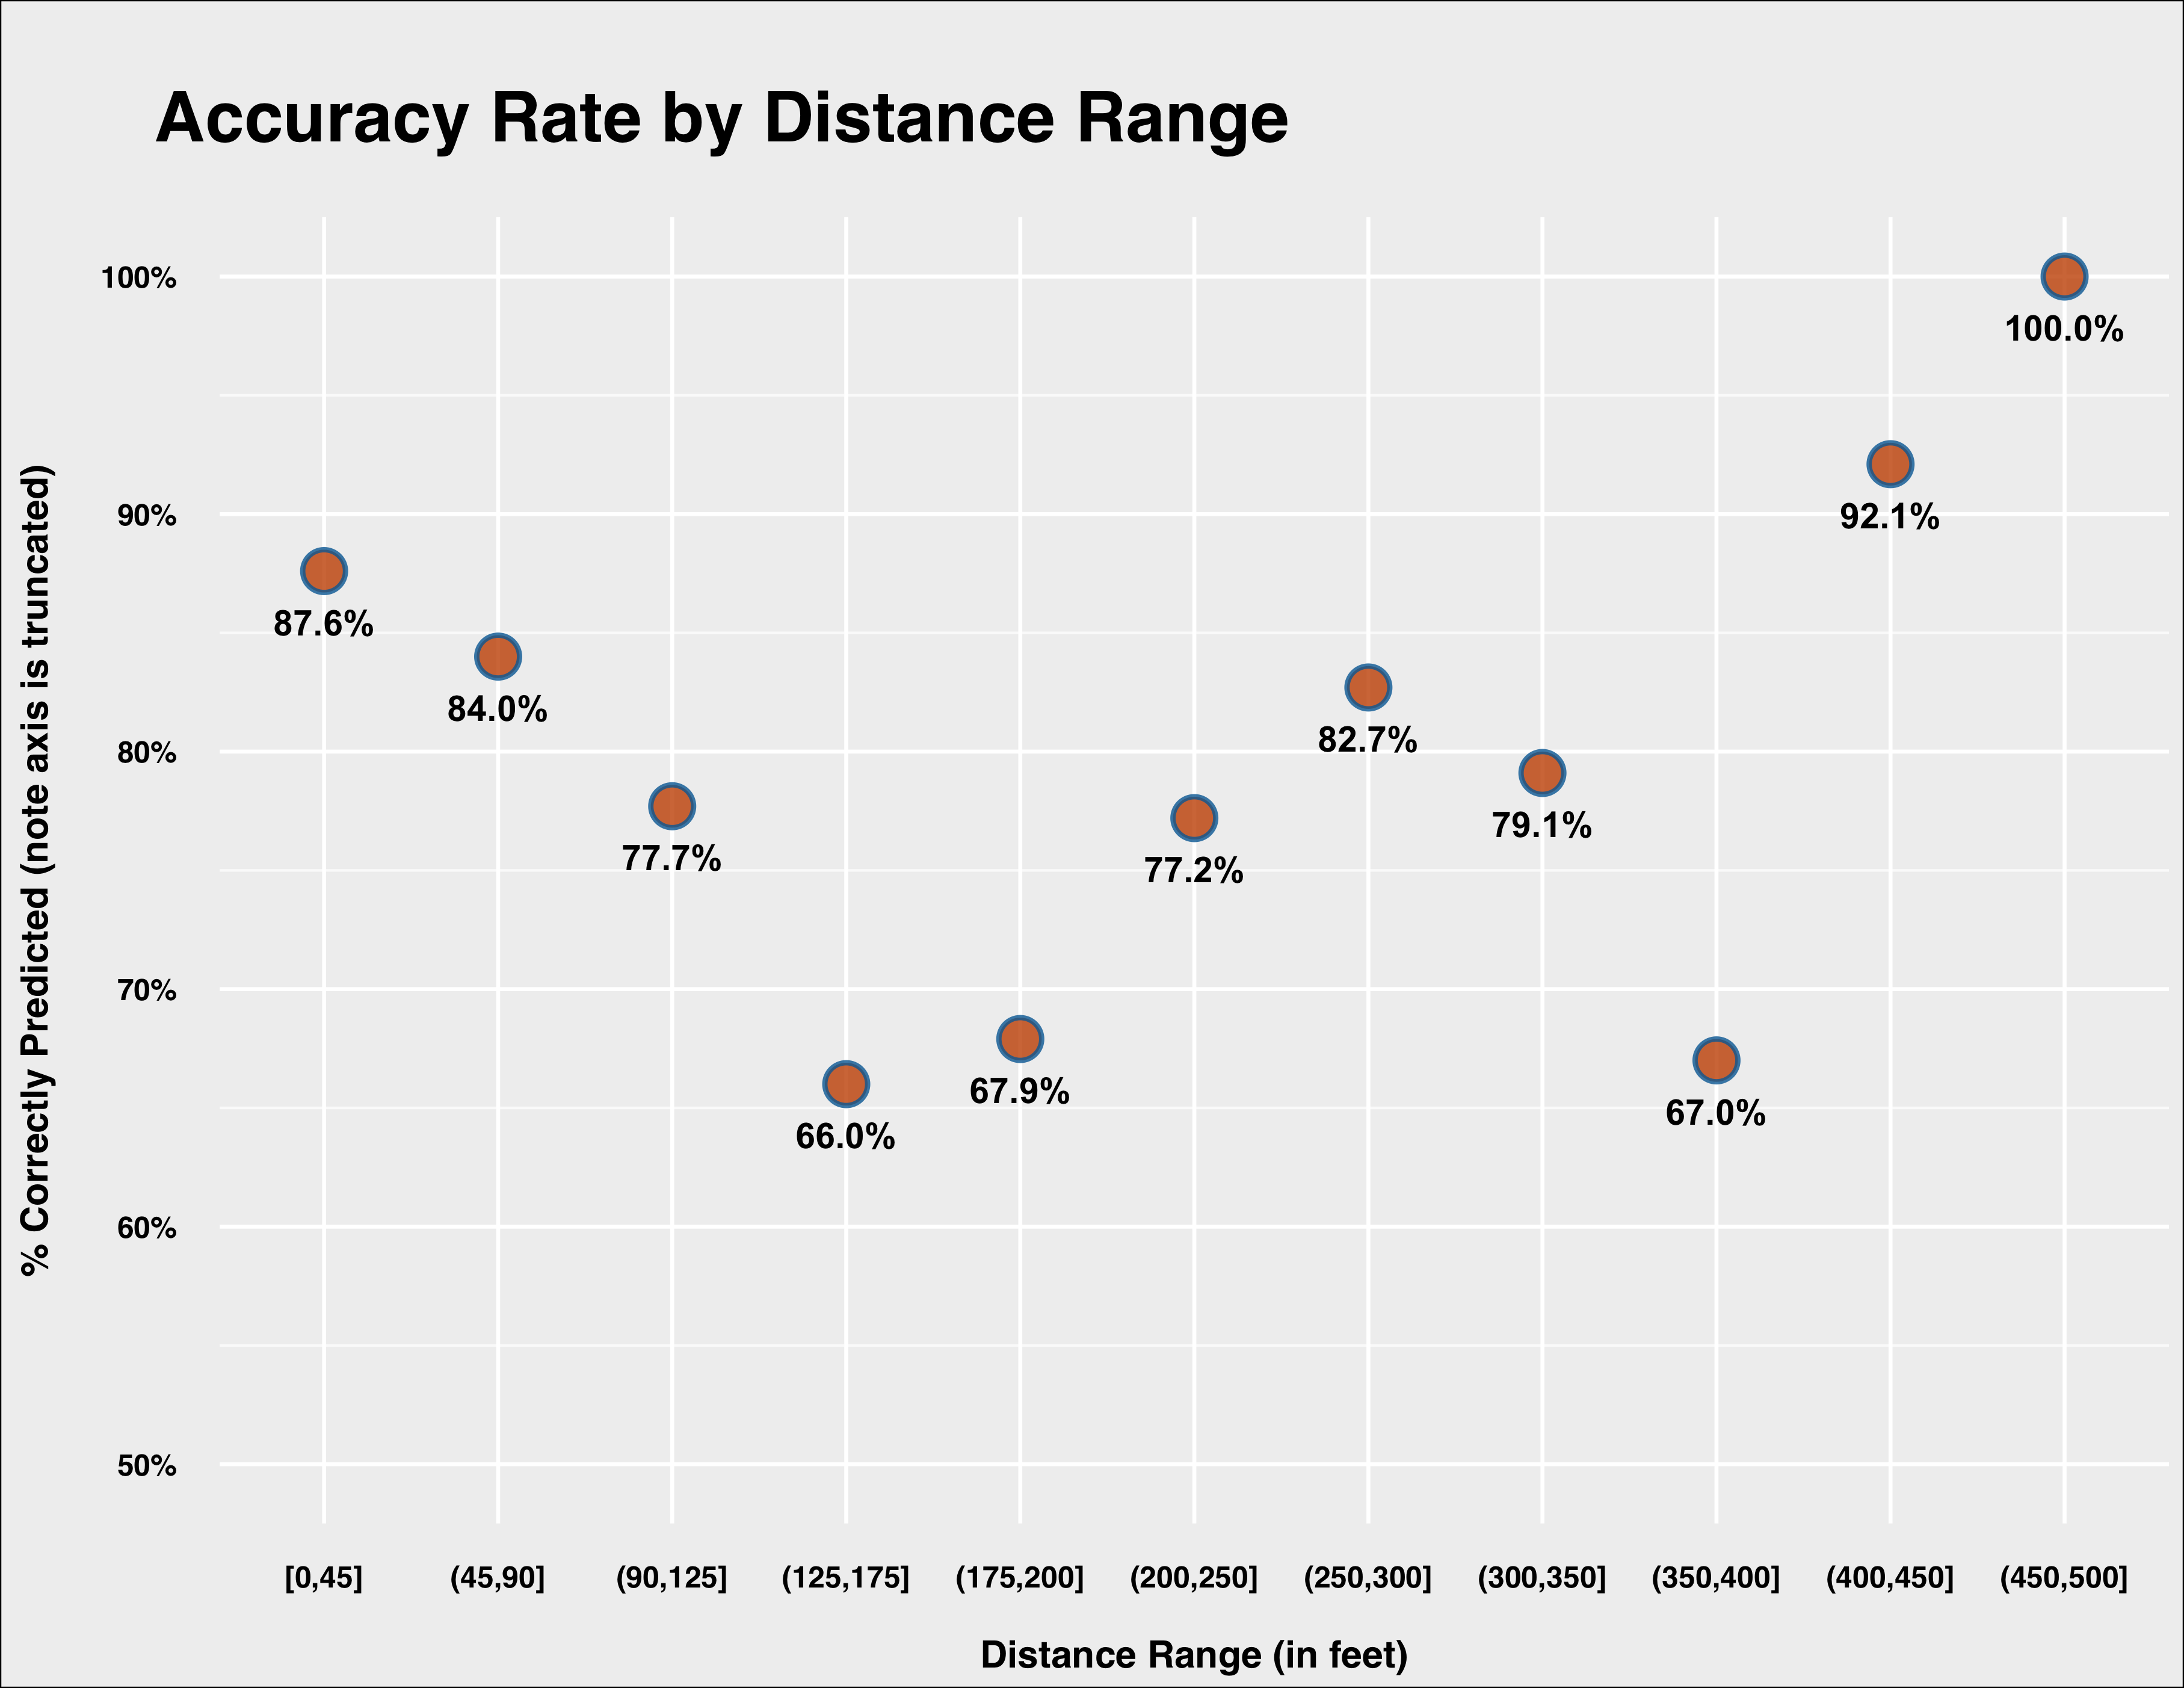
The model performs quite well on balls hit below 90 feet, but its accuracy declines dramatically between 90 and 200 feet. Accuracy rises again and sees a dip only between 350 and 400 feet. (Yes, I know the buckets below are not uniform, but I chose them based more on practical distances in a baseball setting given positioning, etc.). My initial guess is this is partly–but not entirely–due to lacking horizontal angle in the model. Including horizontal angle would help the model pick up where fielders normally are positioned and therefore when balls are more or less likely to be converted to outs, even considering how well they are struck.
Applying the model back the actual data allows us to not only classify events as hits or outs, but also derive a probability that they will be hits. Armed with this probability, we can look at batted balls in a slightly different way.
For example, in a June 9 game against the Twins, Giancarlo Stanton hit the hardest ball so far recorded by Statcast–a 123.88 mph scorcher. However, this didn’t result in a hit, but rather a double play started by the second baseman. While Stanton’s 123 mph batted ball was incredibly impressive, he hit it with a launch angle of -4.83 degrees. Taken together with the other variables, the model predicted that batted ball had only a 45 percent chance of being a hit. If we look at similar batted balls, we can see why the model was not as optimistic about that ball being a hit:

In fact, if anything the model was more optimistic than the empirical record suggests (largely driven by the extreme exit velocity), as only one ball struck in a similar manner ended up being a hit. My initial guess is if the model took horizontal angle more explicitly into account the probability would have been lower.
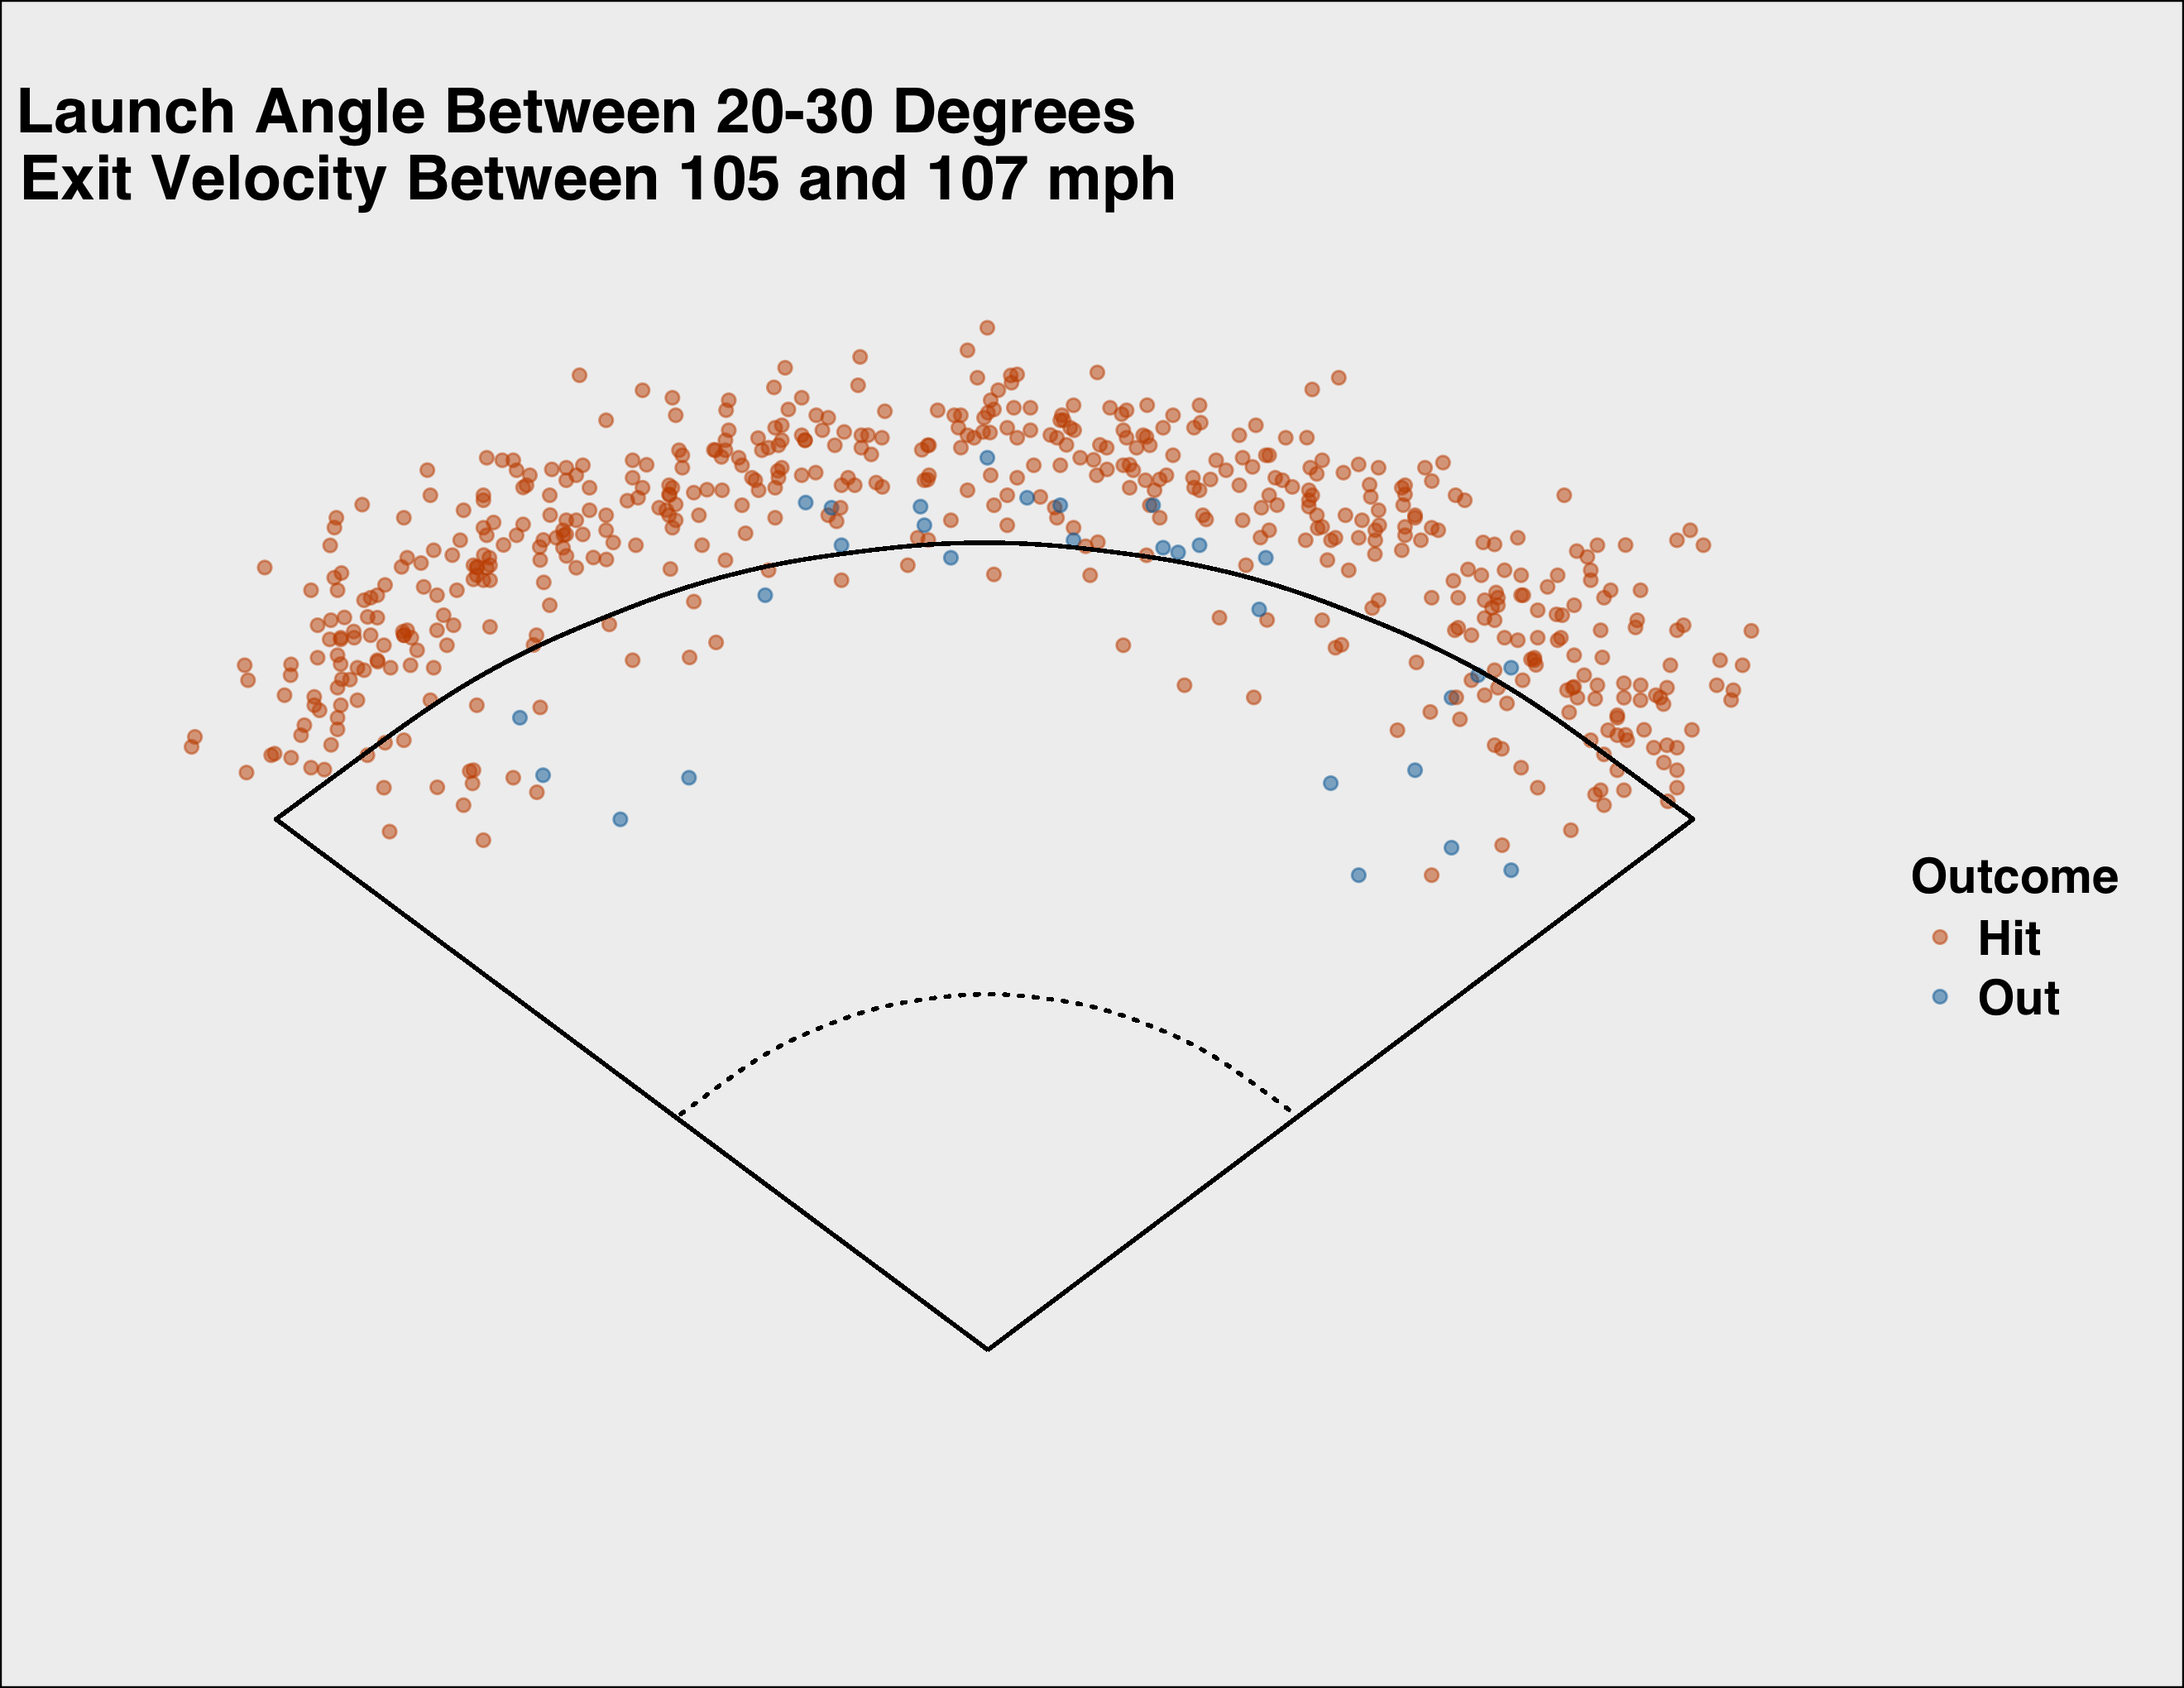
On May 19, Troy Tulowitzki crushed a ball to center field at 107.11 mph and a launch angle of 23.91 degrees. The ball traveled nearly 400 feet before it was snagged for an out. Tulowitzki’s ball had a 99.6 percent chance of being a hit according to the model. As you can see below, almost all balls hit in a similar way ended up as hits.
Summing Up
This is just an introduction to the model. I plan to perform more diagnostics on it, but I feel comfortable with the initial performance. Now, random forests inherently mitigate overfitting (notice I said mitigate, not eliminate), and the application of the model to completely out-of-sample data does provide some comfort. The model was trained on 5,000 observations and tested and validated on another 28,000. So I do not think overfitting is an issue, but I never like to assume anything.
The model also does an inherently better job predicting outs than hits. Again, I think this is in part due to the lack of horizontal angle information. I plan to incorporate that into a future version. My guess is the overall accuracy, as well as the precision and recall of the model, should increase pretty nicely as a result.
I also plan to expand the model to predict not just hits or outs, but also the type of hit (i.e. single, double, etc.). That would allow us to develop expected wOBA on batted balls and compare to actual performance, as well as begin looking at how predictive expected wOBA based on Statcast data would be and how many observations we would need before needing to add in an equal number of league average observations to accurately estimate true talent.
Finally, I am exploring ways to make the predicted probabilities available for both previous batted balls and for new batted balls. It may be something as simple as a table or possibly even a tool where you can input the characteristics of a batted ball and see it’s probability of being a hit. More on that soon.
As always, suggestions welcome.
References & Resources
- All code and data for this analysis can be found on GitHub.
- CRAN R Project, “randomForest: Breiman and Cutler’s Random Forests for Classification and Regression,” Version 4.6-12
- Many thanks to MLBAM and Baseball Savant making the Statcast data available via Statcast Search
- For a great introduction and summary of classification model evaluation criteria, see Jason Brownlee, Machine Learning Mastery, “Classification Accuracy is Not Enough: More Performance Measures You Can Use”
- Alan Nathan, The Hardball Times, “Going Deep on Goin’ Deep”
- Jonathan Judge, Nick Wheatley-Schaller and Sean O’Rourke, Baseball Prospectus, “Prospectus Feature: The Need for Adjusted Exit Velocity”
- Bo Moore, Galvanize, “What Counting Jelly Beans Can Teach Us About Machine Learning”
- Rob Arthur, FiveThirtyEight, “Who’s Hitting The Ball Harder This Year, And Who’s Just Getting Lucky?”
Awesome work!
Out of curiosity, what made you choose a random forest? Were you particularly worried that a greedy approach would induce a bias toward exit velocity? How does it compare against other tree based or nonparametric models? (or even parametric models, I suppose)
Thanks! Really just familiarity with the technique and knowing I cared less about interpretation/inference for this model and more about classification accuracy/probability generation. I have not run parallel models using different algorithms, but I plan to.
A great outfit can give us cou.edencifThongh these days, I consider myself put together if I’m not wearing the same thing I wore the day before. :/Shell recently posted..
hello!,I love your writing so much! percentage we keep up a correspondence extra approximately your post on AOL? I require a specialist in this space to unravel my problem. May be that is you! Taking a look ahead to look you.
Blizz wird bestimmt auch bald damit rausrücken, als WOTLK um 0 Uhr startete, waren ca. 700 Leute vor unserem Laden. Das sah schon cool aus. Aber alle waren ruhig, standen schön hintereinander und freuten sich auf das was da hinter der Eingangstür auf Sie wartete
I must show my gratitude for your kind-heartedness for those people who need help with this idea. Your very own dedication to getting the message across appears to be surprisingly functional and have surely made most people just like me to realize their ambitions. Your entire interesting useful information entails much to me and somewhat more to my office workers. Regards; from everyone of us.
Hey girls, Thanks for saying Hi!Marilyn~ Thanks for your congrats on The Irish Warrior, and for your well-wishes! Yes, we’ll definitely meet up–I can’t wait!
Great job on this article! I am impressed with your presentation of thoughts and writing skills. You must have put in hours of research on this subject to be able to write with such intelligence.
Joe’s point about national vs. global viewing should have gone one step further. It is also unfair to compare one show’s viewers against those of an entire global medium, which I believe Youtube, for example, can be correctly called. A more proper comparison would be to rank Youtube/Facebook’s 1 billion or so global daily viewers against the 4 billion global daily viewers of television.
Thanks Vera for your input. It sounds like you are transforming the body of the organisation by leading them into this revolution so that momentum will ultimately change the mindset of the head of the organisation. Did I get that right? ….. hoping to hear more about your journey as we progress with our cartoon series.VN:F [1.9.22_1171]please wait…VN:F [1.9.22_1171](from 0 votes)
la verdad me entere de esto y ke lastima que tomen peliculas de exito solo para vender, claro lei el libro y estuvo muy bueno la pelicula no se queda atras claro falto mas adaptacion pero sigue siendo de las mejores clasicos de terror
Thanks for the article. I was also curious about the motivation for the use of the random forest algorithm.
You may be interested in recent work that generates the posterior probability of events as a function of a continuous-valued vector of exit speed and horizontal and vertical angle. This allows not only classification of hits or outs but also the prediction of the expected batting average, slugging percentage, or wOBA for a batted ball vector. You can learn more at
http://www.hardballtimes.com/the-intrinsic-value-of-a-batted-ball/
As I mentioned above, it was practical given my use and familiarity with them in the past. I think ensembling with other methods could be useful. I am not as familiar with Bayesian techniques but would like to try it out and see how it could improve the model, especially moving into classifying types of hits and developing expected wOBA.
THX that’s a great anserw!
Lincoln disse:Vai ter internet wifi no local?Eu gostaria de mestrar um jogo de demonstração usando o Virtual tabletop da Wizards como tabuleiro.[] Reply:maio 4th, 2011 at 21:58Opa Lincoln,entre em contato viu email comigo para combinarmos isso.. []
I am SUPER Excited toooo!!!You and Glugs are going to make me cry.. I can feel it already!! (weddings have a way of making me all gushy eyed.. )PLUS: I can’t wait to see your dress .-= Briget´s last blog .. =-.
Tammy and Family, I am so sorry to hear of your sons passing. I remember you(Tammy) coming into the Halamrk store to buy him a card a a liitler something to put in his care package when he was serving our country overseas. You always spoke with such pr
Yeah, I need to head back to school. Learn how to spell you uneducated moron. This isn’t even a challenge anymore. What is “descrimination”? Are you making up words now? Key points in that last post: Pack Lethal, his sister, beastiality, goats…man you are a seriously troubled individual.
Yes, Larry, it will be very interesting to see how the Dept. of Health handles this. Thank you for your exposure of the message that these “pain pills” are endangering people’s lives and wreaking havoc on families. Keep up the good work!
Hallo Frau Janson, ich hab da mal eine fiktive Frage. Angenommen ein Student möchte arbeiten gehen, und ist nicht mehr familienversichert (Krankenversicherung), möchte aus dem Job mit möglichst viel Geld nach Hause gehen. Eignet sich da ein 400€ Job (Minijob)besser, oder ein Midijob mit 401€? Es geht mir hier fiktiv um das Geld, das nach KV (Minijob) abzug bzw. nach den gesetzlichen Abzügen (Midijob) übrig bleibt. Vielen dank.
Oh this is adoravel Vicky. I love the papers and your coloring is gorgeous sa always. I love the senitment to. You really inspire me. Hope your headache goes away quickly. Hugs! Mojca
Okons#8230;&ameoye please help me. I am in love with a friend, and because of this I have tried to end my relationship with her. She got really sad and I ended up backing down. Was ending this the right thing to do? If so, I will have no regrets in doing it.
Incredible work Bill.
Couple of questions/comments:
1) Given the huge differences in distances for Tulowitzki’s struck ball, is a backspin/forward spin need to be considered in a model? I don’t believe that wind, atmospheric conditions could have such a huge impact on batted ball distance.
2) Is the vector of the ballfield need to be considered in a model? 400 foot fly balls to left field (other than the old-old Yankee Stadium) would be homers, but in almost all new ballparks windup on the warning track when hit to dead center.
3) To adjust for changing times, does a binomial shift-factor need to be included?
Thanks!
1) Possibly, that’s a good next place to start. I actually want to incorporate more actual physics knowledge into subsequent models, so that would definitely include spin.
2) I think so, that’s why I mentioned that I wanted to include the horizontal angle of the batted ball along with speed and launch angle.
3) Could you say more about this? Not sure I entirely get what you are mentioning here.
Hi Bill,
My thinking was that ground balls hit into a shift are far more likely to be outs than ground balls not hit into a shift. Therefore, a soft of Y/N shift was on/not on and horizontal (hit into the shift or against the shift) would be far better at predicting hits/outs.
Ah, so sorry I completely blanked when I first read this. Yes, having fielder positioning data would be great, but right now there isn’t a reliable way to incorporate that in.
Regarding effect of spin,wind, etc.,we should discuss. Will you be at the Saberseminar in August?
Unfortunately, no. We schedule our vacation before the dates were announced. I’ll send you an email.
“Every since Statcast was announced”
It’s tough when your first word is a typo…
That does make things tough, doesn’t it? That’s on me. Can I claim that I was so excited to read the article that I skipped over the first word? No? Ok, fine.
Thanks for the catch, I fixed it.
I found the difference between Models 1 and 2 interesting: the park, hitter, and team data seemed to be a mixed bag performance-wise. I’d be interested to know how a model with only launch angle and speed would perform relative to Model 5.
Yeah, they seem to get overwhelmed when you have the location and distance data, but help to some extent when you don’t. I did not originally run it, so I gave it a go. Essentially, recall drops to 63%, while precision increases slightly to 69%. The overall accuracy is roughly the same, while the F1 Score declines to .659. At this point I am more skeptical of pulling them out just knowing the practical impact of handedness, park and fielding team “should” make, but part of me wonders whether adding the horizontal angle data will make one or more of those variables unnecessary while significantly improving the accuracy of the model.
Much appreciated, thank you! It’s always fascinating to see how deeply (or not) those situational elements affect results. Great article, and thanks for introducing me to random forest models.
Yes, totally. I’m having twins, so my nutritional needs far exceed anything I’ve done in the past. No low fat or diet products. I’ll occasionally eat a Stouffers dinner, but no Lean Cuisine or other reduced calorie foods, like diet sodas. I drink 3 cups of whole milk daily now, where I used to drink 1% ocoalicnasly. I eat full fat yogurts, dressings, etc. I do not drink any sodas or other caffeinated beverages. I also eat all day long. I have three meals + substantial snacks about every 90 minutes.
I’m looking for a list of the best top ten web analytics and search analytics software or service. Which website analytics do you think is the best? October 27, 2012 The Inc
Slávku mÄ› by ale zajÃmalo, na Äem KONKRÉTNÄš se ten ÄlovÄ›k urazil. Minule jsme o tom mluvili s nerudou. Domluvili jsme se, že si každý znovu pÅ™eÄeteme Božà blud s cÃlem najÃt pasáže, které by se mohly jevit kÅ™esÅ¥anům jako urážlivé. Žádnou takovou jsme nenaÅ¡li!Tak by mÄ› fakt ohromnÄ› zajÃmalo, co jsme teda pÅ™ehlédli.PS. to s tÄ›mi karikaturami mÄ› fakt dostalo. Co je ten kÅ™esÅ¥an proboha za ÄlovÄ›ka?
It depends on the facts. Failing to turn him in is one thing (i.e. probably legally okay, if kind of a jerk move). Hiding or sheltering the fugitive is another, as is (essentially) holding the fugitive for ransom from the police.
This is a very good list about 2010 Oscar winners. After read this list as you post I am really very happy because of I seen most of the movies from this list. And I proudly say that Oscar 2010 awards won truly deserving candidates.
Difatti. Il punto è che non ci si deve dire di sinistra (in italia almeno da livorno in poi, 1921!, per chi ha mantenuto una certa linea), se si è contro alcuni punti decisivi di quest’ordine politico sociale. Non concordo invece su certo nostalgismo del buon capitalismo non liberista postbellico, che non era meno, probabilmente di più, infame di questo.p
Great job, Bill. I’m not familiar with the scale function in R, but wanted to ask if you checked for normality of predictor variables before throwing them into scale? Real-data distributions can be tricky to normalize.
Thanks! Yeah, speed and angle were pretty normal in their distributions before transformation. Distance was more of a mixed bag.
Hit line shots. Hit them hard. Groundbreaking!
Bill – Its interesting to see the new research with new approaches that has transpired since the Statcast data has been released to the public. But what ha been released is essentially a part of analogous Hit Fx data and that has been around for a while including the public release of a single month’s data in 2009 that generated metrics that are equally applicable to the available Statcast data. One of those metrics was my own Skill Based Metric: http://www.hardballtimes.com/using-hitf-x-to-measure-skill/. While my predicted the delta runs for binned Vertical Angle, SOB and Pull, Center and Opposite Field designations rather than predicting hits, I was able to learn some things that might be of use to you in your research.
First, although I originally thought that Speed Off the Bat (Exit Speed) would be the most useful data in determining batter skill it soon became apparent that what we really needed was the speed of the hit ball in the XY plane. What we really needed was accurate hit ball landing locations and hang times, data that Statcast should be able to provide but has not yet. Hit Fx was not able to be extrapolated to provide hnang time or accurate hit ball landing locations because it lacked information on the ht ball’s spin, but XY plane velocity could be determined from Hit Fx SOB and vertical angle by simple trigonometry and was much better than SOB as a measure of hitter’s skill. Second, the single month of Hit Fx data was not sufficient to determine whether batter’s actually had a true talent for hitting to certain horizontal locations more granular than pull, center and opposite fields. You have mentioned future research that would use horizontal angle data to predict hits and outs and I am certain that it would help improve your metric’s ability to do that, but to be useful for predicting a batter’s future performance it has to be a skill that is repeatable for him and so far that has not been demonstrated to be true. Statcast’s multiple years of available data will be useful in answering this question when it begins to include horizontal angle data. Third, defining well hit balls with a single measure is best done by the vertical angle at which it is hit rather than any speed measure, even velocity XY. The reason for this is that almost all major league baseball position players can swing the bat hard enough that square contact will result in an exit speed grater than 100 MPH. The trick is to hit the ball squarely and the vertical angle is the best measure of whether that has been accomplished.
As proof for these assertions I used only two bins for VA. One for those contiguous angles that predicted more than 50% hits and the other for those angles above or below that predicted more than 50% outs. The results were more than 72% accuracy. I next used 5 bins of three speeds of vXY, below 75 MPH, 75 to 95, and above 95, and determined the contiguous angles for each bin that resulted in either greater or less than 50% hits (below 75MPH predicted all outs), I was able to achieve an accuracy of grater than 76 percent. With 5 speed ranges and 11 bins the results were more than 78% accurate.
Fantastic! Nice Job Bill.
Bill – great article. Curious on your thoughts to tweaking this to use Pitch F/X data to predict the likelihood of a “barreled” ball (for a given pitch type / hitter) … basically one step back from what you did here? Could that be applicable to certain hitters or would it potentially end up being a “water is wet analysis?
Bill, you mentioned using the hc_x and hc_y fields. My experience has been that these are not very intuitive sets of coordinates. I am attempting to understand them a little better and I have a few unanswered questions namely what are coordinates of the plate and bases. Any information would be greatly appreciated.