Visualization: Hall of Fame ballot results from 1968 to the present
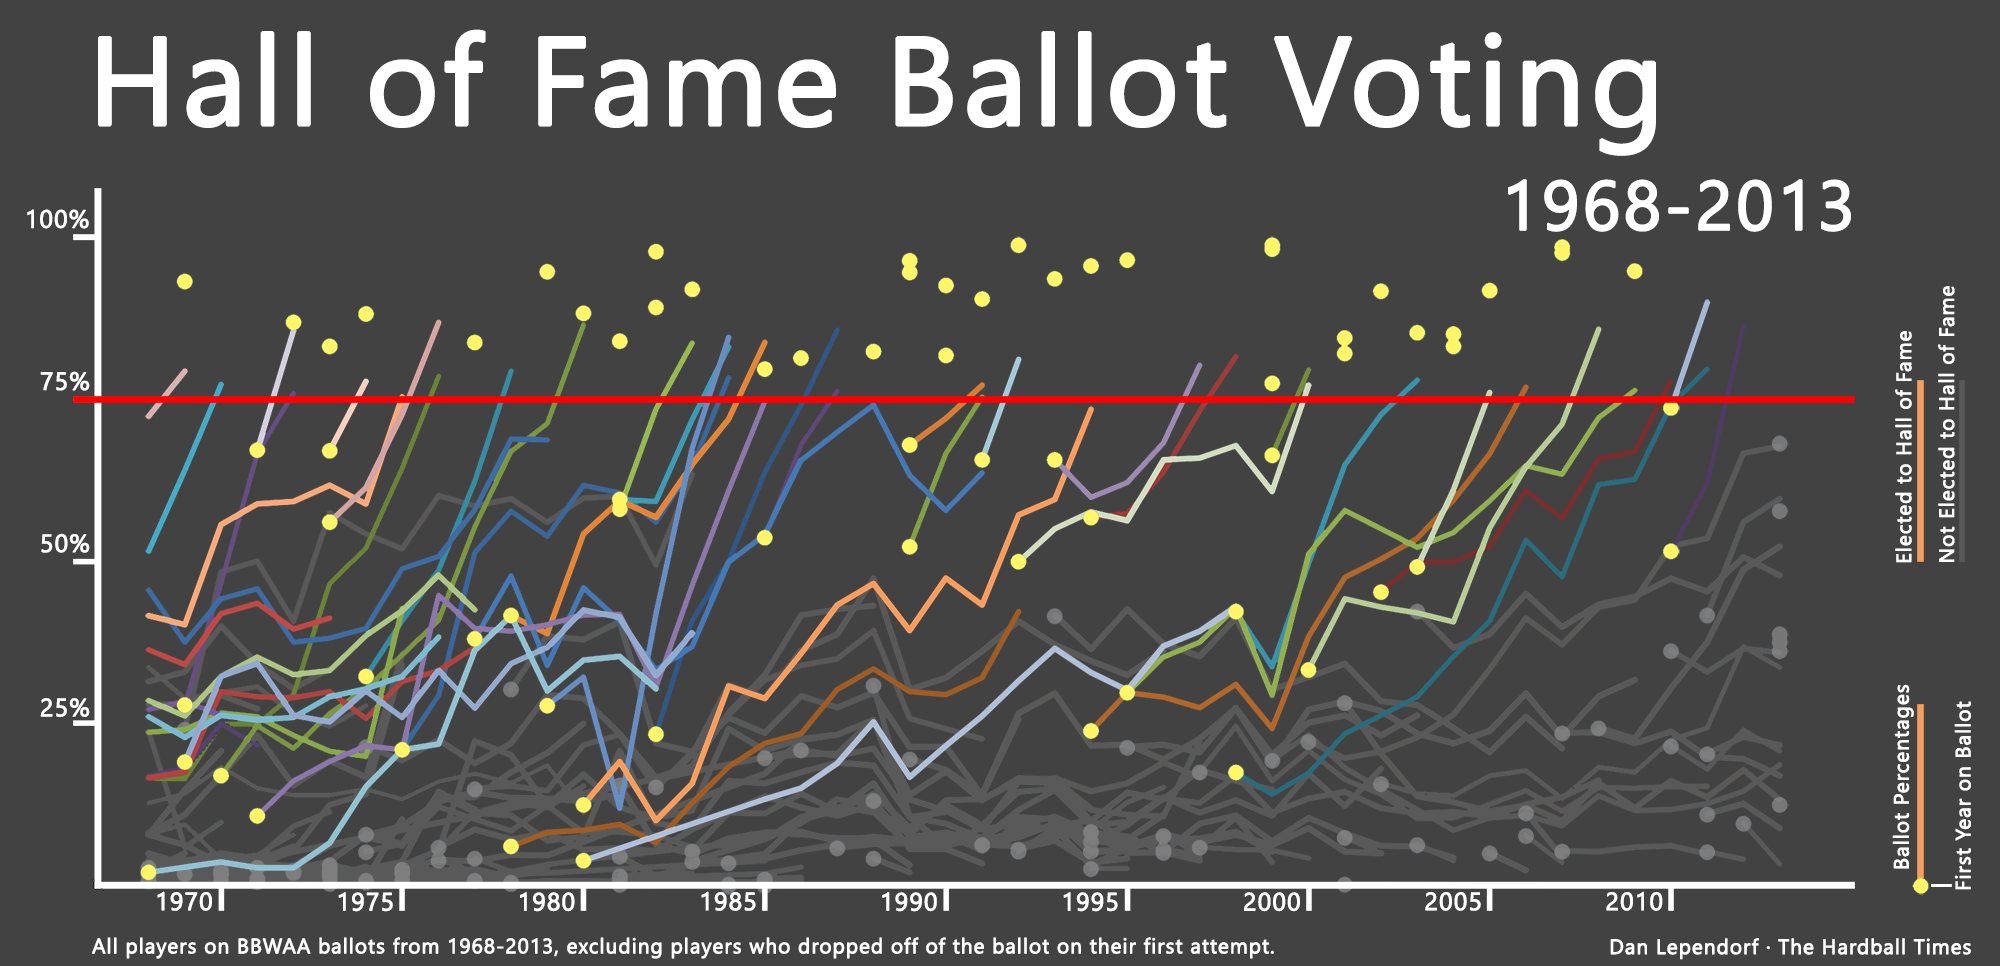
With Hall of Fame voting shoved back into the closet for another 11 months, I find it’s always useful to step back and try to get a sense of relativity and context for the 2013 set of Hall of Fame ballots still fresh in our minds. In that spirit, I’ve put together a graphic charting BBWAA voting over the last half-century. Click to enlarge.
Each line corresponds to a player who appeared on at least two BBWAA ballots, or in other words, every player who made it through the five percent threshold in his first year on the ballot. The yellow dots represent every player’s first year on the ballot, which makes the scattering of yellow dots above the 75 percent election threshold correspond to first ballot Hall of Famers. Voting was tracked from 1968, which is the last time the Hall of Fame voting rules were significantly revised. Colored lines refer to players who were eventually elected to the Hall, either by BBWAA ballots or the Veteran’s Committee (which explains the small handful of colored lines which end before touching the 75 percent threshold). Gray faded lines and dots refer to those who were not elected. This includes players still on the ballot.
I have a database full of ballot results and career WAR marks, and I’d like to turn this one over to the comment section down below. What correlations, relationships, patterns, or miscellaneous Hall trivia would you like to see? I’ll try to answer the simpler requests in the comment section, while the bigger, more involved ideas may end up being part of an article down the road.
This is very cool. It appears there are three types of players elected to the hall:
1. First year ballots
2. Shortly after First year (1-2 years later)
3. We needed some time to mull things over
I’d love to see the average WAR by these categories. Are first year entrants the cream of the crop? You’d expect that to show in WAR. Secondarily, my guess tells me that the difference in WAR between the second and third category will be insignificant. This will point to other reasons why certain players took longer.
Jeremy, that’s a great idea, and it’s definitely something I’ll toss around more in-depth later on. Anyway, if we break it up into first year guys, 2-3 year guys, and the rest, we get:
First year: 90.3 WAR (n=37)
2-3 years: 64.8 WAR (n=13)
4-15 years: 65.3 WAR (n=20)
(1968-2013 Hall of Famers only, no Veteran’s Committee)
You’re right! No difference (actually, an insignificant INCREASE) between groups 2 and 3.
Dale, thanks for the link. That is awesome.
Yes, this is interesting stuff, especially as one who attends the induction every year. First, a pretty small sample size that could be easily skewed, no? Can we infer that the writers got the “low-hanging fruit” (1st ballot) easily enough, but then couldn’t figure out the rest (based on the equivalent WAR avgs. between Groups 2 & 3)? One of the variables here is the circumstances surrounding who is a 1st ballot guy. If, as in 1999, you have some likely 1st ballot guys in most other years, slipping off an otherwise crowded 1st ballot, like Fisk did when Ryan, Yount and Brett dominated the vote. And it would be interesting to see what the WAR avg is for those that stayed on the ballot for at least 10 years yet never made it. Or even a reverse graph for those that didn’t make it, showing the averages for those that stayed on for all 15 years, 10-14, and maybe 5-9 or something like that?
This is very cool, Dan. I particularly like the blue line representing the long, arduous climb of Bert Blyleven’s candidacy.
The orange Gil Hodges line is rather heartbreaking. So, so very close…
Wow. I just saw this the other day: http://cscheid.net/static/mlb-hall-of-fame-voting/
Oops, looks like I confused Gil Hodges’ line with Orlando Cepeda’s…