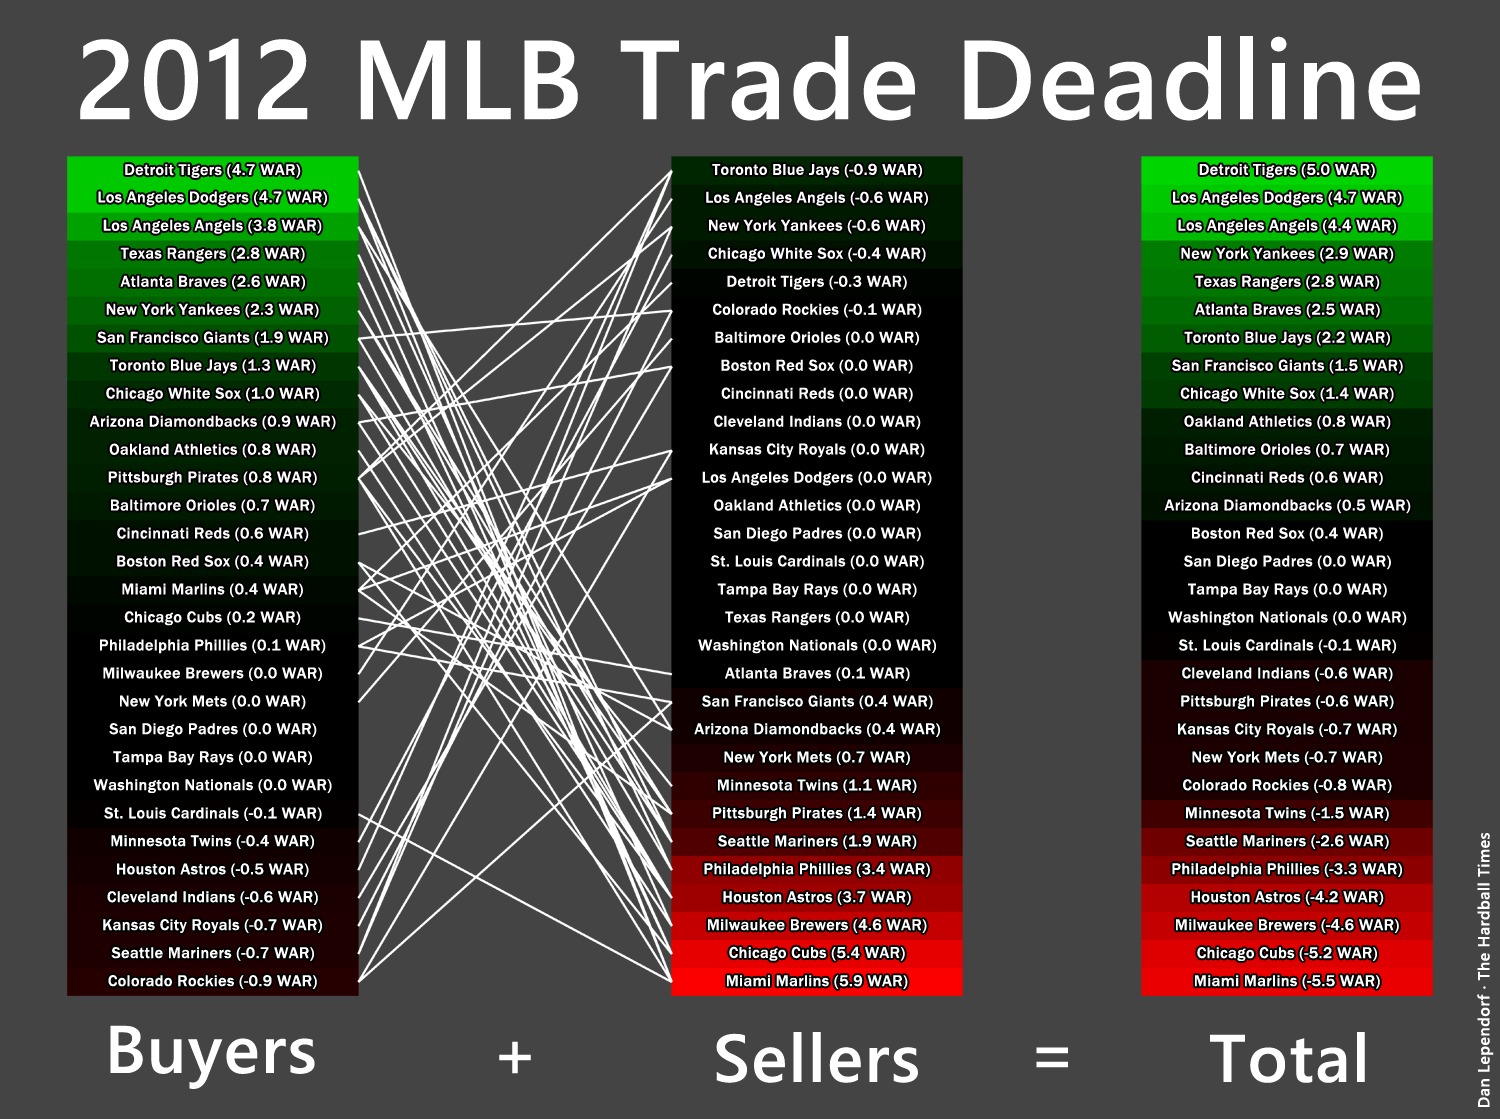
Visualization: The 2012 trade deadline
In the two weeks before this year’s trade deadline on July 31st, 52 major league players were traded to a different team, totaling more than 25 WAR among them. Which teams got the biggest piece of the pie? Who sold off the most?
Click to enlarge.

The first column is a list of every team sorted by the amount of 2012 WAR they added at the deadline from major league players. The second, similarly, is the same list sorted by the 2012 WAR each team traded away. The third column is the difference between the two, representing the net amount of talent each team added or lost.
Each white line in between the first and second columns represents a trade package of major league players traveling to a team in the Buyers column, from a team in the Sellers column. Most trades are indicated by two lines—one for the player or players traveling one direction, and a second line for the players going the other way. But for example, the trade where the Cubs sent Ryan Dempster to the Rangers for two minor leaguers only nets one line—one for Dempster traveling from Chicago to Texas, but none in the other direction, since no major leaguers are going from Texas to Chicago.
The colored backgrounds for each team are mapped to the amount of WAR gained or lost. Pure green is +6 WAR, pure red is -6 WAR, and black is zero. For the purposes of this visualization, I counted every transaction that dates back to two weeks before the July 31st trade deadline.
References & Resources
All WAR figures from Fangraphs.
MikeS,
You’re right on Youkilis. He was traded on June 24th, which was over a month before the deadline. I had to make an arbitrary “this is what I’ll call a deadline deal, while these are not” cutoff date, and his trade missed the cut.
As for Liriano, yikes, apparently Baseball-Reference missed that transaction. I’ll update the graphic some time tonight. The White Sox should get quite a healthy bump.
Also, I counted all of the WAR the players accrued from the beginning of the season to the day of the trade, nothing more. I was looking to peer into trade intent, instead of trade results.
I guess you have to pick an arbitrary time frame of some kind but I was surprised to see the White Sox look so inconsequential so I did a little quick research.
The White Sox picked up Youkilis, Liriano and Myers. These three had a collective WAR of 1.0 before they were traded (almost all tied up in Liriano’s 1.1), but have earned 1.1 in the short time on the south side.
Of the six players they gave up, four have major league experience – Lillibridge, Stewart, Hernandez, Escobar. Those four totaled -1.2 WAR for the White Sox and only Lillibridge has played in the majors since, earning -0.2 WAR for the Red Sox before being released. That is a much better way of demonstrating how they have turned a bunch of nothing into some meaningful contributions. If much of that activity occurred well before the deadline, so much the better for getting useful players for a long period of time.
Buyers with negative WAR. Did they get MiL players so the chart doesn’t actually show their intent? Do they evaluate players differently and disagree with the WAR results?