Where the (Ballpark) Weather Comes From
Not all teams have anemometers inside their ballparks. (via Alan Sim & Michelle Jay)
In February, I decided to build a Retrosheet database to help analyze some data on the Colorado Rockies. I was a bit surprised, at first, to see there was temperature, wind speed and wind direction data in the data set. I say “at first,” because I realized that often when I’ve seen a box score on the internet or in a newspaper, it usually includes those weather details in the same section as the official attendance. Since weather gets wacky in Colorado, especially in April and May, I thought that would be a neat topic.
A few weeks after building the database, I was at the SABR Analytics conference in Phoenix and found I had a problem. A conversation with Mitchel Lichtman, co-author of The Book: Playing the Percentages, turned toward the Rockies, then toward the ideas I had for weather research. He said I should check the data because they might be unreliable. He had heard the weather readings might not even be taken from the stadium itself.
So research into the validity of the data began. In the Retrosheet database, box score weather has been recorded in 10-30 percent of the games from 1950 to 1987. In 1988, there were attempts to report it more regularly, with individual years like 1992 reporting a temperature for each game. However, even as recently as 1994, 24.7 percent of major league games didn’t have weather data. In 1996, only six percent of the games didn’t have temperature, and since 1998, only a Toronto Blue Jays game on April 13, 1999 is missing a box score temperature.
I reached out to Mark Pankin from Retrosheet, and he confirmed Retrosheet weather data are taken from the official box score weather. I knew Baseball-Reference also had weather data in its game logs and invaluable Play Index tool, so I reached out to site founder Sean Forman to see if he had some insight, but he also was unaware of where the box score weather readings were taken.
Undaunted, I then contacted the Rockies, who helpfully directed me to the official scorers for the games at Coors Field. They pointed out what looked to me like a weather vane at the top of the center field bleachers and said it had been put there “at least five years ago” by a company called WeatherBug.


I also learned that the weather as reported on the Coors Field scoreboard is actually from Denver International Airport, which is outside the Denver “valley” over 20 miles away. Now I know the scoreboard temperature shown in Coors Field isn’t taken at Coors Field…but the box score weather might still be good.
I reached out to WeatherBug, which is now known as Earth Networks and got details. Before the 2007 season, MLB and Weatherbug were able to install weather instruments, known as anemometers, in or near every ballpark. Besides temperature, wind speed and direction, the anemometers also take readings on humidity, dew point, and a number of other weather-related factors.
Of the 30 teams, 25 had the anemometers installed within the park. The five parks that did not are Wrigley Field, (Chicago Cubs), Guaranteed Rate Field (Chicago White Sox), Citi Field (New York Mets), Citizens Bank Park (Philadelphia Phillies) and AT&T Park (San Francisco Giants). As of now, SunTrust Park, the new home of the Atlanta Braves, does not have readings taken there, though the data were captured at their old home of Turner Field. Below is a list of where the reading is taken from for each team.
| Team | State | Location |
|---|---|---|
| A’s | CA | O.co Coliseum |
| Angels | CA | Angel Stadium of Anaheim |
| Astros | TX | Minute Maid Park |
| Blue Jays | ON | Rogers Centre |
| Braves | GA | TBD |
| Brewers | WI | Miller Park |
| Cardinals | MO | Busch Stadium |
| Cubs | IL | The Cubby Bear |
| D-Backs | AZ | Chase Field |
| Dodgers | CA | Dodger Stadium |
| Giants | CA | Potrero Hill |
| Indians | OH | Progressive Field |
| Mariners | WA | KING5 at SAFECO Field |
| Marlins | FL | Marlins Park |
| Mets | NY | IS 61 Leonardo da Vinci |
| Nats | DC | Nationals Park |
| Orioles | MD | Oriole Park at Camden Yards |
| Padres | CA | PETCO Park |
| Phillies | PA | Lincoln Financial Field |
| Pirates | PA | PNC Park |
| Rangers | TX | Globe Life Park in Arlington |
| Rays | FL | Tropicana Field |
| Red Sox | MA | Fenway Park |
| Reds | OH | Great American Ball Park |
| Rockies | CO | Coors Field |
| Royals | MO | Kauffman Stadium |
| Tigers | MI | Comerica Park |
| Twins | MN | Target Field |
| White Sox | IL | St. Jerome School |
| Yankees | NY | Yankee Stadium |
I’ll admit I got a chuckle out of the fact the Cubs official box score weather comes from atop a tavern while the White Sox get their weather from the roof of a school. The Phillies get their weather from the Eagles football stadium across the street, while the Giants and Mets get their weather readings about two miles away with a number of buildings in between that might affect temperature or wind readings.
Overall, the data for 24 of the stadiums since 2007 are reliable, and Turner Field is valid for 2007-2016, in terms of readings being taken using the same instruments installed and maintained by the same company. Prior to 2007, how the data recorded varies on a park-by-park basis. Most stadiums used airports or nearby military bases since they have precise weather stations that frequently update out of necessity. Just like the Coors Field scoreboard, these weather stations are often used as the “official” city weather in national weather forecasts, including television and radio broadcasts even if they are located far from the metropolitan area of the city.
Even for one team in one ballpark, though, the weather station can change. The Rockies’ inaugural season at Mile High Stadium in 1993 was played before Denver International Airport opened, so the weather in its box scores would have been taken from a different weather station than the subsequent 1994 season. Similarly, I have to assume the weather sources for other ballparks also have changed multiple times since box scores started reporting weather. Prior to 2007, the box score weather data may be unreliable from year to year without knowing what weather station was used for specific time periods.
However, the temperature information in box scores since 2007 should be pretty similar to the conditions in the ballpark even if the anemometer is not located within the ballpark. Wind information is much more problematic, even if readings are taken from inside the ballpark. As shown by Andrew Perpetua in a previous article at The Hardball Times, modelling weather, wind speed and direction taken on the roof of a ballpark may be dissimilar to how the wind speed and direction play out on the field. Furthermore, wind can change with different ballpark features, and may not be constant over time, as physicist David Kagan has pointed out previously here at THT as well.
Keep in mind that the box score weather is taken at the start of the game, so what the weather is like when the sun sets or by seasonality can vary. It’s also possible a game that starts with calm winds can gust later in the game. According to Earth Networks, hourly data with a six-month history is available, with more information possible, by special request. However, even if it was possible to obtain weather by the minute, it would be difficult to sync up the exact conditions to the exact split second a batted ball occurred. The box score data are usable to an extent, but a lot of caveats can apply.
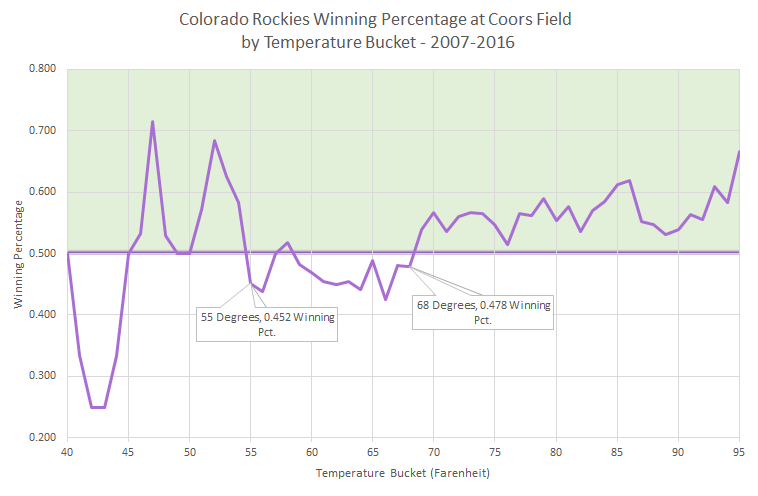
Still, the data can suggest some insights and avenues for future research. Since Retrosheet data is available down to the individual batted-ball event, it is possible to look at frequencies of hit type, walk and strikeout rate by game-time temperature, and one can make some looser assumptions on wind data. As an example, in an article I wrote for Purple Row, I found the Colorado Rockies have a higher winning percentage at Coors Field when the game-time temperature is between 45 and 54 degrees and greater than 69 degrees, but tend to lose in between those conditions.
I also saw that the Rockies tend to get a more extreme benefit from the warmer temperatures in terms of run scoring than their opponents at Coors Field, outscoring their opponents by about a run per game once the game-time temperature gets above 80 degrees. Still more research needs to be done on why that’s the case, but box score weather can give an indication of new areas to explore.

This is just a sampling of some of the ways the data can be analyzed. The box score weather data also is outputted online through MLB’s At Bat application and anywhere that tracks real-time box scores. This led to a fun game on the recent Rockies home stand, which featured a variety of weather conditions. Once the temperature was announced, I’d guess on who was likely to win and how many runs would be scored. Weather being as finicky as it is, it’s definitely a leap of faith to make guesses on an individual game’s outcome, but it’s been a fun one to take.
I hope that as more people probe the data now that they have a better idea of its validity, and hope it will open more avenues of research. Meanwhile, remember that for most ballparks, the game-time box score weather might be more accurate than what’s actually on the scoreboard.
This article reminds me of a story of game 4 in Detroit during the 1968 World Series. During a lengthy rain delay,
the comment was made that it wasn’t raining at the airport. One of the umpires, I believe Stan Landes, supposedly said “Great. Let’s play the game at the airport”.
Great article on an aspect of baseball I’ve always been curious about. Would like to see stadium architectural details added to the weather data: it’s clear that the configuration of the outfield stands can somehow affect the direction of the wind. Or can it? I’ve watched many games in which the way the pennants on the scoreboard/roof, etc., are blowing tells you nothing about how fly balls are going to play on the field.
I interviewed a meteorologist while working on some of the Purple Row weather related pieces and he said the flags blowing _near_ the anemometers might also affect the weather readings.
As Andrew’s article showed, how things operate can change quite a bit between where the flags fly and field level.
I think this is great stuff, and an important step needed for sabermetrics. Personally, I think park factors should take temperature into account. I think some places (California cities, for example) might see a relatively large difference in the way their parks play on warm afternoons versus cool evenings.
It’s worth noting that the way temperature affects baseball is (primarily) through changes in air density. Density is directly proportional to temperature, and lift and drag are directly proportional to density. So, the amount of movement on a pitch and the distance a fly ball travels are both affected by air temperature.
It looks like Earth Networks captures dew point though it’s not reported in the box scores. Some have suggested that would be useful for looking at air density.
Dew point (actually, the absolute humidity ratio or the fraction of water vapor in air) has a small effect on density. To really understand it, you need to apply the ideal gas law: p*V = n*R*T . For baseball purposes, a more useful form involves density (rho): p = rho*(R/M)*T . In this equation, p is pressure, R is ideal gas constant, M is the average molecular weight of the mixture, and T is the absolute temperature. Humidity comes in by changing the average molecular weight. A water vapor molecule (H2O) weighs less than an air molecule (~78% N2 and ~22% O2), so humid air has a lower average molecular weight and hence a lower density for the same temperature and pressure. However, this effect is relatively small compared to density changes due to temperature and pressure.
Great research. If you download the Little League Weatherbug app, when you search for a city, you can pick a weather station, so you can check the weather at Coors Field. I’d love to see weather tracked more granularly, at least the start of each inning.
fotballdrakt
I don’t know whether it’s just me or if perhaps
everybody else experiencing problems with your site.
It looks like some of the written text within your posts are
running off the screen. Can someone else please provide feedback and
let me know if this is happening to them as well? This may be a issue with my web browser because I’ve had this happen previously.
Thank you
Your store really should have much the same appearance for
a listings to increase brand awareness and generate
familiarity which instils confidence. Coffee shops are big business, and, therefore,
one using a big footprint. Get outside and initiate performing – on the
streets or even the shop corners – any where.
The 6-pack abs and discipline appear pertaining to being paying
with a towel. And finally, Rockport is famous for their
festivals. Back then everything was labeled a “disease”.) But,
it is simply by just a complaint that.
My point of view is a person should absolutely take bath in the mornings also as well as during the night a little!
showers|showers I’m 19 currently and I still
obtain them, though not as frequently as I made use of to.
During my sleep fears it’s as if I’m awake in my room
since every little thing typically looks the exact same except I feel like I’m
paralyzed and also I could see some shadowy number
or feeling a person in my space.
This opulent fabric contributes to a standard style, beauty, elegance and sophistication.
Some do get to the waist but others are longer,
extending as a result of touch the hips, mid-thigh or knees.
Selecting a short sleeved silk blouse when what you need is always
to look vampish, or just like a hippy or gypsy certainly won’t work.
I was wondering if you ever considered changing the page layout of
your blog? Its very well written; I love what youve got to say.
But maybe you could a little more in the way of content so people could connect with it better.
Youve got an awful lot of text for only having 1 or 2 pictures.
Maybe you could space it out better?
Thank you for some other fantastic article. Where
else may just anyone get that kind of info in such an ideal approach of writing?
I have a presentation subsequent week, and I’m
on the search for such info.