Beyond DIPS
The theory of Defense Independent Pitching Statistics can be traced to this famous line by Voros McCracken in Baseball Prospectus 2001:
There is little if any difference among major-league pitchers in their ability to prevent hits on balls hit in the field of play.
This was backed up by year-to-year correlation testing as well as a healthy dose a common sense. Voros then proceeded to classify each event (walk, hit, strikeout, etc.) by whether or not it was influenced by defense. The Three True Outcomes (strikeouts, walks, home runs… and hit batsmen) were considered defense independent, while anything to do with hits were not.
Years later, after much recycling of Voros’ ideas and formulas, the basic theory of DIPS remains. From Tom Tango’s FIP, which only uses the Three True Outcomes and is so simple you can literally calculate it on the back of a napkin, to slightly more complicated formulas like Graham MacAree’s tRA (which uses batted ball numbers) and David Gassko’s Pitching Runs Created, only stats which are deemed independent of defense are considered.
However, DIPS, and all of its decedents, are only designed to model how many runs a pitcher would have given up if defense (and timing) were taken out of the equation. They are not meant to isolate the pitcher’s performance, only to eliminate the defensive performance. In my opinion, this a concept that is often overlooked by many-a-good analysts and dedicated sabermetric disciples out there.
To assume that the only stats that are out of a pitcher’s control are his hit rate on balls in play, otherwise known as BABIP, and the timing of his events is a mistake. Consider all of the factors that go into each pitch that are completely out of a pitcher’s control:
- The batter
- The umpire
- The defense
- The environment (ballpark, wind, etc)
In fact, the only thing a pitcher has complete control of is the inherent attributes of the pitch as it reaches the plate (and even then there are environmental factors to consider). For a long time, we’ve assumed that strikeouts, walks, batted ball numbers, etc. are very much in a pitcher’s control. When you think about that, it is a ludicrous assumption. The batter has at least equal control over the outcome of each pitch as the pitcher does, and the presence of the umpire makes it likely that the pitcher has less than 50 percent control over the outcome of each pitch.
With Pitch f/x data available now for over 1.5 million pitches in the majors since 2007, we can begin to investigate the degree of control that pitchers have over the outcomes of each pitch. My recent research on Jarrod Washburn and A.J. Burnett, suggests, in my opinion, that pitchers have far less control over even their defense-independent stats than we have thought. However, those studies were far from conclusive. Today, I hope to bring a bigger hammer to the table to try to prove my thesis.
OK, it’s more of an allen wrench
First, let’s consider all pitches with the following characteristics:
- From a RHP to a RHH
- Between 91 and 93 MPH
- Between -3 and -7 inches of horizontal spin deflection (movement)
- Between 8 and 12 inches of vertical spin deflection (movement)
- On a 2-1 count
- With the previous pitch type being another fastball
- With nobody on base

Since 2007, there have been 536 such pitches thrown in the major leagues that were captured by the Pitch f/x cameras. If you’ve read Josk Kalk’s two part series on the “Anatomy of a league average pitcher” (and if you haven’t, go read it now!), you’ll notice that this is a pretty generic pitch type in terms of it’s attributes (velocity and spin deflection) and it’s environment (count, batter/pitcher hand, baserunners).
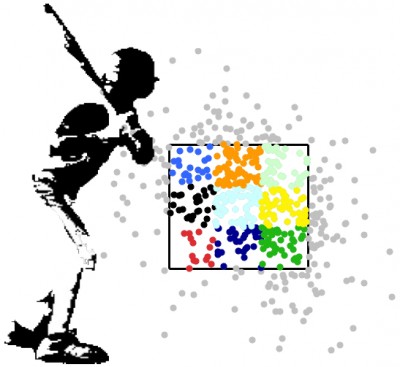
Now let’s break those pitches down by their location in the strikezone. To do that, I first adjusted the vertical height of each pitch in the sample by the top and bottom strikezone estimates for each batter provided by the Gameday operators. I then split the strike zone into nine equal parts. As you can see on the right, while each of the zones are bigger than one might like, they are, at the very least, distinct.
Most importantly, using those zones allows for a comparison of pitches that are pretty homogeneous. They each have similar velocity, movement, environment, and location. There are obviously slight differences, but nothing too significant. Given that, you’d expect the outcomes of each of those pitches to be pretty static if pitchers really had a significant amount of control over the outcomes of each pitch. In other words, you’d expect little variation in what actually happens after the pitch leaves the pitcher’s hand. But is that really the case?
If you take a look at the pitches down and center, the dark blue ones on the batter graph, there were 34 pitches thrown. Three of them were balls, five of them were called strikes, none were swinging strikes, 10 were foul balls, zero were singles, three were doubles, zero were triples, three were home runs and 10 were in play outs. That’s a lot of variation. Just based on random chance, the pitch could either be, say, put in play for an out, or hit for a home run. The difference in value between those two plays is HUGE. Using John Walsh’s Run Values (helpfully cataloged here by THT’s own Harry Pavlidis), the difference between a home run and an out on a 2-1 count is 1.68 runs.
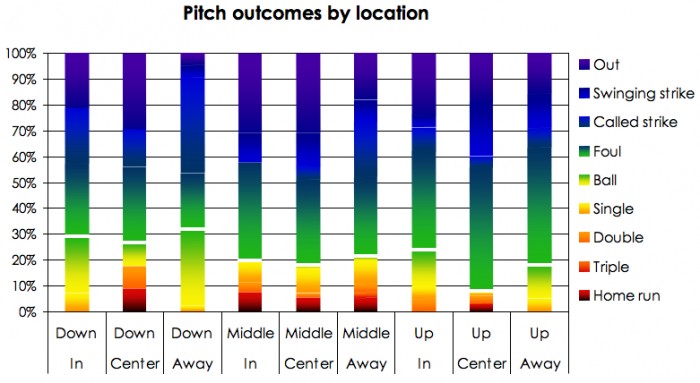
Of course, I cherry picked the one location vector with the most variance, but most of the other ones have a similar amount of variance. If you click that link, you can see the distribution of pitch outcomes based on location. The little white bars represent when the run value of the outcome becomes negative (good for the pitcher). If you check out the distribution of run values by location vector, the picture is pretty amazing:
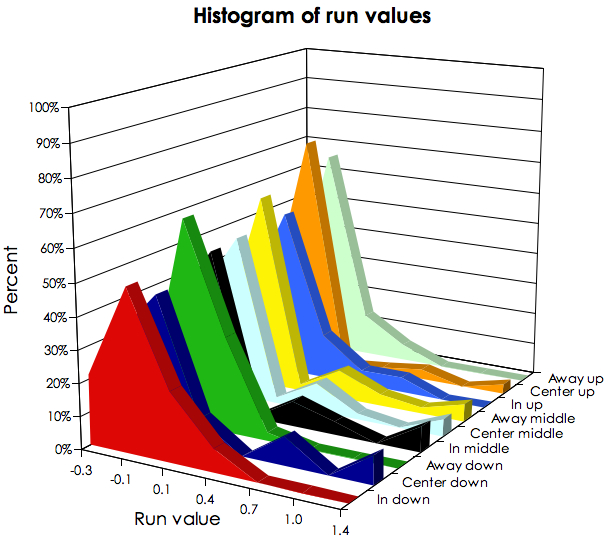
As you can see, while the distributions all peak around -.1 run value, in almost all cases, there is a significant chance that the outcome of the pitch ends up being much worse, or better, than that for the pitcher. The only location vector with a decent amount of parity is the one for away and down (green). In more than 90 percent of the time, in this subset of pitches, the outcome is either a ball or a non-in play strike.
The problem with the above example is that I’m dealing with a very small subset of pitches, only 40-50 in each location vector. Common sense suggests that the outliers will even out over a large sample size, and similar pitches will have similar outcomes for the most part. However, that’s something we simply can’t investigate further at this point due to the sample size restrictions in creating homogeneous pitch types.
Another thing we can look at is called balls and strikes by the umpire. Josh Kalk, John Walsh and Jonothan Hale have already examined how accurate umpires are in great detail, and found that while they were generally very good, they did make their share of errors. Earlier this year, I took a look at how those errors were distributed over individual pitches, and found that there was a lot variance.
So what now?
This study is hardly conclusive, but I think that, along with my previous two articles on Washburn and Burnett, it does show that pitchers have a lot less control over the outcomes of pitches than previously believed. Even stats that aren’t affected by defense at all are heavily affected by other factors, such as the batter and umpire. The next frontier of pitching stats, in my opinion, should be exploring ways to isolate the performance of pitchers from that of those other factors. As of now, the only way I can think of doing that is by using Pitch f/x data, and to look at the inherent qualities of each pitch and not care about the actual outcome. While any kind of comprehensive Pitch f/x pitching metric is far from being ready, I’d like to explore some possible ways in which one could be created.
Binning
This involves identifying the key characteristics of each pitch, and creating a number of unique combination of such pitches. For example, you could look at all pitches thrown from a RHP to a RHH in a certain count with a given range of velocity, spin deflection and location coordinates, and figure out the average run value of such pitches. Repeat that for every combination of pitch attributes there are. This is similar to the methodology behind UZR, and is a very “clean” process. With enough data, this, in my opinion, would be an excellent way to develop a Pitch f/x based pitching metric.
The problem is that we simply don’t have enough data right now. There are simply too many combination’s of pitch attributes (count, batter hand, pitcher hand, speed, movement, location, previous pitch type) to get reliable samples for most of the bins. That leads to wacky things like, with all else being equal, a 91-93 MPH fastball being more effective than a 93-95 MPH fastball. Obviously that can’t be true, and it serves to show that we simply don’t have enough data to do comprehensive binning.
Regression
This is a good method to use if you have sample size issues in some bins – which we do. Regression looks at the overall estimated relationship of datapoints, rather than each individual set of points. Regression usually does a pretty good job of neutralizing sample size oddities. Some very good work on regression and run values has been done Jeremy Greenhouse and Chris Moore at Baseball Analysts.
Jeremy used what’s known as a LOESS regression to estimate the expected run value of a given pitch given its velocity and movement. This is a very powerful technique, but it has its flaws as well. For one, the variables in Pitch f/x are often so random, following no discernible pattern, that a regression technique might not be able to give enough of a range in value. Furthermore, LOESS does not produce a closed form equation, making it very hard to apply to all pitchers. And like with the binning method, sample size oddities can skew the results of given pitch types – especially for lefty-on-lefty matchups, pitchers with strange release points and less populated counts. I’m not sure if LOESS is strong enough to compensate for all of that, but my inclination is that it is not.
Other problems
Even if we had enough data for the binning method or enough flexibility for the regression method, there would still be massive problems in creating a Pitch f/x based pitching metric. For one, those methods would simply estimate the value of each pitch, not of the eventual outcome of each at-bat. Obviously, the way in which pitches are sequenced together has a huge effect on the eventual outcome of at-bats, and to treat each pitch as its own separate and independent entity would be a mistake. Furthermore, there are aspects of pitching that aren’t quantified by Pitch f/x data. Deception, which involves a player’s windup, his time to the plate, his glove, etc. are not going to be captured by a Pitch f/x based metric, and potentially have a big impact on the expected value of a pitch.
Conclusion
I feel as though this article has raised more questions that it has answered. If you accept my thesis that pitchers only have limited control over what happens after the pitch leaves their hand and the experiments that I set up to prove that, you should accept that one of the biggest potential advancements in sabermetrics will be a Pitch f/x based pitching stat. The question is whether or not we will have to capacity to develop such a stat, and whether or not the additions over current DIPS metrics (the fact that it won’t rely on outcomes which are influenced by the batter and the umpire) will outweigh the subtractions (will have a tough time handling sequencing of pitches and other pitch attributes that aren’t captured by Pitch f/x).
I feel it will be a worthwhile endeavor for one to go about creating a Pitch f/x based pitching metric, and while I am no closer to creating one than when I started this article, I hope that it will be an important part of new research in 2010.
References & Resources
A great article written by Mike Fast in the beginning of 2009 suggested that pitchers have more control over the outcomes of balls in play than DIPS gave them credit for. He also used Pitch f/x data, but looked primarily at where the balls were put in play. That research doesn’t necessarily contradict my own; however, it’s obviously related, and Mike has a great summary of the DIPS timeline at the bottom of the post.
I’m still thinking of experiments like in the “OK, so it’s more of an allen wrench” section to set up to try to show how much variance is expected in the outcomes of pitches. I’ve been racking my brains for a couple of weeks, but I can’t really think of another way to approach that problem. If anyone has suggestions, feel free to sound off in the comments section or email me, and I’ll try to investigate them.
Something else that I feel I should have mentioned in the article, but don’t really have a place to put it, is that a Pitch f/x based metric could be amazingly useful for rookies or pitchers coming back from injuries. Given that a Pitch f/x based metric would take out almost all of the noise associated with traditional stats, the sample size requirements for predicting future performance would likely be far less than for the current stats out there.
Nick – I think your research is impeccable, and your charts are informative, but I fear that even if you had the amount of Pitch f/x data needed to adequately study this question that your answers wouldn’t be very informative. You are basically asking how well a pitcher throws, not how well he pitches. Pitching is a different skill than just the ability to throw well, although throwing well is a necessary component of pitching well. But pitching well means adapting to the batters you are facing, the home umpire you have drawn and the park that you are pitching in and still having good outcomes from the pitches that you throw. By good outcomes I don’t necessarily mean outs as opposed to hits, but the type of hit balls (speed, vertical angle, and possibly horizontal angle) that should usually result in outs instead of hits. But I do mean actually striking out batters, instead of just throwing pitches that should result in strikeouts which it seems that you are proposing to measure.
There is real skill in what a pitcher does beyond just his ability to throw the ball. I grant you that measuring or describing what exactly that extra skill is will be almost impossible. But we should choose the parameters for measuring pitching skill in a way that doesn’t exclude that extra skill.
“The fact that it won’t rely on outcomes which are influenced by the batter and the umpire”
Essentially, we’d be creating a stat that tries to do what scouts are always supposed to do. Make observations about a player without getting stuck on what his outcomes were. I like it.
Peter – Thanks for the kind words.
I agree with this 100%, and it was something I had meant to mention in the “Other problems” section. I agree that the actual outcomes include other information than just how good the pitch is – a ton of it (all the things you mentioned + sequencing + time to plate) – the question is whether or not you subtract more noise than skill by just looking at the attributes of the pitch.
I don’t really know the answer to that. I’ve been trying to think of an experiment to set up to get the answer, but nothings come to me yet.
Scottwood – yes exactly! It would be like a digitized, unbiased, form of scouting… that just might not pick up as much as a good scout will.
”…the question is whether or not you subtract more noise than skill by just looking at the attributes of the pitch.
I don’t really know the answer to that. I’ve been trying to think of an experiment to set up to get the answer, but nothings come to me yet.”
And I doubt you ever will. It is not always possible to reduce real life events to experimental analysis. And I really don’t like the use of “noise” to describe variations in results. In this case you have variation caused by small sample size, variation caused by factors within the pitcher’s control, and variation caused by factors not within the pitcher’s control. I assume you are using “noise” to describe the latter. Using pitch attributes instead of pitch results does remove that. But the better methodology, I believe is to describe pitch results that maximizes the influence of factors within a pitcher’s control (for some reason I am partial to the metric described here –
http://www.hardballtimes.com/main/article/using-hitf-x-to-measure-skill/) and use the largest sample size possible to adjust minimize variance due to sample size. Using a large sample size should also reduce the variation due to factors outside the pitcher’s control (batter, umpire, and park) because batter and umpire tend to approach the league average with larger samples. If they need to be adjusted further they can be normalized in the same manner that one uses to adjust for home park effects. Doing these adjustments after the fact should minimize variation due to factors outside the pitchers control while avoiding the possibilty of inadvertently eliminating unknown factors within the pitcher’s control.
I agree with everything Peter said, and still think it is possible to quantify the “it” factor.
Where the difficulty (and opportunity) seems to be is understanding how the DATA align with the GAME.
For example, wouldn’t you want to ‘score’ a pitcher lower if his changeup release point is different from his fastball release point? That could be a data-driven aspect of measurement, but how it impacts pitcher quality depends on the actual experience of the game. Many people know that a great changeup throws off a hitter’s timing. The more they think a fastball is coming, the more effective the pitch. But how much is gained or lost on release point alone?
Is that an impossible relationship to quantify? Probably not. However, multiply that example by 50 and that’s what I think it would take to really understand Pitch f/x at anything close to a scout’s eye.
Just read the umpire effectiveness article. Great piece! I’m with those who favor a computerized zone.
I’m also with those who want the human umpire. Why not put a green light/red light indicator inside their mask? They’d be only ones to see it, and wouldn’t in any way replace them just free them up. Calls could be made just as quickly…by a human.
I think the home plate ump has far too much impact on the teams competing. If he was “given” balls and strikes, he’d still need to monitor balks, batter position, call check swings, hit batters, and so on. He’d still have more to observe than any other ump on the field.
Would help remove one variable from your Pitch f/x analysis too!
So Peter, do you think something like Harry Pavlidis’ xRV100’s, adjusted for batter, umpire and ballpark would best thing that could currently be implemented?
Jimbo – I agree that it would take a lot more working with Pitch f/x to really understand how the matchups work, but I do think we are getting closer – slowly but surely. Also, I like the fact that umpires make errors – it makes analyzing Pitch f/x more fun!
Nick – I don’t think it provides much useful information assign run values to individual pitches based on their characteristics. It can be fun, but I don’t think it adds anything to our knowledge of a pitcher’s skill. The only thing that counts about a pitches is how well hitters can hit them so looking at them in the aggregate is best. I am writing an article that I will submit to THT soon about this.
“However, DIPS, and all of its decedents…”
I hate to be the language police, or have a lot of pitching metrics died recently?
That should be descendants.
Peter – Harry’s xRV100 are like DIPS for each individual pitch. They assign a run value to each pitch based on it’s count, and the outcome of the pitch (except that xRV100’s, unlike normal RV100’s substitute batted ball linear weights for actual outcome linear weights). I personally think that is a nice middle ground between only using at bat outcomes, and not using any outcomes at all.
I’ll have to test out how RV100’s and xRV100’s predict future ERA compared to stats like FIP or tRA.
(except that xRV100’s, unlike normal RV100’s substitute batted ball linear weights for actual outcome linear weights).
I thought that was RV100E and that he only used the League Average Batted Ball linear weights for flies and liners. Is xRV100 something different or is it a new name for RV100E?
Yes, xRV100 is referring to RV100E, my mistake.
“I don’t understand why MGL and Peter are so hung up on the art of pitching and how pitchf/x doesn’t capture this…”
Jeremy – If that is the impression that you got from carefully reading my comments I am disappointed that I have not been able to communicate my position better.
First, I am quite happy with Pitch f/x as it is. It is a wonderful innovation and provides us with valuable data that we did not have before and could not obtain in any other way. There have been many exciting and valuable studies done using this data.
Second, my reservation about Nick’s article is that he is not using “bits and pieces of pitchf/x data to capture bits and pieces of pitching ability.”, but is actually discarding valuable information about a pitcher’s ability. Sometimes assigning average values for specific values in a metric gives that metric more predictive power. That is reasoning behind linear weights rather than Run Value Added (RE24), or league average HR/FB rather than pitcher specific HR/FB when doing player projections. Using RV100E to value individual pitches and summing them to get a measure of a pitcher’s value is going to give you a pitcher’s xFIP (in total runs above average rather than an estimate of earned runs per game), since it is just reversing the process that calculated RV100E, so it adds exactly 0 to our existing knowledge of pitching ability.
MGL and Peter, thanks for clarifying.
MGL, that is what I meant by smoothing. I guess if the zones are large enough, smoothing doesn’t matter.
Nick, with the granularity of the pitchf/x data, of course we want to smooth it out. That’s all I’m trying to do with local regression. It takes all those bins you’re talking about, and tries to make sense of them.
Peter, I apologize. I think I misrepresented you. I see what you’re saying about rv100E = xFIP. Knowing the rv100E/xFIP for the average 98 MPH fastball or curveball with 10 inches of drop I find interesting. And we could use that to add to our knowledge of pitching ability by coming up with xrv100E. What I mean is instead of adding the actual value of each pitch, which just gets us back to xFIP, if we find the expected value of each pitch based on the characteristics, and assign that to the pitch, then we are isolating the pitcher from the results and coming up with something informative. Anyway, that’s what Chris Moore and I have tried to do.
All batted ball results in rv100E are based on league averages
We’ve discussed this before, but the problem with focusing on the characteristics of the pitch rather than the outcome, to determine the value of each pitch, and hence, all pitches, for any particular pitcher is this:
1) That leaves out “deception.” Apparently, for example, an 87 mph fastball from Sid Fernandez was a lot more effective than the same 87 mph fastball thrown by a generic pitcher, presumably because El Sids’ delivery was so funky and he hid the ball so well.
2) The percentage of each type of pitch thrown (in that particular situation) HUGELY influences the value of that pitch, independent of that pitch’s characteristics, including the count, previous pitches thrown, etc.
For example, a 93 mph fastball on a 2-0 count with the bases empty in the 6th inning of a 0-0 game, with X and Y movement in both axes, from pitcher A who throws a fastball 90% of the time in that situation, and from Pitcher B who throws a fastball (the same fastball) 40% of the time in that situation, are going to have COMPLETELY different values!
I am afraid those things are going to preclude you from doing what you suggest – that is to use the characteristics of a pitch and the game situation (including the count, previous pitches, etc.) to determine the value of a pitch rather than its actual value – unless of course you can somehow incorporate the two things above into your “pitch value” model, which would be difficult.
Now, using generic pitch values (based on count, previous pitches, and pitch characteristics) can effectively be used as “means” to regress towards, as you mention in your article. That is probably the next big breakthrough in pitcher evaluation.
I mentioned deception in the original article MGL:
And I agree that the game theory aspect, and “pitching to the batter and umpire” things that Peter brought up, are also going to potentially have a huge impact on the value of individual pitches.
The question, which I mentioned earlier, is, if we were to develop a decent pitch attribute based metric, whether or not the subtraction of “noise” (things that are outside of the pitchers control, like random variation from umpires and batters) outweighs the subtraction of skill (like the aspects of sequencing, game theory, deception, etc.)
I don’t have the answer to that question yet, and although I’d normally defer to your expertise on most baseball related matters, I don’t think you have the answer to it either.
You and Peter both seem to think that a pitch attributes based metric will take out more skill than noise, but I’m not as sure as you are – in fact, I’m inclined to believe the opposite (that’s purely conjectural, but so is your viewpoint I think ).
).
I do think that we need to look at some more controlled experiments (like the one I highlighted in the OP); however, with even more parameters to insure maximum homogeneity. I’m not sure there is enough data to set up such an experiment though…
I don’t understand why MGL and Peter are so hung up on the art of pitching and how pitchf/x doesn’t capture this and that. Pitchf/x is what it is, and nothing is going to give you a perfect metric, but that shouldn’t stop anyone from trying to use bits and pieces of pitchf/x data to capture bits and pieces of pitching ability. Not everything has to be all-encompassing ERA. We can have strikeout rate and walk rate and fastball velocity and pitch type run values and all that stuff to paint a broader picture.
Nick, I don’t follow your argument against regression whatsoever. I would hope the methodology behind UZR incorporates some smoothing. MGL, can you verify this is the case?
Nice article Nick.
Somehow I think of this when finding the perfect pitching machine:nanomchines.
Jeremy, if you mean “smoothing” with respect to the batted ball values and the “catch rates” for the various zones, the answer is, “no.” I could have used some kind of “smoothing” function or whatever you want to call it, and that would have been better, and would have allowed me to use more “zones” or no zones at all (if I created a function for the catch rates and batted ball values based on the x/y coordinates of each type of batted ball), but for various reasons I did not. I used fairly large zones such that smoothing was not really necessary.
Again, I am not sure if that is what you are talking about.
For those of that don’t know that I am taking about:
Let’s say that there are 3 zones that are increasingly further away from the normal position where a fielder plays. And let’s say that the “catch rates” in each of those zones are .5 .3 and .4. Well, we can assume that the catch rate for the second zone should really be higher than that of the third zone, because it is closer to where the fielder usually plays, and that the reason the catch rates seem out of order is merely because of sample error (small sample sizes in one or more of those zones). So you would want to “smooth” those numbers out to reflect the fact that the further away you go from the fielder, the lower the catch rate should be. So, you might re-do those 3 numbers and make them .5, .4, and .3, rather than the observed .5, .3, and .4.
That is what the SAFE system by Shane Jensen does, I think, which is a very good methodology.
Again,I do not do that. I use large enough zones and many years of data such that I (hope at least) that I don’t have too many sample error problems in the individual zones such that I would be much better off “smoothing” out those numbers.
Anyway, I don’t disagree with Jeremy and Nick. And yes, as Nick says, I have no idea whether it would be better or worse to use some kind of “pitch value based on the pitch characteristic” system than the system we use know or a “hybrid” system whereby you use a pitcher’s own pitch outcomes. IOW, here are your alternatives to evaluating a pitcher, with your goal being to find the best way to use past data to predict future “context neutral” outcome (that is essentially the same thing as trying to isolate pitcher skill as much as possible):
1) Pitch F/X, where you use the average run value of each pitch, based on all pitchers, and using that pitch’s characteristics as well as as many game situations as possible (count, previous pitch, etc.)
2) Only use the actual outcome, in run value, of each pitch.
3) Use the actual outcome of each BF (PA).
4) Use a DIPS-type of a system.
As to how to order these, in terms of best to worst, I don’t know.
Jeremy – I don’t know nearly as much about LOESS smoothing as you and Dave Allen do. I would appreciate your thoughts about how well it could be used for a Pitch f/x based metric, and if it would be better or worse than the binning method or some other method.
There is actually one “level” deeper that you can go, in terms of trying to isolate luck from skill:
That is the actual location of each pitch as compared to the intended location. For example, let’s say that a pitcher is intending to throw a certain pitch low and away, based on the location of the catcher and/or his mitt, which we can get from watching the video, or from the “super” pitch f/x which includes the location of the target (the catcher and/or his mitt). Now, his actual location is going to be some scatter-plot surrounding that intended location, the width or density of that plot depending upon the pitcher’s “command” of that pitch. On any individual pitch, however, the actual location will be random somewhere in that scatter-plot.
We can actually use the intended location and the expected scatter-plot, where each pitcher would have his own somewhat unique scatter-plot, to determine the value of the pitch, rather than the actual location.
How’s that for really getting rid of the luck in a pitcher’s performance?!