Yaz v. Manny (Part 2—defense counts)
Last time I embarked on a
comparison of Yaz and Manny, with the goal of
determining who was “the second best left fielder in Red Sox history.” Of course, Yaz played 23 years for the Sox, while Manny didn’t quite make it to the end of his eight-year contract.
So Yaz’s contributions as a Red Sox left fielder were undoubtedly greater, I think that’s clear. Less obvious is who was the better overall player,
Yaz or Manny? That’s the question I’m trying to answer with this little study.
Recall that I’m comparing the full of Manny’s career with Yaz’s career
through his age 36 season (that’s 16 seasons for both players). All numbers presented for Yaz are
for the period 1961-1976. Yaz would play another seven seasons before
retiring.
In the first installment I covered
offensive production, i.e., batting plus baserunning. Manny had a significant edge in batting, and
although Yaz was the better baserunner, he didn’t make up much
ground. You have to be near the top of the pack (or the bottom) for
baserunning to have a major impact. Both Yaz and Manny were close to
average on the base paths.
Before going on to defense, which is the subject of this article,
let’s look again at the current situation.
Wins Above Average

                Yaz      Manny
------------------------------
Offense         49.6     60.4
Baserunning     -0.5     -1.9
Range                 ?
Arm                   ?
------------------------------
Total so far    49.1     58.5
But, will Manny’s nine-win advantage hold up after we take defense
into account?
Defensive range
Carl Yastrzemski was considered a defensive wiz—his seven Gold
Gloves are a testament to his defensive ability. Manny Ramirez, on the
other hand, is generally considered a poor fielder. People don’t
always agree on Manny: Some think he’s the worst fielder in baseball,
others just feel he is lousy with the glove. What do the stats say?
Depends on the stats. Those of you who follow sabermetric developments are aware of the vast
amount of effort put into evaluating defense over the last few years.
In general, the various methods get similar results, but sometimes they do not and one approach is to take the average
of several systems.
Yaz presents a problem, however, since the most of these systems rely
on recent data and only evaluate recent players. One exception
(although not
the only one) is TotalZone, which was developed by sabermetrician Sean
Smith and is based on Retrosheet play-by-play data. Sean wrote a
wonderful article for the THT Baseball Annual
2009 (being shipped to serious fans everywhere as I write
these very words) on the best fielders of the last 50 years.
Sean found that Yastrzemski as a left fielder was 81 runs above
average for his career, a very high total. Not only that, but when Yaz played first base, he flashed the leather
there, too, saving an additonal 48 runs as a first-sacker.
Now, since we’re only considering Yaz’s career
through age 36, we need to make an adjustment. Yaz played 86 percent of his
career outfield games and 75 percent of his career first base games in the
period we are analyzing. If we pro-rate the runs saved by these numbers,
we get a total of 106 runs saved compared to an average left fielder.
To translate Yaz’s fielding number into wins I use the generic value
of 10 runs per win, because that is what Sean used for doing his
analysis. This gaves Yaz 10.6 wins for fielding.
Manny’s defense is one of those cases where the different defensive systems do not agree. The following table gives the results for Manny from
various systems, expressed in runs saved per season.
Estimates of Manny's Defense, Runs per Season
TotalZone     -3
UZR          -20
ZoneRating   -20
Dewan +/-    -17
SFR          -10
See the Resources section for more info on these systems (all based on
play-by-play data), if you are interested. I could use a straight average of the
five estimates, which would give -14 runs per season. However, I have a
preference for the TotalZone estimate for two reasons: it’s the same
system I use for Yaz and it covers the whole of Manny’s career
(through 2007). (The other numbers quoted typically cover three to five recent
years).
However, as you can see, TotalZone gives quite different results for
Manny’s defense than all of the other systems. What I’m going to do
here is hedge my bets by taking an average of those five values, but
giving extra weight to the TotalZone result. What I end up with is
-10 runs per season as Manny’s defensive value, which seems like a
reasonable number.
Manny has played around 11 full seasons’ worth of
outfield, making his defensive “contribution” negative 110 runs, give
or take. That translates to around -11 wins for fielding for Manny.
There’s one more small point that we need to address: a positional
adjustment. Remember, we are estimating defensive value above an
average defender at the same position. But an average defender at
shortstop has more inherent value than an average defender at first
base, even though both with be credited with zero runs above average.
The positional adjustment gives credit for playing a more difficult
(and valuable) position.
Now Manny and Yaz were both predominantly corner outfielders, but they
did play other positions on occasion. Yaz played one season in center
field and several seasons at first base, while Manny was the DH for
about 300 games. Taking into account the inherent value at
each position, we find that Manny should get a boost of about .6
wins, relative to Yaz.

Throwing arm
Yaz was famous for his potent arm—his throwing ability is
constantly praised in almost anything you read about him. In my
analysis of the best outfield arms of the last 50 years, published in
the Hardball Times Baseball Annual 2007, I found that Yaz’s
arm, over his career, was worth 65 runs more than an average
left fielder. During the period I’m interested in, Yaz saved around 55
runs, or about 5.5 wins, with his throwing arm.
Manny’s arm does not appear to be an asset—it is not strong
and Manny tends to sidearm his throws into the cutoff man. He’s not
particularly fast getting to the ball, either, although he is quick
getting rid of it once he’s gotten hold of it. But despite an
appearance of ineptitude, Ramirez actually has an above average arm. I
have him as around 11 runs above average in left field and an
additional plus four runs in right field. Combined, Manny’s throwing arm
has been worth around 1.5 wins.
You can read up on the details of the throwing arm
analysis here.
Average vs. Replacement
There’s another small issue I want to address before wrapping up and
that is the question of measuring a player’s contributions relative to an average
player, as I have done here, or relative to a replacement
player. There has been a lot of discussion on this topic in sabermetric
circles, with some folks prefering the average player as a baseline,
while others prefer a replacement-level baseline. I think both
approaches have their uses, although I’m more partial to using
replacement level in general.
Sometimes, however, comparing to average is easier and clearer. For
example, nobody knows what a replacement-level baserunner is, although
it’s easy to determine was an average baserunner is.
When comparing two players with the same amount of playing time, there
is no difference between the two approaches. When the playing time
differs, comparing to league-average will favor the player with less
playing time, while comparing to replacement-level will favor the
player who played more.
In our case, Yaz played 300 games more than Ramirez, so Yaz gets
penalized by my choice of baseline. You can remedy this, if you like,
by adding in a generic two extra wins per season, which is the
difference between an average and a replacement-level player. This
would give Yaz an additional four wins, compared to Manny, although
I’m going to stick with my average-player baseline.
Add it up
We now have evaluated the four aspects of these two players’
game. Here is how they stack up (keep in mind that Yaz’s numbers are
through age 36):
Wins Above Average

                Yaz      Manny
------------------------------
Offense         49.6     60.4
Baserunning     -0.5     -1.9
Range           10.6    -10.5
Arm              5.5      1.5
------------------------------
Total           65        50
I’ve rounded the total values to the nearest win. So, we see that
Yaz’s value was significantly greater than Manny’s once you take into
account defensive contributions.
Since there is a lot of uncertainty on Manny’s defensive value, we might
ask ourselves if we’ve overstated Manny’s deficiencies afield. How
would the totals look if Manny’s defense was better than we’re giving
him credit for? Well,
if we were to take the TotalZone value for Manny (-3 runs per year)
and ignore the other systems completely, Manny would pick up about
seven wins, but Yaz would still enjoy a comfortable 65-57 lead.
What about peak value?
So far, I’ve only considered total career value through age 36. But a
player’s peak value is also an important consideration. If two
players have similar career numbers, but one had a much higher peak,
we will tend to view the latter as the batter player. Who was the
better pitcher, Don Sutton or Pedro Martinez?
Win Shares is a stat that endeavors to
estimate a player’s total value, although it does not include throwing
arm or baserunning contributions. I did not use Win Shares to perform
this analysis, because its defensive system is not based on
play-by-play data and is, for that reason, less reliable than
the other systems I have considered.
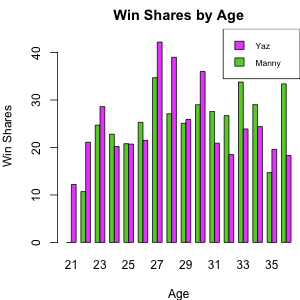
Nevertheless, Win Shares is a convenient way to view the peak
production of a player. The graphic on the right shows you the yearly Win
Shares value for Manny and Yaz.
As you can see from the plot, Yaz’s top seasons were
somewhat better than Manny’s, although Manny had more seasons with 25
Win Shares and he’s still going quite strong at age 36.
We can also compare how the MVP voters viewed the two stars. Yaz won the MVP
in 1967, his Triple Crown season, and finished in the Top 10 five
times. Manny has yet to win the award, but has finished in the Top 10
nine times.
I suppose if you consider a five-year period, Yaz probably had the
higher peak, but if you favor a longer definition for peak years, than
Manny probably comes out on top. Either way, I don’t see the peak
vs. career issue playing a decisive role in comparing these two
players.
The final word
Well, it’s pretty clear, at least to me, that the second-best left
fielder in Red Sox history is Carl Yastrzemski. Manny has had the
more potent bat, but when you also consider baserunning and defense,
Yaz’s superiority emerges clearly.
I’d like to close out with a few words on intangibles.
As some folks love to say, you can’t measure everything
with stats. What about the intangibles of these two players? Is
there something beyond the numbers that we should be taking into
account?
Well, if you’ve followed baseball at all in recent years, and
especially this year, you’ve read plenty about Manny off the field. I
don’t think I need add to that discussion. Suffice it to say that
Manny carries a certain amount of off-the-field baggage.
What about Yaz, though? What kind of teammate was he, was he
considered a hustler, did he have off-the-field issues? It’s hard to
say, without doing quite a bit of archival research (hey, I’ve got a day job, you know), although I get
the impression that Yaz was well-respected by his teammates.
That’s not to say he was an easy guy to get along with. He was tightly
strung and pushed himself very hard, which had an effect on this
relationship with others. His manager in the mid-60s, Billy Herman
said, “How did I get along with Yastrzemski? Like everybody else. By
that I mean nobody ever got along with Yastrzemski.”
Yastrzemski himself admitted how stressful the game was for him:
“I loved the game. I loved the competition. But I never had any fun. I
never enjoyed it. All hard work all the time.”
Yaz’s demons notwithstanding, I don’t think there’s any way possible
that Manny’s intangibles could make up the difference between the two
players, indeed, I’m certain that Manny’s off-the-field issues widens
the gap between them.
References & Resources
The defensive systems that I looked at for Manny’s defense:
- TotalZone — developed by Sean Smith, you can read about it here.
- UZR — Mitchel Licthman’s defensive system, based on play-by-play data with all the whistles and bells. The number quoted for Manny comes from Sean’s article
on TotalZone. - Zone Rating — system based on the Stats, Inc. play-by-play data. Again, the number here comes from Sean’s article.
- Dewan +/- — the plus/minus system developed by John Dewan of Baseball Info Solutions. The number quoted is for 2003-2005 and comes from
the The Fielding Bible. - SFR — Simple Fielding Runs, developed by Dan Fox at Baseball Prospectus. The number quoted comes from this article (subscription required) and is based on the years 2003-2007.
Early in his career, Yaz was blistered by the press and his mgr for lack of hustle. Dick Williams referred to him as “an All Star from the neck down”