Ye Gods of BABIP, Let My Fly Balls Go!

It’s not surprising that Chris Young struggles at times to limit ground ball base hits. (via Arturo Pardavila III)
Ye Gods of BABIP, may you find favor in the launch angle and exit velocity of our batted balls, for we stand to make millions should the balls (<if pitcher then “fall into the glove of a fielder before they” end>) land on the outfield grass.
This is part two of a visual dissection of balls in play and the effects velocity, location and pitch type have on the mysterious BABIP metric. You can read Part One, though it is by no means a prerequisite; neither of these stories is intended to break new ground. Rather they are an attempt to display visually some of the nuances behind line drives and fly balls.
Let us begin by pointing out that these data are sourced from PITCHf/x data and are subject to the vagaries of said data set. For the purposes of this piece, there will be no attempt to smooth over any classification issues with respect to pitch type, trajectory or distance. Generally speaking, the number of pitches involved is large enough to account for these nuances.
We begin by breaking down the field of play in terms of spray (LF to RF) with zero degrees representing the left field line and 90 degrees the right field line.
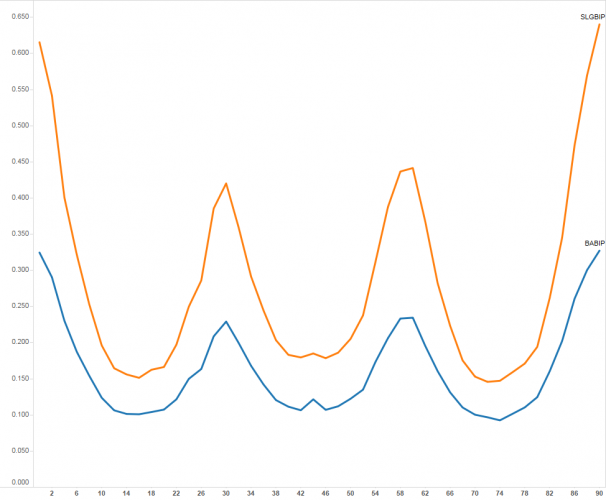
BABIP & SLGBIP for Line Drives by Spray Angle
This chart demonstrates how line drives are fairly stable with respect to BABIP, except down the lines, where they are less likely to be caught. There does not appear to be any appreciable spike to the gaps; conversely, for slugging, we see huge gains in the gaps, around 30 degrees and 60 degrees. If we assume the left fielder, center fielder and right fielder are positioned at roughly 15, 45 and 75, this serves as a demonstration of the superior defensive ability of the center fielder compared to his outfield mates, since the 30 degrees around the center fielder do not have any BABIP spikes, while the 30 degrees to the other side of the left and right fielders see tremendous spikes, with a similar trend for slugging on balls in play, as well.
What about fly balls?
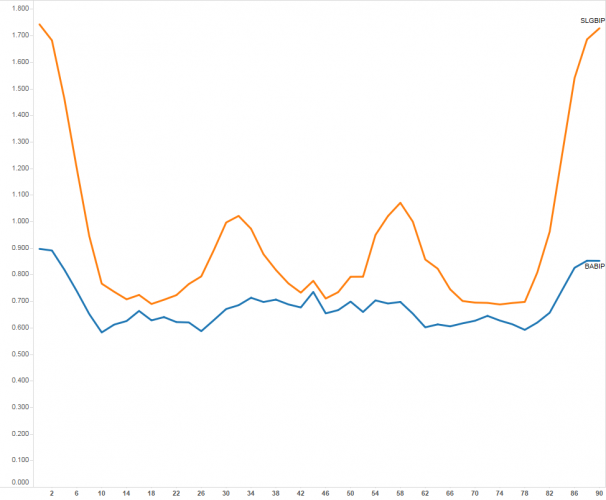
BABIP & SLGBIP for Fly Balls by Spray Angle
We see a very similar story here, with the important distinctions that fly balls to the gaps are far more effective from a BABIP standpoint (almost twice as effective), and there is a far greater slugging impact across the board (breaking news alert!). What I would like to point out are the BABIP spikes down the line, which mirrors what we saw with line drives and begs the question, are fielders being positioned correctly, or would it make more sense to move the left fielder and right fielder closer to the line and place more emphasis on the center fielder?
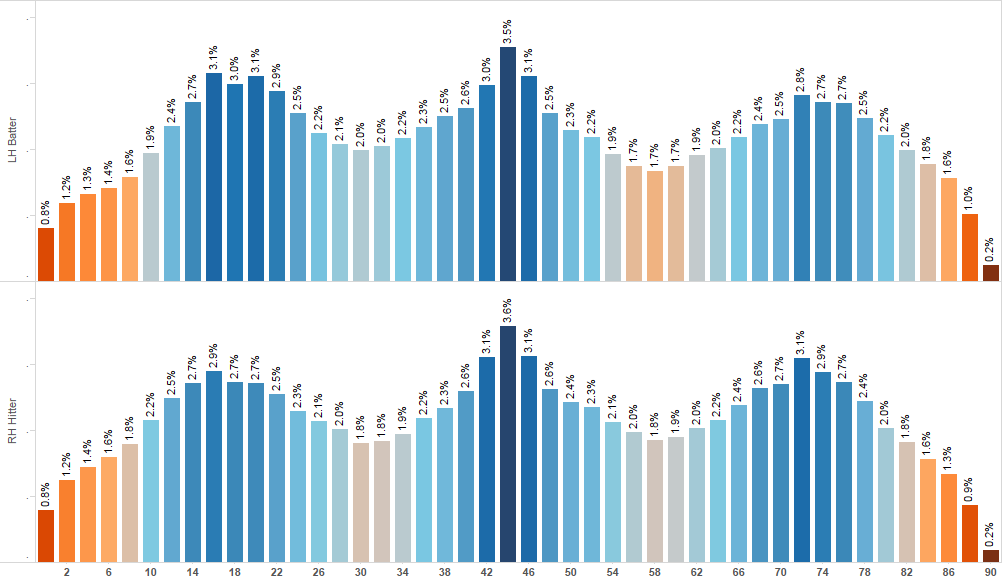
What we’re looking at here is a histogram showing the distribution of all line drives plus fly balls hit by spray angle. What we can see clearly is that, for some reason, the vast majority of batted balls are hit to where the fielders are standing. On the surface this would appear to suggest batters cannot control the spray angle of their hits. However, I would suggest that despite the fact that the mean of the spray distribution will be where the outfielder is standing, this is actually beneficial for the batter as it reduces the probability of a foul ball.
For example, if a batter attempts to have his average ball in play be right down the right field line, that would result in 50 percent of his struck balls resulting in foul balls, as compared to right at the fielder, where the large majority of balls will remain fair, especially the ones that are far enough to be home runs.
Effect of Velocity on BABIP
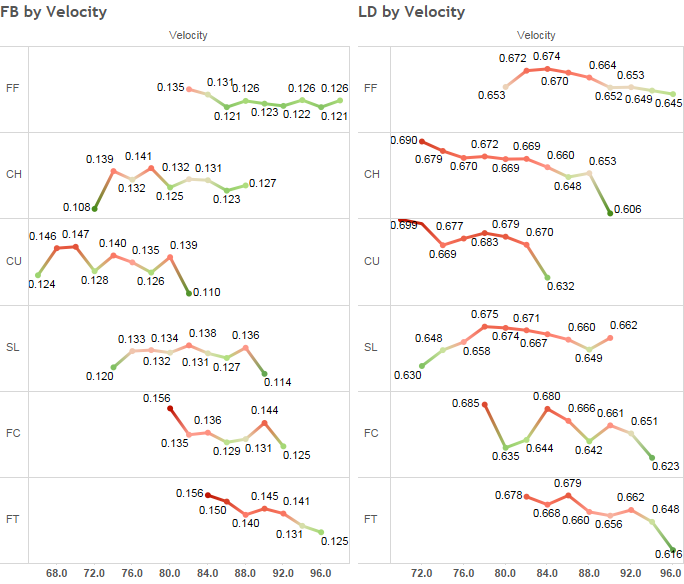
Using PITCHf/x data only, we don’t see much of a relationship between velocity and BABIP for fly balls, except for two-seam fastballs, which exhibit a fairly linear decline as velocity increases. This is mirrored on the right, suggesting there may be something to this relationship.

Looking at Statcast data, there is no exit velocity differential to explain it. However, it does corroborate the concept of a “heavy sinker” being difficult to do damage with. We seem some trend with change-ups and line drives, but the gap between 76 mph and 86 mph is extremely small, and the results don’t match with the fly ball data, so I’m not comfortable suggesting a relationship there.
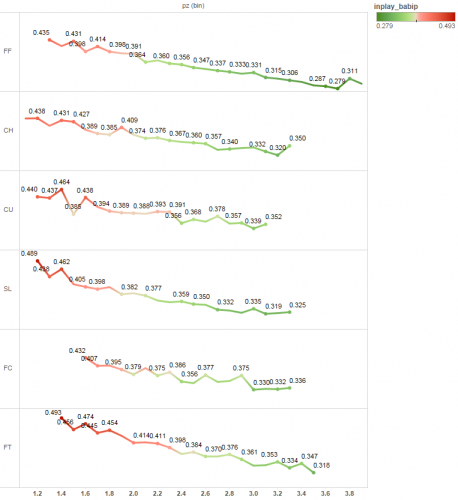
The Effect of Height on Fly Ball and Line DriFB+LD BABIP
The numbers across the bottom represents feet above the plate as the ball crosses the front of the plate. Here we see a definitive linear trend: When a ball is hit in the air, the higher it is in the zone, the less likely it is to fall for a hit. This would suggest flyball pitchers can control their BABIP by throwing pitches higher. It also suggests that hitters who have the ability to lift low pitches may have higher BABIP numbers. As we’ll see later, what the data appear to be saying is that all else being equal, balls higher up in the zone will lead to launch angles that are less conducive to fly ball and line drive BABIP.
FB + LD BABIP Suppresion
Let’s take a peek at the top and bottom BABIP-suppressing pitchers of the PITCHf/x era and see if we can sense a pattern. I’ve included fly balls and line drives (essentially all non-ground balls) since PITCHf/x doesn’t give clean trajectory data. Let’s begin by showing a 2×2 chart. If you are in the bottom left quadrant, you’re probably underrated by the FanGraphs community.
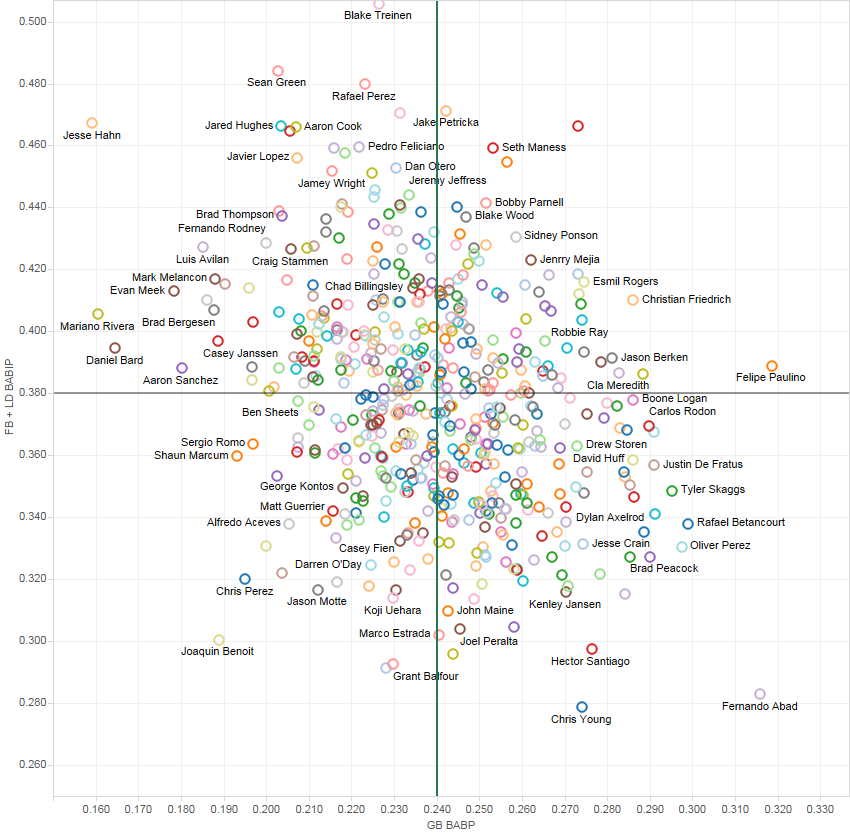
We see a minor, negative correlation between groundball BABIP and non-groundball BABIP, but it is minimal at 0.08, suggesting that there is a trade-off, but not a large one. In the top right, we see superstars such as Sidney Ponson, Jenrry Mejia, Seth Maness, Esmil Rogers and Jason Berken. These guys are tremendous at inflating hitter’s BABIP. I would go so far as to suggest there may be a limit to BABIP suppression as a skill, but if that skill isn’t present, it can lead to disastrous results.
In the bottom left we have a lot of relievers, as well as Marco Estrada and Shaun Marcum, two change-up specialists (we’ll take a closer look at the non-groundball leaders in a bit). Casey Fien is an interesting one for me, as it helps explain how he’s maintained a fairly respectable 1.145 WHIP over his 270 mediocre major league innings. I’m still amazed at Koji Uehara, who has a fastball slower than Stephen Strasburg’s change, yet can strike batters out and minimize BABIP of any kind. Gotta love Joaquin Benoit’s skill set, with respect to balls in play.
In the top left, we have Mariano Rivera, who was ridiculously good at preventing groundball base hits but was only mediocre at preventing non-groundball hits, contrasted to non-groundball king Chris Young, who is only mediocre at preventing groundball base hits.
Let’s compare and contrast the top vs. bottom line drive-plus-fly ball BABIP suppressors:
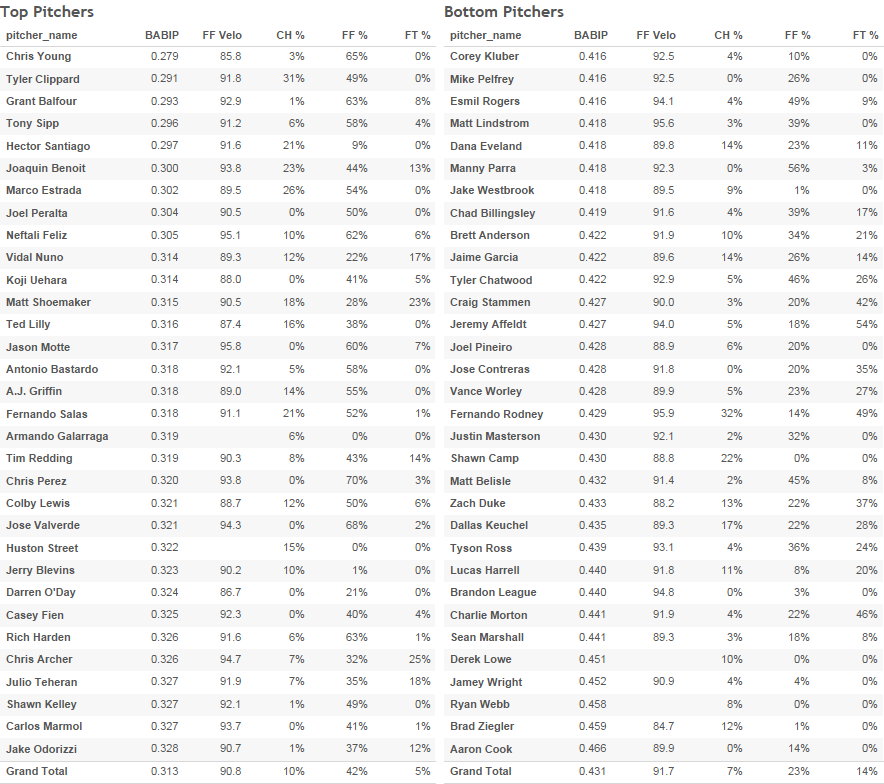
It appears the top BABIP guys appear to throw more four-seam fastballs, while the bottom guys throw more two-seam fastballs. This makes sense, since a rising fastball will cause the hitter to get underneath, leading to a lot of easy outs, whereas a sinking fastball will cause the batter to hit the ball with a lower angle and produce fewer proverbial “cans of corn.” Let’s follow up the very unscientific table above and see if the relationships hold up under a little more scrutiny.
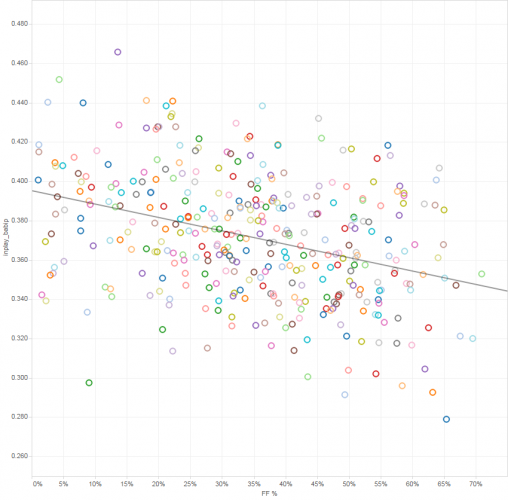
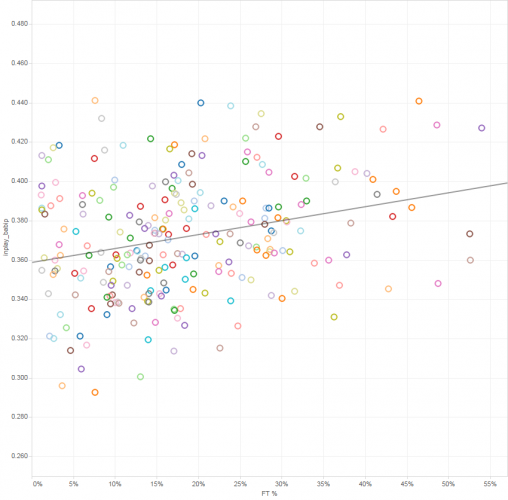
FF% x BABIP | R-Square = 0.12
We see a halfway decent correlation between four-seam fastballs as percentage of all pitches and BABIP, which corroborates what we saw in the table above. We see the opposite effect with two-seam fastball percentage.
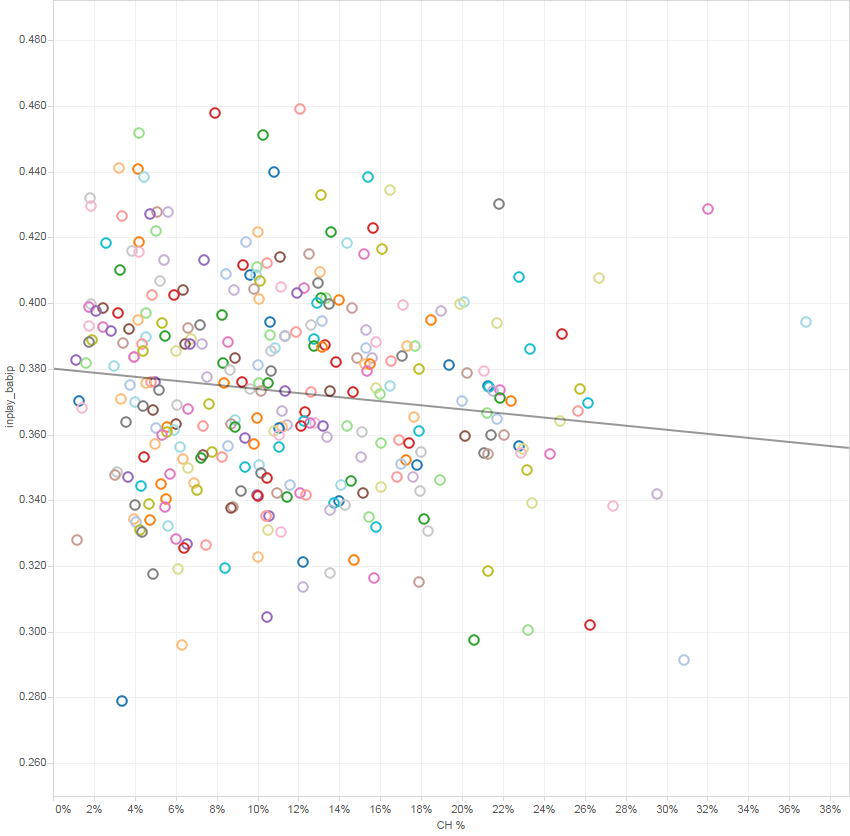
FT% x BABIP | R-Square = 0.07
Interestingly, change-up percentage and four-seam fastball velocity show almost no relationship whatsoever to BABIP suppression (R-Squared of 0.02 and 0.007 respectively).

Statcast tells the same story:
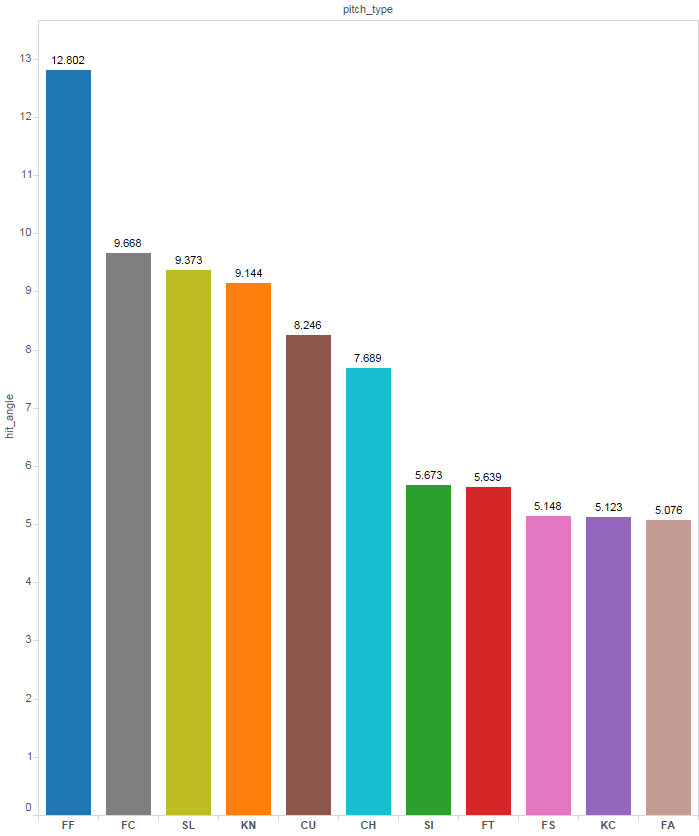
Essentially, four-seam fastballs have by far the highest average launch angle, leading to a reduced fly ball-plus-line drive BABIP. So how much can pitchers control? Quite a bit, actually. Taking a quick “spin” with Statcast data, we get the following eye chart with respect to four-seam fastballs:
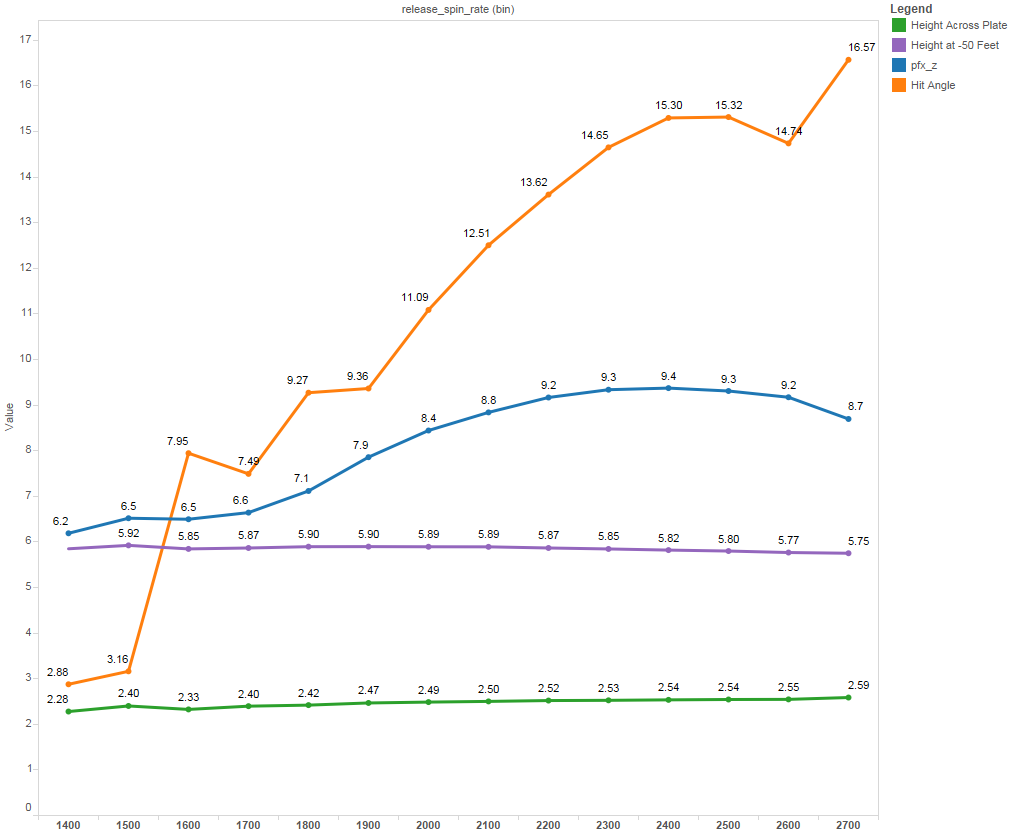
The green and purple represent the height across the plate and the release point, respectively. We can see that, as release spin rate increases, the ball will cross the plate higher, all else being equal. This is represented with the nice curve we see for pfx_z, with it steadily increasing up until roughly 2400 rpm. Interestingly, average launch angle seems to increase dramatically as we increase spin rate, indicating that pitchers with extreme fastball spin can induce a lot of pop flies. We get a decent 0.15 to 0.22 r-squared (depends on the sample size) between spin rate and launch angle.
It appears pitchers who can live at the extreme ends of the spin spectrum will have the ability to control the batted-ball distribution of their opposition. This would indicate that a pitcher, over enough of a sample size, could–in theory–control the spin rate dependent on the batter so as to modify the mean hit angle.
Let’s say Pitcher A is throwing to Batter B, and B has a line-drive stroke and usually will strike the ball with a launch angle of 13 degrees, all else being equal. In that situation, throwing a four-seam fastball with a lot of rise might turn a line drive into a home run by pushing the launch angle into the sweet spot for a home run. Conversely, a player who is an extreme flyball hitter might be easily induced into hitting a pop fly.
Those histogram bumps claiming balls tend to be hit at the fielders, isn’t it a lot more likely that this is data error? That location data doesn’t look trustworthy at all.
This all supports Tango and MGL’s earlier research, which had far less granular data to work with: Fly ball pitchers do better against fly ball hitters than other classification’s of pitchers, (i.e. GB pitchers and Neutral pitchers), and Groundball pitchers own groundball hitters.
Does any of the stat cast data record the curve of line drives and fly balls ? i.e. slicing and hooking ? The tendency of balls hit into the corners to be one or the other would seem to impact the BABIP on those balls a great deal as they are much more difficult to field than a straight FB or LD. They are not only located in that section, but they are MOVING AWAY from the fielder. While obviously centerfielders are those with the most range and presumably the best at turning balls in play into outs, I think the slice/hook issue would need to be addressed to more accurately measure how much this data supports that.
Agreed. And yes, spin rate (and location of pitch) matched up with the batter’s typical trajectory is exactly what causes the G/F platoon effect.
I would be interesting if a pitcher would experiment trying to control/adjust spin rate depending on the G/F tendencies of the batter.
Waffle Hooded TT, which is a fresh take on the classic hoodie with a boxy fit and three-tone waffle fabric; Compact Terry TT with mesh inserts and bold zipper pull; Compression Tee and Seamless Shorts.