A Tale of Two Third Basemen
There are only five things you can do in baseball—run, throw, catch, hit and hit with power.—Leo Durocher
Mark Teahen of the Royals and Sean Burroughs of the Padres have a lot in common. In addition to playing the same position, they were both first-round draft choices; Burroughs was selected by the Padres in 1998, and Teahen was taken by the A’s in 2002. They both hit left handed and throw right handed. They were both born in September; Teahen turns 24 this year, while Burroughs is a year older. They both graduated from high school in California. They’re both pretty big guys; Teahen tips the scales at 6’3” 210 pounds, while Burroughs weighs in at 6’2” 200.
And they both have a deficiency in the last of the five things listed by Leo the Lip. Burroughs had hit one home run by the All-Star break this season in over 250 plate appearances and just 11 in his career that spans over 1,500 plate appearances. Teahen had hit two home runs in 220 plate appearances and just 18 in over 1,400 minor league plate appearances.
To hear announcers discuss it, (as I did the Rockies’ television analyst George Frazier in the three-game set before the All-Star break) there is no reason why. After all, they’re big enough and they play a position on the far left on the defensive spectrum where hitting for power is expected. What gives? That’s exactly what I was wondering, so I did a little digging and found both good news and bad news for Royals and Padres fans.
The Good News
The common wisdom in the sabermetric community is that power is a skill that develops over time, so just because a player doesn’t exhibit it in college or immediately upon entering the professional ranks, it doesn’t mean he never will. And, in fact, as many of you will remember, Teahen was the poster boy for this view in Moneyball, where Michael Lewis recounts this discussion of Teahen in the A’s draft room:
Billy Beane: Tell us about Teahen.
[Director of scouting]Eric Kubota: Teahen. Six three. Two ten. Left right. Good approach to hitting. Not a lot of power right now. Our kind of guy. He takes pitches.
Scout: Why haven’t we talked about this guy before?
Kubota: It’s because Teahen doesn’t project. He’s a corner guy who doesn’t hit a lot of home runs.
Beane: Power is something that can be acquired. Good hitters develop power. Power hitters don’t become good hitters.
But where’s the proof that good hitters can develop power? And does that apply to players with the track records of Burroughs and Teahen who have over 1,500 professional plate appearances? To find out I did a quick study using the Lahman database. First I selected all the players who had debuted in the majors since 1901 and through the 2004 season who before the age of 25 had accumulated 1,000 or more at-bats plus walks and who subsequently garnered an additional 1,000 at-bats plus walks after the age of 25. That gave me a set of 591 players. Then I calculated their slugging percentages, batting averages, and Isolated Powers (ISO) both before they turned 25 and after they turned 25 (using July 1 as the cutoff).
For those who aren’t familiar with ISO, it is a simple statistic that was originally developed by Allan Roth and Branch Rickey in the 1950s and is calculated by subtracting batting average from slugging percentage. The reason I chose to use it in this study is that it measures the number of extra bases a player generates per at-bat, and extra bases come from hitting doubles, triples and home runs. In other words, exhibiting power. If a player hit .265 with a slugging percentage of .485 then his ISO would be .120, which, as it turns out, is the historical norm. An ISO below .100 would identify a singles hitter while one above .200 would identify a power hitter.
Taking these 591 players I then subtracted their ISO before age 25 from the ISO after age 25 to come up with a list of players who have gone from punch-and-judy to power hitters. Here are the top 20:
              PA<=24 PA>24  SLUG  SLUG   ISO   ISO
                            <=24   >24  <=24   >24  Gain
Barry Bonds     2366  9034 0.458 0.656 0.203 0.343 0.140
Sammy Sosa      2006  6871 0.413 0.585 0.170 0.298 0.128
Rogers Hornsby  2827  6384 0.467 0.627 0.144 0.252 0.109
Kirby Puckett   1305  6389 0.363 0.500 0.071 0.177 0.105
Jeff Bagwell    1299  7781 0.440 0.560 0.157 0.260 0.103
Rafael Palmeiro 1558  9855 0.428 0.532 0.141 0.242 0.101
Babe Ruth       1300  9161 0.568 0.708 0.260 0.361 0.101
Larry Walker    1049  6415 0.433 0.591 0.171 0.268 0.097
Gary Sheffield  2353  6151 0.451 0.560 0.166 0.257 0.091
Lou Whitaker    2007  7760 0.344 0.447 0.078 0.168 0.090
Jim Thome       1329  5609 0.494 0.588 0.215 0.303 0.087
Roy Smalley     1527  4901 0.315 0.421 0.073 0.159 0.085
Joe Adcock      1216  5984 0.415 0.500 0.144 0.221 0.077
Elmer Smith     1280  2234 0.366 0.479 0.115 0.188 0.073
Bernie Williams 1278  6669 0.388 0.507 0.125 0.198 0.073
Harry Heilmann  2189  6454 0.412 0.558 0.126 0.197 0.071
Oscar Gamble    1764  3348 0.404 0.482 0.143 0.214 0.071
Three things should jump out at you. First, there are several players here who were obviously already power hitters before their 25th birthdays and who simply turned it up a notch afterward. Bonds, Ruth, Thome, Walker and Sosa all displayed power before the age of 25, so they’re not really comparable to Teahen and Burroughs. The second thing is that some of these players, like Hornsby, Ruth, Sheffield, Bonds and Sosa were also helped by the fact that later in their careers they played in leagues where more home runs and more runs were scored. After all, a rising tide lifts all boats. Finally, the inclusion of Larry Walker might raise a few eyebrows when you remember he played his first six seasons in Montreal before moving to the thin air of Coors Field, where his isolated power received a boost via his home park.
So let’s correct for the first by excluding those with an ISO before age 25 of .170 or higher. That leaves 448 players, the top 20 of which are:
              PA<=24 PA>24  SLUG  SLUG   ISO   ISO
                            <=24   >24  <=24   >24  Gain
Rogers Hornsby  2827  6384 0.467 0.627 0.144 0.252 0.109
Kirby Puckett   1305  6389 0.363 0.500 0.071 0.177 0.105
Jeff Bagwell    1299  7781 0.440 0.560 0.157 0.260 0.103
Rafael Palmeiro 1558  9855 0.428 0.532 0.141 0.242 0.101
Gary Sheffield  2353  6151 0.451 0.560 0.166 0.257 0.091
Lou Whitaker    2007  7760 0.344 0.447 0.078 0.168 0.090
Roy Smalley     1527  4901 0.315 0.421 0.073 0.159 0.085
Joe Adcock      1216  5984 0.415 0.500 0.144 0.221 0.077
Elmer Smith     1280  2234 0.366 0.479 0.115 0.188 0.073
Bernie Williams 1278  6669 0.388 0.507 0.125 0.198 0.073
Harry Heilmann  2189  6454 0.412 0.558 0.126 0.197 0.071
Oscar Gamble    1764  3348 0.404 0.482 0.143 0.214 0.071
Alex Trevino    1159  1476 0.303 0.357 0.045 0.116 0.071
Chuck Knoblauch 1979  5191 0.351 0.427 0.066 0.136 0.070
Beals Becker    1192  1813 0.331 0.441 0.079 0.149 0.069
Howard Johnson  1062  4570 0.396 0.458 0.142 0.211 0.069
Mike Ivie       1414  1494 0.388 0.453 0.119 0.184 0.066
Ivan Rodriguez  2810  4284 0.429 0.530 0.144 0.210 0.066
Robin Ventura   1972  6167 0.398 0.458 0.127 0.193 0.065
Toby Harrah     1339  7216 0.327 0.409 0.077 0.142 0.065
Now this is a more interesting list, as you start to see some players who aren’t normally considered big home run hitters. However, there are still guys like Hornsby, Bagwell and even Palmeiro who were helped by the environmental changes and possibly some who were helped by playing in more friendly parks as their careers progressed. In order to correct for both factors I calculated the Normalized ISO (NISO) by dividing the player’s ISO by the square root of the Batter Park Factor (BPF) divided by 100 and then dividing by the league ISO.

NISO = (ISO / SQRT(BPF/100)) / LgISO
BPF is a number that represents the amount the park affects run scoring, with 100 being average. For example, if a player plays in a pitcher’s park like PETCO Park in 2004, the park factor would be 92, while in a hitter’s park like Fenway Park in 2004 it would be 107. Dividing by 100 represents the value as a percentage, and taking the square root more accurately applies the park factor to elements like ISO that contribute to run scoring as discussed by Palmer and Thorn in The Hidden Game of Baseball. So if a player played in a ballpark with a BPF of 102, had an ISO of .100 in a league where the ISO was .120, then his NISO would be:
.825 = (.100 / SQRT(102/100)) / .120
Re-ranking the 448 players produces a new top 20 (ok, 21 but bear with me) where the NISO Gain column is the difference between the NISO before the age of 25 and after.
               PA<=24 PA>24  SLUG  SLUG   ISO   ISO   ISO  NISO  NISO  NISO
                             <=24   >24  <=24   >24  Gain  <=24   >24  Gain
Kirby Puckett    1305  6389 0.363 0.500 0.071 0.177 0.105 0.500 1.242 0.742
Roberto Clemente 2519  7556 0.395 0.503 0.113 0.173 0.060 0.800 1.425 0.625
Lou Whitaker     2007  7760 0.344 0.447 0.078 0.168 0.090 0.586 1.210 0.624
Beals Becker     1192  1813 0.331 0.441 0.079 0.149 0.069 1.028 1.645 0.617
Howard Johnson   1062  4570 0.396 0.458 0.142 0.211 0.069 1.080 1.645 0.565
Joe Adcock       1216  5984 0.415 0.500 0.144 0.221 0.077 1.106 1.660 0.554
Alex Trevino     1159  1476 0.303 0.357 0.045 0.116 0.071 0.396 0.949 0.554
Roy Smalley      1527  4901 0.315 0.421 0.073 0.159 0.085 0.621 1.145 0.523
Roy Sievers      1043  6185 0.425 0.483 0.154 0.218 0.064 1.238 1.733 0.495
Mike Ivie        1414  1494 0.388 0.453 0.119 0.184 0.066 1.064 1.541 0.478
Rafael Palmeiro  1558  9855 0.428 0.532 0.141 0.242 0.101 1.091 1.563 0.472
Oscar Gamble     1764  3348 0.404 0.482 0.143 0.214 0.071 1.184 1.652 0.468
Cleon Jones      1046  3577 0.339 0.424 0.087 0.135 0.048 0.728 1.186 0.458
Bob Bailey       2735  4199 0.367 0.428 0.114 0.168 0.054 0.929 1.380 0.450
Bobby Doerr      3103  4799 0.444 0.472 0.153 0.186 0.033 1.201 1.640 0.439
Ken Harrelson    1463  1860 0.384 0.438 0.152 0.194 0.041 1.169 1.600 0.431
Bob Kennedy      1364  3624 0.302 0.376 0.065 0.115 0.049 0.537 0.957 0.420
Joe Rudi         1273  4652 0.374 0.441 0.119 0.174 0.055 1.018 1.437 0.419
Gary Sheffield   2353  6151 0.451 0.560 0.166 0.257 0.091 1.283 1.701 0.419
Joe Hauser       1004  1290 0.477 0.480 0.164 0.220 0.057 1.489 1.905 0.416
Toby Harrah      1339  7216 0.327 0.409 0.077 0.142 0.065 0.677 1.087 0.410
So how do these 21 players stack up to Teahen and Burroughs?
Well, through the 2004 season, Burroughs had an ISO of .085 and a NISO of .574 in 1,319 plate appearances. There are four players that are right in that range for NISO: Kirby Puckett, who hit just four home runs before the season he turned 25 and who went on to hit 207; Lou Whitaker, who hit only 12 home runs in his first four seasons and 232 afterward; Toby Harrrah, who hit 13 home runs before the season he turned 25 and 195 for his career.
As for Teahen, his ISO at the All-Star break was .102 in a league where it was .154. So his NISO is roughly .659. Although a much smaller sample size, the players comparable to him would be the same as those listed for Burroughs.
So what does this mean?
To me this is hopeful since it shows that in the recent past there have been several infielders like Smalley, Whitaker and Harrah, as well as outfielders like Puckett and Clemente, who have developed more than average power after being in the league a few years and after the age of 24. And if you move the cutoff to 23 instead of 24, you’ll also find that George Brett fits the mold. So historically speaking, it’s not out of the question that Teahen and Burroughs will live up to the announcers’ expectations.
The Bad News
Of course to go with the good news there is always some bad news. Here the bad news is twofold. First, if history is any guide, it is unlikely that Teahen and Burroughs will develop into power hitters that regularly swat 30 to 40 home runs. Their comparable players all wound up with around 200 career home runs and usually hit between 15 and 25 home runs per season. In Moneyball, Lewis uses the example of Jason Giambi as a guy who hit few home runs before age 25. Giambi hit just 28 home runs in over 1,000 minor league plate appearances and 6 in around 200 plate appearances the season he turned 24. He then hit 20 the next two years before starting down the path to his 2001 MVP season. (He didn’t qualify for my list since he did not have 1,000 major league plate appearances before turning 25.) Given Giambi’s admitted use of steroids, however, he’s probably not the best comparable player here.
Second, the timing of the power development for the 448 players indicates that it had better happen pretty soon for Teahen and Burroughs. Below is a graph of the NISO by age (the purple line) along with the three-year moving average (yellow line) for the 448 players in the study.

You’ll notice that the yellow line has a pretty steep curve and crosses 1.0 at age 25 and continues upward peaking until age 28, when it starts its slow decline that accelerates at about age 40. What this says to me is that if we’re having this conversation two years from now, then I wouldn’t bet on it happening.
Digging a Little Deeper
While I was thinking about hitters developing power I wondered how the distribution of balls put into play might differ between power hitters and hitters like Burroughs. Using Retrosheet play-by-play data from 2003 and 2004 combined with the Lahman database, I calculated the percentage of balls put into play by Burroughs, left-handed power hitters (defined as hitters with above average ISO), and left-handed contact hitters (defined as hitters with below average ISO). Balls fielded by the third baseman, shortstop and left fielder were placed in the Left category, balls hit to center, pitcher and catcher were placed in the Center category, and those hit to the right fielder, second baseman and first baseman were placed in the Right bucket.* The results are below.
               Ground balls         Fly Balls        Line Drives        Popups
                  L     C     R     L     C     R    L      C     R     L     C     R
Burroughs      30.7  53.3  16.1  49.5  13.3  37.2  39.1  35.2  25.7  66.7  27.8   5.6
LH Total       23.8  58.8  17.4  38.8  21.5  39.7  29.0  41.1  29.9  64.9  25.0  10.1
LH Power       21.2  63.5  15.2  38.2  22.0  39.8  26.1  44.1  29.8  65.6  24.7   9.7
LH Contact     26.2  54.4  19.4  39.6  20.9  39.6  32.5  37.5  30.0  63.9  25.2  10.7
As you might have expected, when compared with power hitters Burroughs hits a lot more fly balls to left field and hits his line drives to center and left field. Another big difference can be seen in his distribution of the types of batted balls he hits.
                 GB    FB   PU    LD
Burroughs      51.6  24.8  3.9  19.7
LH Total       45.6  27.9  7.6  18.9
LH Power       41.1  30.9  8.2  19.8
LH Contact     50.6  24.6  6.9  17.9
From this it is obvious that Burroughs is an extreme groundball hitter; combine with this the fact that he hits most of his fly balls to center and left fields, and it helps explain his low home run totals. Teahen’s profile is similar to Burrough’s (which you see using the Hitting Chart feature on MLB.com), and Michael Lewis recounts in a recent New York Times Magazine article how the Royals had George Brett work with Teahen for two days last July in order to turn him into a power hitter by teaching him to pull the ball. It didn’t work. So it would seem that in order to become power hitters, Burroughs and Teahen not only need to pull the ball a bit more but also lift the ball.
Finally, even though MLB.com’s Hitting Chart is a wonderful thing, it doesn’t readily provide aggregate percentages. So using the data I created for this article I wrote a little Windows application to graphically display where and how hitters hit the ball in 2003-2004. The application, BIPChart, has a simple user interface that allows you to type in the name of the player and then view his percentages on a series of diamonds.
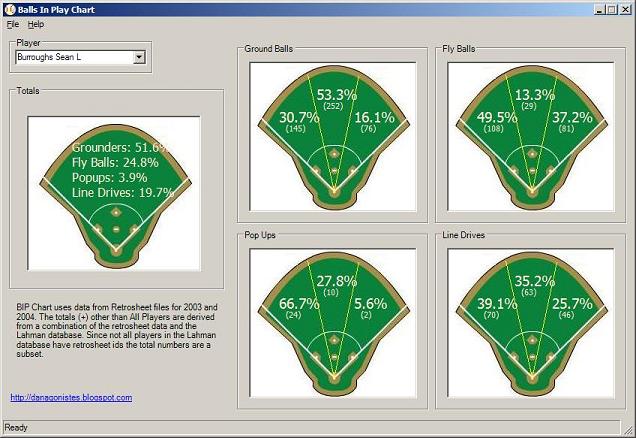
You can download the software from here and play around with it. Note that it requires the .NET Framework 1.1 which you can download here or obtain using Windows Update if you don’t already have it installed. The data file used by the application called power.csv will also be installed in the application folder so that you can perform your own analysis.
* It should be noted that not all players were included in the splits for left handers since not all player records in the Lahman database could be matched with players in the Retrosheet database, but a large enough percentage were for me to decide to show the numbers anyway.
References & Resources
“Absolutely, Power Corrupts”—by Michael Lewis, April 24, 2005