Cano the choker
My first take on the clutch issue went nearly unnoticed more than a year ago.
Here I’m getting at it once more, having the benefit of both the wide audience provided by The Hardball Times and the data from FanGraphs.
Leaving aside questions such as whether clutch hitting does exist, let’s try to define the traits of a clutch hitter.
First warning. My choice is to treat every game the same; i.e., a plate appearance with the game on the line is always important, no matter if it’s a wild card race contest or a meaningless game between two teams out of contention. Other analysts will be able to replicate this study weighting for the importance of the game. (Yes, I’m looking at you and your Championship Leverage Index, Mr Sky Andrecheck.
Update: It appears that Sky is now an analyst for the Cleveland Indians; congratulations to him.
I think of a clutch hitter as someone who, whatever his underlying talent, does his best when the game is close and leaves his worst at-bats in mop-up situations. Thus, a player who has 10 home runs in his bat would be perfectly clutch if he hit them in the 10 most important plate appearances of his season; and at the same time he piled up his strikeouts in the most lopsided games.
Second warning. According to how I’m defining the clutch hitter, you don’t necessarily want the clutchiest hitter at the plate in the deciding at-bat of the game. A perfectly mediocre hitter could be superclutch, but his production when the stakes are high might nonetheless be lower than that of a great batter with no clutch ability.
Two independent measures
The Run Value of an at-bat gives us a measure of how successful the batter was, without taking into account the base/out situation, the score, the inning. A home run is always considered worth around 1.4 runs and a strikeout close to -.3.
The Leverage Index, courtesy of Tom Tango, on the other hand, summarizes in a single number everything pertaining to the situation, while completely ignoring the outcome of the at-bat. And, most importantly, that number varies according to the potential impact the at-bat has on the final result of the game.
For the perfectly clutch hitter, sorting his plate appearances by Run Value would be equal to sorting his PAs by Leverage Index.
In more technical words, the correlation between the ranking of at-bats by Run Value and the ranking of at-bats by Leverage Index would be one.
In the real world we are going to find a lot of zero-correlations.
Careers
Here are the top 10 clutch careers (data starting from 1974, minimun 2,500 PAs), where the value under the column “clutch” is the correlation between the ranking of at-bats by Run Value and the ranking of at-bats by Leverage Index.
rank     First      Last     clutch
   1    Rodney     Scott      0.068
   2      Bill      Hall      0.057
   3    Willie   McCovey      0.054
   4     Garth      Iorg      0.054
   5     Danny  Bautista      0.052
   6      Jeff  Reboulet      0.051
   7   Thurman    Munson      0.050
   8     Brian Schneider      0.050
   9       Jim   Leyritz      0.048
  10      Mike   Matheny      0.047
And now the chokers (justifying the title of the article).
    First       Last      clutch
   Nelson    Liriano      -0.033
     Mike Lieberthal      -0.030
 Robinson       Cano      -0.030
    Willy    Taveras      -0.029
    Shane  Victorino      -0.028
    David   Dellucci      -0.027
     Eric     Byrnes      -0.025
    Denny    Hocking      -0.024
   Warren  Cromartie      -0.024
      Tom      Foley      -0.024
As you can see even the most extreme performances show very weak correlations (those at the top come out as statistically significant, thanks to the huge sample size, plus the fact that looking for five percent statistical significance many times leads to finding it about once every 20 runs, by definition—but this doesn’t make them strong correlations).
Plotting all the career clutch numbers as a histogram gives us a typical bell-shaped figure, only slightly skewed to the clutch side.

Seasons
David Ortiz’s famous 2005 season is not the clutchiest of the last quarter of century. Though pretty impressive (correlation .153) it’s the 46th on my list, topped by Milton Bradley’s 2000 season (minimum 150 PAs).
     First     Last Season     clutch
    Milton  Bradley   2000      0.232
      Mike  Matheny   2006      0.227
      Jeff Reboulet   2000      0.224
     Randy    Ready   1990      0.204
      Ivan Calderon   1985      0.203
      Rick   Miller   1977      0.200
       Dan    Meyer   1983      0.195
      Luis  Salazar   1985      0.192
       Ben  Oglivie   1981      0.191
    Rafael  Ramirez   1980      0.189
Speaking of Big Papi’s career, here are his seasons with at least 150 PAs.

Season clutch
  1998 -0.048
  2000  0.071
  2001  0.006
  2002 -0.005
  2003 -0.006
  2004  0.007
  2005  0.153
  2006  0.033
  2007  0.008
  2008  0.015
  2009  0.022
In his career, he posted just three seasons with negative correlations, compared to eight with positive correlations.
Other players have constantly beaten zero*, as you can see below.
* From now on, I’m loosely referring to seasons with correlation above zero as clutch and to seasons with correlation below zero as choke. Keep in mind that most of them are actually not significantly different from zero.
    First      Last   clutch seas.   choke seas.
     Dave    Parker             16             2
    Eddie    Murray             15             6
     Omar   Vizquel             15             6
  Carlton      Fisk             14             5
    Ozzie     Smith             14             5
     Paul   Molitor             14             6
     Gary Sheffield             14             7
  Darrell    Porter             13             1
    Manny    Trillo             13             1
     Mark  McLemore             13             2
Anyway, confirming findings by other authors, in general there doesn’t seem to be anything persistent in clutch hitting: Plotting each player’s clutch values in odd years versus the same player in even years we see absolutely no correlation.

Fangraphs clutch stat
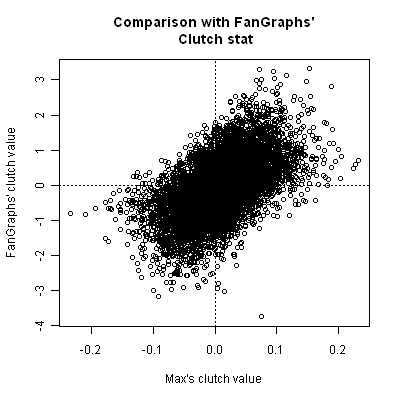
Fangraphs has its own clutch number, calculated differently; but if you read the introduction to the stat, you’ll see the definition of clutch hitting is absolutely in line with the one I’ve outlined a few paragraphs above. Here is a scatter plot of the two different measures of clutch hitting; the correlation is 0.569 (Confidence intervals: 0.555, 0.583)
Eddie Murray
In his celebrated book Weaver on Strategy, the Earl of Baltimore talks about Eddie Murray as a player who constantly delivered in important situations, while taking something off when the game was in the books. Seeing his name high in the previous table supports (however lightly) Weaver’s impression. Murray never posted a season like Big Papi’s 2005, but often had correlations on the positive side (see below).
Season clutch
  1977  0.019
  1978  0.022
  1979  0.004
  1980  0.057
  1981 -0.077
  1982  0.025
  1983  0.028
  1984  0.029
  1985  0.071
  1986 -0.044
  1987  0.008
  1988 -0.067
  1989 -0.009
  1990  0.092
  1991  0.017
  1992  0.028
  1993 -0.046
  1994  0.081
  1995 -0.081
  1996  0.008
  1997  0.005
Perceived leverage, platoon, bullpen usage
Again, leaving aside the debate of whether clutch hitting exists, why don’t we find greater clutch numbers?
{exp:list_maker}Players care about the outcome of the game, but also about their paycheck: When the batting average is used in contract negotiations, a hit in a meaningless at bat has the same weight as a hit in a crucial situation. Thus, it might not be always a good idea to relax when the result is set in stone.
Say you are such a clutch hitter that you can play 20 percent better whenever you think it’s showdown time; your perceived importance of the moment won’t necessarily match with Tango’s Leverage Index values.
If managers used their bullpen efficiently, hitters would often face tougher opponents in high leverage at-bats; they would also likely have the platoon disadvantage.
{/exp:list_maker}
For the reasons outlined above (especially the last one), I would have expected the histogram in the “Careers” paragraph to be slightly skewed toward the choke side, but the opposite is true.
Maybe the cause of this is the selection of players with at least 2,500 PAs, but I did a similar histogram (not shown here) for players with shorter careers and it had a similar right skewed shape. Any idea on that?
Finally a couple of links with the full lists of clutch values: careers – seasons.
References & Resources
Data, including Tom Tango‘s Leverage Index, provided by FanGraphs.
Cyril Morong has a huge collection of links pertaining to clutch hitting.
Good job Max. I like your definition of clutch a lot, very simple and intuitive.
When I was a kid in the late 60’s/early 70’s, everytime one of us would hit a home run with the game already well in hand, we would call it a George Scott. I wonder if Boomer trended towards negative clutch correlation.
Max
Interesting article. Is there any way to convert this to wins? That is, if a player has a positive correlation, how many extra games did his team win due to his good clutch hitting? My guess is that no player can consistently, year in and year out, add a significant number of wins from his clutch hitting.
Thanks for mentioning my “Clutch Hitting Links” page. I should probably update it. Also, anyone who has an article or knows of an article that should be added, feel free to email me.
Cy
Max, I too think it’s very interesting that your graph is skewed to the right. Like you, I thought it might be a sample selection bias, but I guess not.
I don’t know if players perform better in high-LI situations, but I can see that they would perform less well in low-LI situations. Yesterday, Morgan Ensberg posted that it’s against baseball’s etiquette to swing hard when your team has a big lead. Perhaps that’s why we’re seeing that skew.
good job
heres a similar- but not as scientific- an article also labeling cano a choker.
http://www.mlbexpertanalysis.com/blog/?p=46
the article also claims tha joey votto was the most clutch player of 09. where does he come out in your study?
Comment #1: Why couldn’t the skew to the right be explained by the idea that young players “on the bubble” for sticking in the big leagues might end up getting selected for retention or demotion based on their early clutch performance (whether that early performance was significant or not). If chokers get sent down (and they do), your aggregate data will always skew towards clutch, whether or not clutch is real!
The skew-towards-clutch effect would be present no matter where you put your PA minimum, because wherever you set the minimum for inclusion in your analysis, the collective data for everyone’s PA’s before that number will be skewed towards clutch, since you kept the early clutchers, and discarded the early chokers (or, rather, you kept the ones on the bubble who were clutch, and tossed the ones on the bubble who were chokers). However much balanced data you pile on after that, you’ll stay skewed.
Want proof? Have a large group of people flip a coin a hundred times, then get rid of everyone who flipped less than 50 heads. Then have the remaining people keep flipping, and at any point you like from then on, count up your heads %, BUT only count the first hundred flips for the people you retained. If you have a sufficient sample size, you can confidently expect to end up with a heads % > 50%.
Reperform this thought experiment now, but have the initial group flip 75 times instead of 100. Does the outcome change?
Comment #2:
Why is everyone so obsessed with identifying and glorifying clutch hitters (as opposed to clutch performances, which I totally get)?
IF a player is capable of “turning it on” in clutch situations, why can’t they do it all the time? To put it in different terms, if you had a player who raked on Saturdays, but was just average on every other day of the week, how would you feel about that player? You’d probably hate him.
Would your opinion of that player be different if Saturday games were worth twice as much as games on the other days? Now do you love him? Or do you just hate him a little less for not being able to produce every day as if it were Saturday?
Greg, regarding your first point, I personally doubt that players are selected based on how they perform in clutch situations. That may have a slight effect, but overall productivity will wipe out any clutch hitting when it comes to sticking in the majors, IMO.
In your example, heads and tails are the only pertinent outcomes. In this case, clutch performance is a minor detail.
Regarding your second point, what is your distinction between clutch hitting and clutch performance?
You just need one mob scene at home plate after a walkoff homer to get a borderline player another year in the majors. Unless you think that player personnel decisions have been entirely rational and statistically-defensible for the entire Retrosheet era (and you can’t possibly think that)… Now, that sort of thing doesn’t happen all the time, but I don’t think you need a strong effect to get what Max is showing here…
As for the distinction, a clutch hitter is someone who can be expected to do better than his typical level of performance in his next clutch plate appearance. I.e. “clutch” as a personal trait. Some people believe David Ortiz possesses this trait, while some others don’t.
A clutch performance is a home run, base hit or great defensive play that happens in an important game situation. Everyone would agree that when David Ortiz hits a walkoff homer, they have just witnessed a clutch hit.
I’m not saying that personnel decisions are entirely rational all the time, but I don’t believe that several clutch home runs have resulted in a meaningful number of players lasting longer than they otherwise would. Outlandish small sample sizes, a la Hurricane Bob Hazle, sure. Outstanding “clutch” performances? Not so much.
I think that “not trying hard in blowouts” is a much more likely culprit.
BTW, people are fascinated by clutch hitting because they believe such a beast exists, just as they believe it in other sports. It’s part of the general myth of gamesmanship.
One last point: Unless I’m missing something, it’s easy enough to test your hypothesis. Just run the same graph for all years except the first. Make sense, Max?
Let’s say we have two groups of players: good players and bad players.
The good players go all to play in The Show, except a few who are extremely bad in clutch situations (in this case a clutch situation might be an at bat in spring training before cuts are made).
The bad players don’t go to the bigs, except a few who are extremely good in the clutch (again, clutch = cut time).
I can see the chart coming out right-skewed.
Can this be another way of viewing what you’re saying Greg?
Meanwhile I gave a quick look at the issue from the pitching side (don’t know if next article will be on that), and the skewness is more pronounced. Probably separating starters from relievers could give some interesting information on that.
Max, that’s pretty much what I was saying, yes, but I don’t really know if that’s it, because I don’t know if that would create enough of an impact. I think in theory that would generate the right sort of skew, but would it be big enough to explain what you saw? Not sure…
Couple of suggestions:
1) Your top and bottom players seem distinguished mostly by the fact that (I’m guessing) they barely made your PA threshhold. The smaller the sample, the more likely an extreme value, even if the players have no clutch or choke ability. So you might want to post clutch/choke players for different PA bands: 2500-3500, 3500-5000, 5000-7500…. I think you’ll find that the values shrink toward zero.
2) Since there seems to be a small positive correlation overall, you should define clutch and choke in terms of the average correlation, not zero.