Catcher Framing: Does Size Matter, And Is Age Just a Number?
Jose Molina remained an elite framer into his late-30s. (via Keith Allison)
There’s not much I need to say in introduction of catcher framing. The advent of PITCHf/x gave sabermetricians the raw data necessary to discover some catchers could indeed “steal” strikes with positioning and movement of their gloves and the rest of their bodies. In the years since the breakthrough was made, framing has become analysts’ favorite “hidden” part of the game, even if it’s not really hidden any longer.
The importance of pitch framing has led to a search for catchers with this ability, and naturally for any possible short-cut in finding such catchers. One such criterion I have seen suggested is a catcher’s height. Bigger catchers, it is postulated, will have more trouble folding themselves into a good squat and demonstrate more long-limbed awkwardness in shifting their mitts just the right way to bring a pitch into the strike zone.
This idea, even if correct, has some serious problems as a scouting tool. That high school prospect you’re following has very probably not stopped growing yet. He’ll top out only in college or well through the minors. In a few cases, he’ll still have room to grow once he reaches the majors.
These concerns only matter, though, if a catcher’s height matters. That’s what I set out to discover.
Framing by Height
I have two sources of data for my observations: the advanced catching metrics tables at Baseball Prospectus and the catcher framing reports at Stat Corner. BP’s framing tables go back to 2008, while Stat Corner has partial numbers for 2007. Also, Stat Corner records more pitches received by catchers, roughly 20 percent more per season, for reasons not immediately clear. This led me, naturally, to lean on Stat Corner’s bigger data pool a little more. I took both sites’ numbers through the 2014 season, leaving the partial 2015 campaign alone.
When toting up success for each height cohort, I counted it both by strikes gained and runs gained versus the “official” strike zone. The two track each other quite closely, and I ended up going with strikes. Later, I added a normalization factor to count strikes gained against the league average rather than the zone. This was to make it easier for readers to judge the numbers and does not affect relative placing at all.
Catchers’ heights came from Baseball-Reference. These are official heights, which have been known to vary from real heights. It also will fail to take into account any post-callup growth spurts in the younger catchers. There’s really no good way to correct for either, so I have to accept some roughness in the height data. It turned out this wasn’t really a problem.
Using Stat Corner’s figures, I came up with framing rates for the full range of major league catchers, from 5-foot-8 to 6-foot-5.
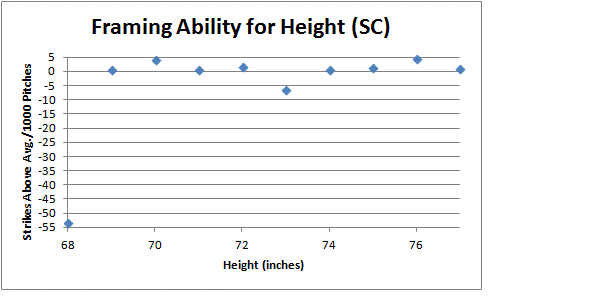
Unfortunately, the chart you see above is actually rather useless. It implies the 1,211 called pitches received by 5-foot-8 catchers (actually just one: Tomas Telis of the 2014 Rangers) are on an even footing with the 578,106 called pitches received by 6-foot catchers. The results need weighting. This can be done visually with a bubble chart, the size of sample represented by the area (not diameter) of the dots.
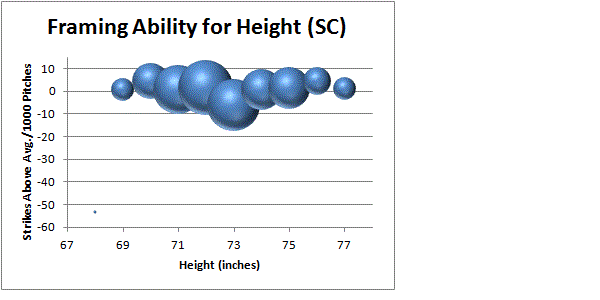
One can also, with some long formulas, weight the trendline produced by the data. Instead of catchers gaining about three extra strikes per 1,000 pitches for each inch they gain, as you’d get with the Telis outlier, they lose around an eighth of a strike per 1,000 for each added inch.
At least they do until you calculate the (weighted) r^2 value: 0.0022. The actual correlation is next to zero. Catcher height has effectively nothing to do with framing ability.
As a check, I ran the numbers with the Baseball Prospectus data and got very similar results despite their being more lenient toward Telis’ poor framing. Both the change in extra strikes for height and the r^2 value were so low, they are for all practical purposes zero.
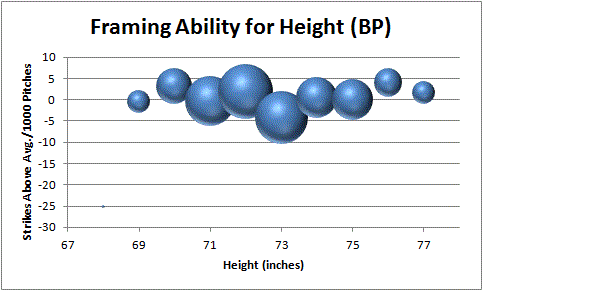
I harbored some worries that a sample size of over 2,800,000 pitches did weird things with the r^2 calculations that I did not take into account. Even so, the eyeball test will not make any real pattern out of the charts above. Also, work you’ll see later gave me confidence r^2 would function properly in this range of sample sizes. When the numbers and my own eyes say the same thing, I will believe them.
So a catcher’s height turns out to have no effect on his framing ability. But perhaps another vital statistic does, one much more certain to change during a catcher’s career: his age.
Framing by Age
A baseball player’s abilities exist in a balance between his physical condition and his experience. The first begins decaying in his early 20s, almost imperceptibly at first but with an inexorable momentum nearly impossible to reverse even temporarily. The second builds throughout his career, all the way back to Little League or earlier, hopefully never standing still.
So it presumably works with catcher framing. A catcher builds his knowledge of the tricks of this trade, while his physical ability to make the perfect little moves it requires is quietly trickling away. The question is which process dominates at what times.
My own intuition is that experience ought to have the upper hand for a good long time. Catchers’ bodies wear down faster than most, but positioning one’s body and subtle mitt movements shouldn’t be too susceptible to that grind. My opinion given, let’s go about getting the facts.
I will start again with Stat Corner’s data and go straight to the bubble chart. This time there is something more for the eyeball test. It’s not so much one pattern, though, as a combination of a few potential patterns.

The cold equations give us no help. The weighted trendline gives us the minuscule number of one strike out of a quarter million lost per year of age, with an r^2 that starts with four zeroes after the decimal. No trend and no correlation.
Baseball Prospectus’ numbers don’t change those conclusions much: one strike per 10,000 lost per year, with an r^2 of 0.025. It looks more conclusive only because Stat Corner’s numbers did such a good imitation of zero, but it’s still the barest shadow of a correlation for a tiny age effect. The chart of framing ability does look just different enough from the other one to merit a glance.
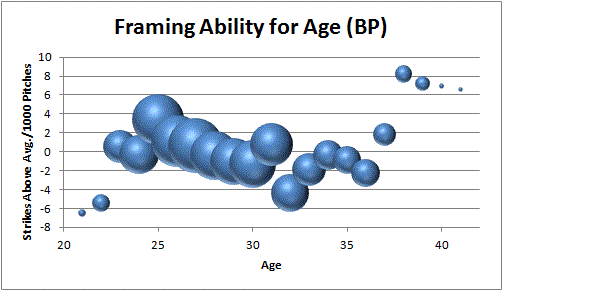
The rise in ability from raw rookie-dom to about age 25 is no longer as straight and clear. A bigger upward hiccup at age 31 breaks up the chain of the downward slide over the middle years. The jump upward starting in the late 30s is not as great. (Note the different scales: the range for BP’s numbers is narrower than that for SC’s.) It doesn’t change the general pattern of an early rise, a long, gentle decline, then a sudden flourish in the sunset years.
Catcher framing appears to go through three distinct phases of development, so trying to force them into a single trendline may be the wrong approach. Instead, let’s separate the long middle phase from the ends and examine it alone. As early and late ages have lower pitch totals than the middle, the cut in sample size is kept under control.
I looked at two age ranges. The 25-to-36 range cuts off before the spike upward for grizzled veterans. The 25-to-32 range stops short of a smaller bump upward and is just shamelessly fishing for the best trendline. It does make a difference, but I didn’t really have to go fishing.
| Catcher Framing By Age |
|---|
| Source | Age Range | Pitches in Sample | Extra Strikes/1,000 per Year | r^2 |
| Stat Corner | 25-36 | 2,365,548 | -0.370 | 0.357 |
| Stat Corner | 25-32 | 1,975,100 | -0.576 | 0.412 |
| BBProspectus | 25-36 | 1,827,726 | -0.447 | 0.526 |
| BBProspectus | 25-32 | 1,536,556 | -0.733 | 0.673 |
The full Stat Corner sample was 2,817,716 pitches; that for Baseball Prospectus was 2,162,107.
The correlation numbers grow stronger the smaller the sample size gets, but even the worst number of 0.357 shows, finally, a meaningful relationship. Not that the trend is a decisive one: Roughly one extra strike lost per 2,000 pitches for each year a player ages isn’t going to turn a lot of games. Over a dozen years it would add up to perhaps one strike lost per game. Not nothing, but not a dominating effect.
The direction of movement is surprising. I expected catchers to gain more strikes as the primes of their careers progressed, accumulated experience outdistancing the dulling of the fine edge of reflexes. It doesn’t happen that way, as aging begins to beat experience pretty early on.
This leaves the early and late ages left to observe. The rise in the early 20s is easily enough explained. Young catchers breaking into the majors are still learning their craft, figuring out the principles of framing. They have room to make long strides with moderate effort. It’s no surprise they improve; the surprise is that the improvement tops out so early.
What happens with old catchers is far less intuitive. They aren’t getting a sudden burst of playing smarts to overwhelm the grinding down of their bodies. What it appears to be is instead a winnowing. Those with something still to offer defensively hang on as catchers a while longer, while the defensive liabilities are shuffled offstage.
There are 22 catchers playing at age 36 in the sample. Eight of them had positive adjusted framing rates, with 13 negative and one right at zero. Go to age 37, and you have 14 catchers. The split is now even, seven to seven. At age 38, five of the eight catchers on the field have positive rates, and a year later it’s five out of seven.
In the age-36 cohort, seven catchers had adjusted rates of -10 strikes per thousand pitches or worse. Just two of them caught at age 37. Meanwhile, eight catchers at 36 had positive rates, and five were catching the next season. The next year the difference is more stark. Four of seven 37-year-olds with positive rates lasted to catch at 38. There was just one catcher at 37 below -10, and it was his last hurrah.
Looking at the actual catchers, one can see this winnowing take place. Jose Molina lasted year after year behind the dish despite his weak bat. Someone with reverse skills, good hitting but poor framing (and other defense), would be a candidate to move to a different position. That is what happened to Jorge Posada, moved to DH at age 39 for the last season of his career.
And the final survivor, all alone at age 40 and joined by two tiny samples at age 41*, is Brad Ausmus. His strength was always defense: just two of his 18 seasons produced a wRC+ above average, while career catching DRS puts him at +80 and TZ at +101. His framing was similarly strong to the end (rates from 2007-10 of +24, +21, +10, +5), which came with him working as a backup on the Dodgers at an age when most catchers have long since put away the mask.
* The other age-41 catchers were Craig Biggio, playing a valedictory two innings at his old position in his final season, and Sandy Alomar Jr.’s final six games with the Mets.
Ausmus isn’t reliably representative, because a sample of one is always suspect. The three previous age groups were all in strong positive territory, though, with much bigger sample sizes, so he’s no outlier. (Ausmus’ framing is part of the data for ages 38 and 39. His age-37 season was in 2006, before the study period.) The Ausmus coda is thus probably a fair representation of the end of the data line.
So age does have its effects. It cuts off the youthful rise in framing experience around age 25, then imposes a long and very gentle recession of skills, broken only when longtime veterans get pared down to those with enduring defensive ability.
If one hoped for a dominating effect from age or height, though, one is disappointed. Age mainly serves to cap the learning curve of novice catchers, and height is meaningless. Anyone looking for a magic formula to find catchers inclined to become framing wizards will have to dig much deeper into other numbers.
As analysts for 30 teams or so no doubt are digging right now.
References and Resources
- Baseball Prospectus and Stat Corner for framing data.
- Baseball-Reference and FanGraphs for added player information.

Minor point: “That high school prospect you’re following has very probably not stopped growing yet. He’ll top out only in college or well through the minors.”
It is rare for boys to continue growing after the age of 18. When you hear or read about “boys growing until they are 21 or even 25” that is a vestige from like the early 1900’s.
Major point: You must use the “delta method” for framing and aging if you want to see how framing changes with age and not just average framing at each age or group of ages for different pools of players.
Interesting analysis–definitely looks like it took a lot of legwork!
Two points, however, that make me skeptical of the conclusions:
1. You’re dealing with significant selection bias with catcher height given that the only catchers included in the sample were the ones whose defense was presumably good enough to make the majors in the first place. In order to make a strong statement about height, you’d actually have to look at the total pool of drafted/signed players who started as catchers, an understandably daunting undertaking.
2. As Mitchel Lichtman mentioned above, to make conclusions about the effect of aging on framing you’d want to use the delta method (that is, looking at year-to-year changes for individual catchers). Using group averages opens you up to survivorship bias that’s going to be especially acute at both extremes of the age spectrum. What, for instance, the only catchers who play until they’re 38-39 are excellent defenders?
I enjoyed reading your post on framing with relationship to height and age, even if there was no huge “ah-ha” involved. Just enjoy me good analysis, that’s all.
I had a thought that came up in response to this. Not sure if this is even possible (particularly getting the age part), but as a man of a certain age, I’ve reached that point where my vision is going and I need even more eye correction devices (reading glasses), and from what I understand, this affects my peripheral vision. As someone who works in front of a computer all day, that’s not a big deal, I just move my head, but for umpires who are calling balls and strikes on 90-100 MPH pitches that can shift millions of dollars one way or another because of their mis-calls, it could be a big deal.
So I was wondering if there is a way to get the age of the umpires and analyze their ball/strike calls and see if there is an age relationship with errors in calls being made. Maybe it is a mixture of framing as well as umpire age. Maybe umpiring is a young eyes game?
And if there is errors in pitch calling, then maybe that affects call in other plays as well. Review has just started, so SSS, but we can at least see if older umpires are the ones who are getting calls reversed more often than younger ones, I would think and track this long term.
At first I thought you were going down the path of using deteriorating vision as a possible factor in catchers’ framing ability (offsetting the presumed benefit of experience).
If only the age distribution of umpires had enough overlap with the age distribution of catchers, you might be able to give some credence to my argument above (though far from conclusive, given all the differences between the catcher’s role and the umpire’s role)
I agree, you must use the delta method.
You can re-run what you did for pitcher ERA, hitter SLG, and you’ll be surprised at the results. It’s the survivorship problem that we talk about all the time.
Okay, it looks like I have more work to do. That will start with finding an explanation of the delta method that doesn’t make me reach for the aspirin bottle. Give me a little while on that, though.
On your minor point, Mr. Lichtman, I will put up at least a bit of a struggle. I have some family history of growth after the high-school years. My uncle didn’t stop growing until late in college, and I myself am an inch taller today than I was at age twenty, when I thought I was finished growing. Rare, perhaps, but that’s what informed my statement.
I also recall the example of David Robinson, who was 6’6″ his senior year of high school and ended up being 7’0″. I’m sure it’s not common, but it probably happens sometimes:
https://en.wikipedia.org/wiki/David_Robinson_(basketball)#Early_life
After high school I grew about 2-3 inches vertically, and about 7-8 inches horizontally.
Well, as such a rare occurrence, that does make it something that could be scouted had there been such a correlation. Personally, I stopped growing at 16, although I’m still an above-average 5’11”.
Besides, isn’t there something called growth plates that can determine whether or not someone is done growing? It wouldn’t be too hard for scouts to get that kind of medical data.
We count only framing chances; pitches that are > 0 % probability of being a strike in that given season. Hence the lower numbers.
Are you guys really trying to refute my statement, “It is rare for boys to grow after the age of 18” with anecdotes about how your or someone you know grew after the age of 18? Really?
Here’s another one: “It is rare for men to be above 6’5″ tall.” Now, you can all tell me about the people you know who are taller than that to prove I am wrong…. 😉
Actually, it isn’t rare at all for a young man to keep growing past the age of 16.
69.1, 69.3, 69.6 and 70.2 inches are the 50th percentile heights in the US for ages 16, 17, 18 & 19, respectively.
http://www.cdc.gov/nchs/data/series/sr_11/sr11_252.pdf
I would also say that it is not rare for boys to keep growing after the age of 12. But, I said 16 not 18.
I would guess that if you had access to modern data, you would find that less than 50% of boys grow after age 16. Could be wrong about that. I am 100% confident that less than 50% of boys in the US grow after the age of 18.
In any case, a growth table will not help you with that. Each data point is a different pool of children. It’s like trying to construct an aging curve in baseball without using the delta method.
In fairness to Shane, he said:
“That high school prospect you’re following has very probably not stopped growing yet. He’ll top out only in college or well through the minors.”
If “high school prospect is mostly 14-16 yo, then that statement is probably correct.
However, if most are around 18, then it is definitely incorrect – the “have probably not stopped growing yet.”
It’s funny how truisms can remain in effect for a long time even when they are no longer true. My parents used to say that boys continued growing until 21. I knew that was not true at the time just from looking at all my friends (virtually no one kept growing after high school) and it is certainly not true 35 years later. Maybe it was true in the 1700’s or 1800’s. I don’t know.
I also knew a guy who was 6’0″ at age 10, and is still 6’0″ decades later….
But anyway, I’d love to get the aging curves on players’ true weights. I’d guess an average gain of 10 lbs. from age 20 to age 30 and 20 lbs. from age 30 to age 40, with about 5% of guys putting on 50 lbs. or more.
The headline had me anticipating a discussion on Pudge Rodriguez (5’9″) or Larry McLean, at 6’5″ the tallest MLB catcher for 862 games and five teams at the turn of the century ( and a unique death after his playing days!). I’m not disappointed–I am now on the watch for framing receivers.
MGL: For my part, I was trying to explain how I got a contrary impression. To wit, I had multiple examples from my own family, and I assumed that there was nothing all that unusual about my family.
Did a little research. Most of the time boys stop growing taller in the 18-to-20-year-old range, but some continue to get taller into their mid-twenties under normal conditions. (I believe there are some disorders that result in humans continuing to grow indefinitely, but that is not relevant to this issue.) High school kids are getting signed in the 17-18-year-old range, so some of them will get taller.
Do keep in mind that players from the Caribbean tend to be signed before that end-of-growth window. The minimum signing age is 16, though in the past some kids have been signed as young as 13. This is very relevant for this player pool. A lot of these kids will be poor and getting regular nutrition and medical service are related to height, so they might grow more than you would expect.
Yes, of course SOME of them keep growing after age 17-18. Most do not. In the US at least.
Height may be a relative advantage, insofar as longer arms usually accompany. Longer arms allow catching pitches farther forward, particularly low, sinking pitches ( change, curve, 2-seam, splitter) which may be turned into strikes. The farther forward the pitch is caught, the better view the umpire has as well. Scouts should measure arm lengths as well as height.
Come to think of it, It’s reasonable to hypothesize that height (and arm length) may be a wash overall, but relevant for certain pitches in certain locations. Perhaps the tall receiver gets the low strike with greater arm extension, and the shorter receiver gets the High pitch with less blue-view obstruction.