Creating Aging Curves for Statcast Metrics

Nelson Cruz is seeming the exception to the rule when it comes to exit velocity and aging. (via Keith Allison)
MLB Advanced Media’s 2015 public release of Statcast metrics carried with it a lot of promise for the future of baseball analytics. It introduced exit velocity — how hard the ball is hit off the bat — and launch angle — the vertical angle above or below the horizontal plane parallel to the ground. These metrics are all over broadcasts now, because they are intuitive to a viewing audience. With launch angle and exit velocity, we’re talking about things fans can plainly see: where the ball is going and how fast it’s going there. These metrics are also useful for creating the expected statistics xwOBA and xBA, which do appear to have predictive power, at least for hitters.
Now that we have four and a half years of data at our disposal, we can get a good picture of how exit velocity and launch angle change as a player ages.
Aging curves are a crucial part of projections, affecting our expectations of how the future will come to pass. Setting expectations is the method we as fans use for knowing how we feel about the sport we’re watching. When Ketel Marte all of a sudden becomes an All-Star starter or Mike Trout sits atop the WAR leaderboard again, we know how to feel about it because we’ve set our expectations. Understanding aging in baseball creates more accurate expectations, which helps us feel validated more often but it will also increase the level of surprise we feel when we see the outlier cases on the tails of the distribution.
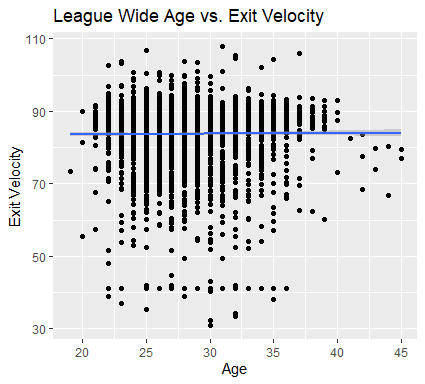
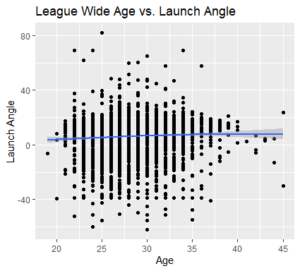
Aging curves are not simply observing which players at a given age have the best production across the league in a given year. There is not much of a relationship between age and any given statistic on a major league-wide level, certainly nothing resembling a curve. If anything, there are fewer older players who perform below the mean. This is due to survivor bias — a concept we will return to later — not because players get better until they retire. While Nelson Cruz is hitting balls harder in his age-38 season than the average 28-year-old, he presumably is not hitting the ball harder than himself at 28. Aging curves, then, must be a comparison to one’s previous performance in order to understand how an individual’s abilities are likely to change over time.
How best to quantify the baseball aging curve is a topic of much interesting discussion, but I used Tom Tango’s delta method, summarized beautifully here by Mitchel Lichtman. Essentially, we are taking every player who played in consecutive seasons in the available data, showing the difference in their launch angle and exit velocity from one season to the next, then putting that difference into the bin for the age of the player’s second season. Using the second age of any player who has batted in back-to-back seasons since 2015, we have at least 30 cases of players from age 23 to 36 to make inferences from. Once all the differences are calculated, there is a weighting for the amount of playing time of the player and an average is taken for all of the ages. I used the minimum number of balls put in play in the two seasons, since the statistics are based on this sample of plate appearances.
The first table below has columns for the second age in the couplet, the average difference in launch angle and launch speed (exit velocity), the number of observations in the sample and then the cumulative score to be plotted. The second table has the same information, but this time playing time weights are included in the average scores.


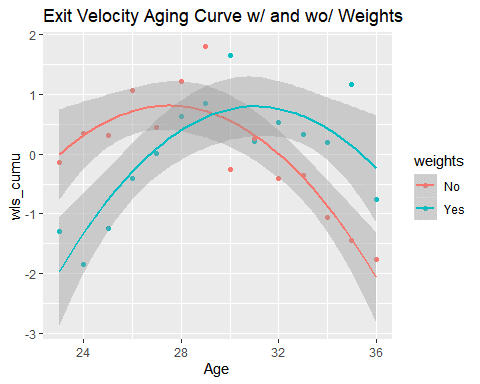
If the weights matter, why include the first table? There are two reasons. First, in the case of launch angle, the weights don’t actually have much of an effect on the shape of the curve, and the average difference from age to age is easier to interpret. Second, there is actually an odd discrepancy in the case of players aging from 29 to 30 when the weights are included on the exit velocity statistic. As can be seen in the chart below, the peak age for exit velocity without weights is approximately 27.5, but when accounting for playing time, the peak age shoots all the way up to 31. The y-axis in this graph is scaled, but you’ll notice a huge difference in the age 30 data point, well below both trend lines without the weights and well above both lines with the weights.
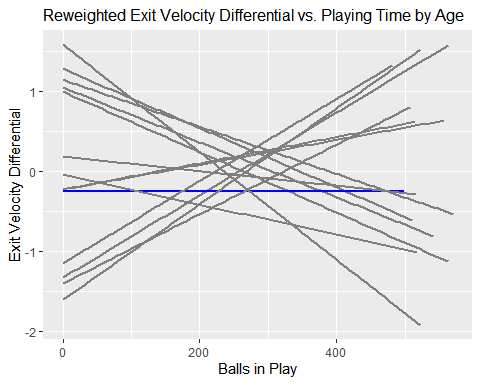
This disparity suggests there is something happening in the relationship between exit velocity difference from one season to the next and the amount of playing time a player gets. It might be that as a player gets older and their performance decreases, he is less likely to get another chance at more playing time. However, this does not appear to be the case, as there is no trend in the relationship between exit velocity and playing time. No matter what age is chosen, playing time has no predictive value on the exit velocity differential from year to year except at age 30, as can be seen by the blue trend line below.

This is almost certainly a statistical outlier and when more data is available, the trend line of this relationship will be random around zero as is the case with the other larger samples collected. To account for this noise, the relationship between exit velocity and playing time at age 30 is regressed toward the mean of the other 13 ages collected, which is depicted below.
With the more normal reweighted data, we can once again calculate the average weighted difference from year to year and see how the curve looks.

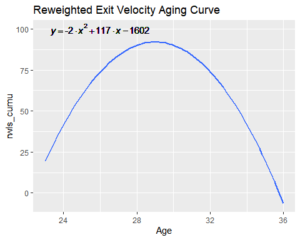
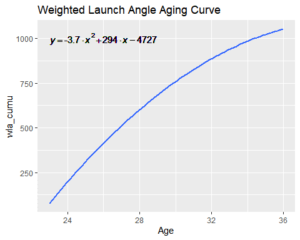
The new weighting puts the peak exit velocity age squarely at age 29 with a longer down slope than rising one, as is the case with many other skill-based metrics. The y-axis in both cases has the playing time coefficient attached, making them harder to interpret. However, the absolute value of the coefficient attached to the squared term affects the width, where smaller values are more narrow curves and larger values flatten the curve out.
These coefficients, then, tell a different story about how these metrics change as a player ages. The launch angle statistic metric monotonically increases as a player gets older, which is only a good thing to a point for player performance — launch angle itself has a quadratic relationship with performance outcomes like wOBA. Exit velocity, however, has a positive linear relationship to performance, implying that a player after his age 29 season tends to experience a decrease in exit velocity which inevitably affects performance negatively.
One important note is that this method does not account for survivor bias, which would theoretically flatten the curve out and push the peak toward the right. Survivor bias is derived from the idea that due to variance of on-field production, some marginal true talent players will overperform their skills and some will underperform in a given year. As a consequence, those who underperform may not show up in the data the following season, while the overperformers will. Both would be expected to regress to their true talent, but only the overperformers regressing downward are captured. An approach to combat this is to create a phantom season for all the players who don’t return, with their exit velocity or launch angle expectation to capture the positive regression of the non-survivors. The trick is creating those expectations and I don’t have a method for reasonably projecting them currently.
An additional consideration which will become feasible only with more data is to create an aging curve for categories of players. These categories could be by playing time to try to capture aging curves of different true talents but they could also be by position or some other variable of interest. At this point, though, the samples become much too small for good statistical inference with the amount of public data we have.

With this knowledge now in hand about how exit velocity ages, we as fans can realistically set expectations that our favorite players are not likely to keep increasing their exit velocity past age 29. Analogously, if a player already has an average launch angle above the optimum, age is not the variable that will console a fan hoping for more line drives. This, of course, works in the other direction as well: Players are likely to improve their exit velocity while they are still young. They are also at almost all ages likely to increase their launch angle, useful for someone hitting too many ground balls like Vladimir Guerrero Jr. is now.
While these insights are true about the baseball population as a whole, the variance of an individual player’s results is high enough that there will be many non-smooth or even non-quadratic career trajectories. And although we may not be able to currently predict whose career will defy the expectations laid out in this research, we can expect someone will. That will be another reason to continue researching, watching, and enjoying this sport.
Some many variables complicate this discussion, including the infamous baseball, improvements in tracking technology, and the differences in the velocity of pitchers. Also, although hitting the ball harder correlates to relative production, by removing non-contact from the equation, exit velocity could favor older players, who, despite declining reflexes, have more knowledge. For example, an older vet may make more and better educated guesses. When he is right, he will hit the ball very hard, but when he is wrong, he will swing and miss or take a called strike. If, as a younger man, he was less prone to guess, he may have had more contact, but less proportionally valued exit velocity.
That’s a good point, exit velocities are just one piece of the puzzle when it comes to production of a batter. It may interesting to see how the distribution of a player’s exit velocities changes as they age rather than just the average. If that hypothesis is correct, you might expect to see a flatter distribution with more really hard hit balls but also more soft hit balls. As for the non-contact perspective, do know of any research on plate discipline statistics like contact% and swing% as players age? I imagine these would be difficult due to a high susceptibility to survivor bias.
Sure, but eyesight and bat speed/strength decline with age as well, and you could reasonably expect those to degrade the contact quality as well. Depending on the magnitude of the effects relative to each other, knowledge may be outweighed by an inability to apply that knowledge as physical skills decline.
I wonder how much these metrics are tracking two entirely different things.
First, velocity. Velocity follows a very common sense pattern. A player’s physical abilities peak and then decline, probably earlier than the velocity peak. But their mental skills continuously improve, pushing the results peak a bit beyond their physical aging curve. Totally expected.
Second, launch angle. We are living in the launch angle revolution! An increase in launch angles with age may have little to do with age itself, but rather reflects a larger portion of the player population joining the revolution. It could be a general adoption, or it could be aging players selling out for power to compensate for other declining physical skills. Or maybe it is more directly age related, a reflection of players whose knowledge improvements allow them to better strike the baseball. Needs more research.
Could the difference be due to something like conflating accuracy with precision.
Thanks a bunch for the confidence intervals.