Evaluating catchers: Quantifying the framing pitches skill
Catchers’ ability at framing pitches is a skill that, since the advent of PITCHf/x data, seems so close to being understood and measured. Several analysts have given first passes at the issue (Dan Turkenkopf in 2008, Matthew Carruth and Bill Letson in 2010).
Following is another contribution on the subject, which will give a rough estimate of the runs a catcher might save in a season thanks to this particular ability. A file with catchers’ ranking is available at the end of the article.
Definition and problems
The framing skill will be measured here as the increased (or decreased) probability of a pitch to be called a strike due to the presence of a particular catcher behind the plate. Obviously it is not easy to isolate the receiver effect from the rest of factors influencing the final umpire’s decision. Otherwise, a framing measure would have been around for some time now.
Several components concur and interact in the outcome of a pitch not swung at. John Walsh has shown how umpires tend to be “compassionate”, give the benefit of doubt to the batter on two-strike counts, while helping the pitchers when they are one ball away from issuing a walk. Other than their merciful nature, umpires are individuals and each has his own peculiar strike zone. Some of them are known for being pitcher friendly, while others are particularly stingy at calling strikes.
Pitchers also have different abilities of getting a favorable call on borderline pitches. Tom Glavine, for one, was able to expand the strike zone inch after inch (at least that was his reputation). Also, different kind of pitches, due to their particular movement, have unequal chances of being declared strikes.
Finally it is possible that the batters themselves can influence the call, because of their stance or their established reputation as selective hitters or free swingers.
Tools and technique
Since the nature of the subject is full of complications, this analysis focuses on a selected part of the problem. Only outside pitches to right-handed batters will be considered. Let’s go step by step in selecting our subset of data.
Pitches are selected such as their height is unlikely to influence the strike call. Mike Fast has recently shown that nearly every pitch delivered between 2.2 and 3.0 feet of height is called for a strike if it’s thrown to the fat part of the plate. The charts below show the chance of pitches at that height of being called strikes, as a function of their horizontal location.
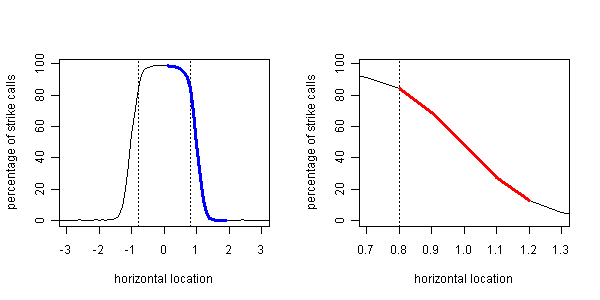
Focusing our attention to the outside part of the plate (thick blue line in the left chart), we see the probability of a called strike has sort of a sigmoidal trend: It’s constantly close to 100 percent in the fat part of the plate, and constantly close to zero from two feet outside on. The uncertainty is in the zone in between, which has been zoomed and marked with a thick red line in the right chart: Here is where the factors mentioned before, including the catcher’s skill, come into play. Thus pitches (every one recorded by PITCHf/x from 2007 to the end of May 2011) in that zone are considered for this analysis.
To deal with pitcher-catcher simultaneous effects on wild pitches and passed balls, Tom Tango has widely used a technique he dubbed With-Or-Without-You, shortened to WOWY. In a previous article I proposed an advanced statistical technique which makes possible to take care of more-than-two-ways interactions. In that case it was possible to measure the base stealing game giving appropriate credit to pitchers, catchers and baserunners.
Here the multilevel logistic regression with crossed random effects (that’s the name of the technique for those who want to check) allows us to apportion the difference in called strikes probability among umpires, pitchers, catchers and batters.
Results
Before ranking the catchers, it’s useful to check if the estimated effects of other (more known) factors make sense. According to the model, the chance of a borderline pitch to be called a strike decreases of about 20 percent for every inch it gets further from home plate. So far so good.
Below is an estimate of the change in probability according to the ball-strike count (The 0-0 count is set as the reference).
count  prob change
 0-1       -16
 0-2       -19
 1-0         4
 1-1        -7
 1-2       -12
 2-0         8
 2-1        -4
 2-2       -11
 3-0         2
 3-1        -7
 3-2        -7
The results are quite in line with the previous knowledge, as the player who is behind in the count usually gets the favorable call. The 3-0 value is probably lower than one would expect after having read Walsh’s work.
The umpire ranking resembles the one by Jeff Zimmermann at Beyond the Boxscore”>Jeff Zimmermann at Beyond the Boxscore (circa 2010), with Brian O’Nora, Brian Runge and Wally Bell outlined as pitcher friendly and Paul Schrieber, Gerry Davis and Adrian Johnson among the stingiest.
Regarding pitchers, I did not know who to expect at the top and at the bottom of the list. Since Tom Glavine is always cited as a pitcher who could get the call on borderline pitches, it’s reassuring to find his name in the above-average part of the ranking (though not at the extreme).

The most likely to get a questionable call their way are, according to the model, Francisco Cordero, Jake Peavy and Chris Young. The least likely, on the other side, are Max Scherzer, Jonathon Niese and Jonny Venters.
What to expect in the batters’ table? A great hitter like Albert Pujols being among the ones getting the benefit of doubt should not be a surprise, perpetrating a decades long tradition best symbolized by Hall of Fame umpire Bill Klem’s address to a rookie pitcher: “Son, when you throw a strike, Mr. (Rogers) Hornsby will let you know it”.
Finding a selective hitter like Marco Scutaro on one side (getting the benign call) and noted free swingers like Vladimir Guerrero and Jeff Francoeur on the other is also expected (however there doesn’t seem to be a correlation between hacking tendencies and rank on the list).
Since the model seems to give sensible results for the other factors, it’s quite likely that what we will see for the catchers is a decent approximation of the truth as well.
Catchers
Since logistic regression results might not be of immediate interpretation, what you will find in the Excel file below has gone through a sort of translation to make it easier to understand.
Thus the four sheets in the Excel file (80 Kb) report the difference in probability due to the particular player (or umpire) involved.
The magnitude of variation is highest for pitchers and lowest for batters, with umpires and catchers in between and quite close between them.

It makes sense that batters are less likely to influence the call since, other than their stance, there should be nothing they can do to play a role in the outcome. It also makes sense that the pitchers have the most power on the call, as they are the ones delivering the ball and imparting the (possibly deceiving) trajectory.
The fact that umpires and catchers have a similar range of variation implies that playing with a receiver who is good at framing pitches is the equivalent of having a pitcher friendly umpire calling the game.
Games won thanks to framing pitches
Let’s do some back-of-the-envelope calculations. A top catcher at framing pitches, such as Russell Martin, improves the chances of a borderline pitch to be called a strike of roughly 20 percent. Since the difference in run value between a ball and a strike has been estimated around 0.13 runs (see the References and Resources section at the end), a skilled catcher might be worth 0.026 runs on a single borderline pitch.
In the data used for this analysis, each game contributes on average four pitches. That is, there are four borderline pitches per game on the outside corner. Let’s conservatively guesstimate a total of eight when we add the inside part and the upper and lower border of the strike zone. Then divide by two, to apportion the borderline pitches between the two teams playing the game. That makes four uncertain pitches a game where the catcher can make the difference.
Martin caught 97 games in 2010. Multiply that by four pitches and by 0.026 runs and you get 10 runs in a limited number of games.
According to this analysis the top catchers can win a ballgame per season (even playing fewer than 100 games) only with the skill of framing pitches.
If you think that’s a lot, I’m with you.
Anyway, let’s look at that from a different perspective. Please re-read the last sentence of the previous section. The fact that umpires and catchers have a similar range of variation implies that playing with a receiver who is good at framing pitches is the equivalent of having a pitcher friendly umpire calling the game. Now, suppose you are allowed to have every game called by an average umpire when your team is at the plate and by the most pitcher-riendly umpire when your team is pitching. Does an extra win per season seem an acceptable effect of having such an advantage?
Reliability, assumptions and limitations
Replicating the analysis on two subsets of the data (even-numbered caught pitches and odd-numbered caught pitches for every catcher) we get pretty stable results: The correlations of the catchers’ effect calculated in the two subsets of pitches is a solid 0.76.
The pitchers’ effect shows a similar stability (0.75), while the batters’ expected effect returns a lower correlation (0.40). Finally, the umpire effect lends the highest correlation (0.89) between the two subgroups, a good indicator of individual consistency.
As it always happens when building models, some simplifications have been made.
Here the “compassionate effect” is modeled as constant among umpires, while probably each man in blue has his own peculiar way of expanding and shrinking the zone according to the count. Also, while the probabilities are adjusted by the type of the pitch, again it is assumed that umpires react uniformly to the different behavior of fastballs, curves, and the rest.
Similarly the catchers’ skill is measured across the board; in other words, the model does not consider the possibility that one backstopper can be awful at framing fastballs but very competent on offspeed pitches. Plus, when doing the back-of-the-envelope calculation of saved runs, we implicitly assumed that catchers have equal skills on pitches outside and inside, high or low.
While the aforementioned assumptions do somewhat simplify the reality, it would be very difficult and computing intensive to add those individual variations in a model, as the one used for this article runs for hours.
Final remarks
According to the analysis presented here, the best catchers at framing pitches can add something like one or two wins per season, which is the equivalent of trading Alex Rodriguez’s 2010 bat (.270/.341/.506, 30 HR, 125 RBI, 19 runs above replacement) with Alex Rios’ lumber in the same year (.284/.334/.457, 11 HR, 45 RBI, nine runs above replacement).
The number could even be a conservative estimate. In fact, as soon as a pitcher realizes his catcher gives him an edge on borderline pitches, he should immediately begin to exploit the advantage.
If the magnitude of the framing effect measured in this study is confirmed, major league teams should not neglect this factor when they go hunting for a catcher in the market, especially those with pitching staffs that make their living on the black.
References & Resources
PITCHf/x data by MLBAM, corrected using the author’s algorithm.
Dan Turkenkopf on the value of switching a ball to a strike.
John Walsh on pitches run value.
Craig Burley on the benefit of throwing a strike, by count.
Nice job Max!
I don’t know if you saw Mike Fast’s article from February that looked at framing and attempted to correct for a pitcher’s tendency to throw to the edge of the zone (http://www.baseballprospectus.com/article.php?articleid=12965).
He found about the same range of value as you did – +/- 10 runs from average, which is certainly more believable than what Bill and I found.
Peter, he actually conservatively doubled, not quadrupled:
You were probably as excited as I was in reading this article to have missed the nuance!
Wow, Max. What a great article.
In the data used for this analysis, each game contributes on average four pitches. That is, there are four borderline pitches per game on the outside corner. Let’s conservatively guesstimate a total of eight when we add the inside part and the upper and lower border of the strike zone. Then divide by two, to apportion the borderline pitches between the two teams playing the game. That makes four uncertain pitches a game where the catcher can make the difference.
Max – Doesn’t the above just take into account Right handed batters? Don’t you also have to add the opportunities with left handers too? Using my uncorrected Pitch Fx PX locations and the same .8 to 1.2 interval that you used, I get a distribution for RIGHT_OUTSIDE of 31081 pitches, RIGHT_INSIDE – 21943, LEFT_OUTSIDE – 34711, LEFT_INSIDE, 11663. So The RIGHT_OUTSIDE condition you investigated represents a little more than 31% of a catcher’s total inside outside framing opportunities. Of course, there may be considerable variation between catchers for this percentage depending on the tendencies of the pitchers that he catches.
Great work, Max.
It’s comforting to see Livan Hernandez near the top of the pitchers list.
Terrific work, Max. I even understood it all. Thanks.
Peter, you’re right, I neglected the effect on lefties.
Dan, I had missed Mike’s article.
All, thank you for your kind comments.
A superb article Max! The best yet on catcher framing ability. A couple of things for you to consider. Just as umpires seem to have differing abilities in calling the inside pitch or the outside pitch it is possible that catcher’s have differing abilitis in framing the pitch depending on location. To take a catcher’s added run value for outside pitches and multiply by four to get his total run contribution is probably overstating his contribution. Second, there is great variation in the run value of changing a ball to a strike dependent on the ball-strike count. It would be impossible to to the type of analysis that you did for every count, but it might be beneficial to divide 0-0 count where the benefit is very low from non-first pitch counts.
Third, it might be interesting to extend your analysis to the area inside the plate (.65 to .80) to see if the decrease from 95% to 85% strike call rate is affected by catchers with bad framing ability failing to get a strike call.
Just checked my unpublished research on a Catcher WOWY for runs saved by catchers by framing and pitch selection. It doesn’t take into account the many factors that your analysis does, relying instead on the aggregate career stats to even out everything except the pitchers the catchers worked with. I have Russel Martin as the 5th best catcher at 12.8 runs saved per 130 games.
Max – There is an alternative explanation to the compassionate umpire theory of why batters seem to get favorable calls from umpires in pitcher’s counts. Your study is lumping all balls between point .8 and 1.2 px as a single category. It is possible that behind in the count a batter will be more likely to swing at the balls within that interval that are closer to the plate in order to to protect against the called strikeout, leaving more balls farther away from the plate which are correctly called “balls” by the umpire at a higher rate.
Holy Moly, this is fantastic work Max. I need to sit down and think really hard about this – I think the findings cohere with some of the basic “a priori” analysis of catcher framing that I had done in the past – in particular, I think four pitches is an exactly right ballpark estimate, and I think relying on Dan Turkenkopf’s run value estimates is a good move, as they smell right to me.
Sweet work.
Great article Max
MGL, the compassionate umpire effect is harder to explain away than that.
First of all, John dealt with some of your concerns in his original article.
http://www.hardballtimes.com/main/article/the-compassionate-umpire/
J-Doug addressed a number of them in his follow-up research.
http://www.beyondtheboxscore.com/2010/12/24/1892898/benefit-of-the-doubt-odd-patterns-in-umpire-compensation
http://www.beyondtheboxscore.com/2011/1/5/1915896/benefit-of-the-doubt-the-cruel-umpire
I also looked into some of them in my article, which Dan linked in the third comment up above.
I agree we’re not to the point of understanding why it’s happening yet, but the things you suggest don’t seem to explain it.
A common explanation for the “compassionate umpire” effect is umpires’ aversion to determining the outcome of the PA. I think that’s pretty clearly wrong. First, while a second strike does tend to reduce the chance of a called strike, getting to ball 3 does NOT reduce the chance of a called ball on the next pitch. Also, going from zero to one strike significantly reduces the strike probability, even though calling strike 2 does not end the PA.
I don’t know what the answer is, but I suspect a big part of the answer lies in umpires’ expectations. The more they expect the pitcher to throw a strike, the more likely they are to call one. And the hitter plays a role too: at 0-2 we expect the hitter to swing at anything close, so if he doesn’t it seems more likely to be a ball (especially a good hitter).
One other thought: Perhaps varying strikezones (by pitcher and umpire) helps explain the mystery of hitters’ improved performance as they face starters additional times-thru-order. It never seemed plausible to me that familiarity with the opposing pitcher could explain this (unless pitchers do an extremely poor job of randomizing pitch selection). But increasing familiarity with the definition of the STRIKEZONE (that day) could make a big difference to hitters.
Alternatively (but less likely), maybe an ump’s strikezone actually shrinks over the course of the game. For example, if he became more aware of how the catcher was framing that pitcher’s pitches that day, the ump might squeeze the pitcher slightly more in the 6th inning than in the 1st inning. It would be interesting to see if umpires’ strikezone tends to be any larger/smaller based on inning of game (if someone hasn’t already studied that).
Max – There is an alternative explanation to the compassionate umpire theory of why batters seem to get favorable calls from umpires in pitcher’s counts. Your study is lumping all balls between point .8 and 1.2 px as a single category. It is possible that behind in the count a batter will be more likely to swing at the balls within that interval that are closer to the plate in order to to protect against the called strikeout, leaving more balls farther away from the plate which are correctly called “balls” by the umpire at a higher rate.
I never bought the compassionate umpire theory. I forgot the methodology used in that research but Peter is right. In addition, and more importantly I think, pigged thrown at 3-0 counts will be much closer to the low end (closer to the middle of the plate) of any location interval/category than pitches thrown at pitcher’s counts, so unless your study controls for the exact location of each pitch (probably to within less than an inch), the results are going to be biased and will always show a compassionate umpire effect.
In fact I think that conventional wisdom is more likely to be correct. When a pitcher is wild, which will tend to be the case at 3-0 counts, the umpire is LESS likely to call a borderline pitch a strike. And of course vice versa at 0-2 counts.
Pigged=pitches. Autocorrect on iPhone…..
Peter + MGL,
I have selected pitches from .8 to 1.2 ft from the middle of the plate, but I have not lumped them together. I retained the actual pitch location, so whatever effect came out (for example the pitch count effect) should not be a byproduct of different locations of pitches in different counts.
Guy, as far as batters becoming familiar with the strike zone and/or umpires shrinking the zone (which is easily verifiable with the pitch f/x data), that would imply that relievers would not have any advantage when they come in late in a game. That clearly is not the case so I don’t think those things come into play. I think it is simply batters being familiar with a pitcher’s repertoire, etc.
@ChrisJohn, the perspective I took in my article was not so much that catchers were framing balls in order to turn them into strikes as much as it was the umpires calling the zone relative to the catcher’s target, such that if the pitcher hit the glove, even if it was slightly outside the edge of the plate, the ump would call a strike, whereas if the pitcher missed the target by a foot and a half, even if he nicked the edge of the plate on the other side, the ump would call it a ball.
@Guy, I meant to mention earlier than Dan had studied the size of zone by inning here:
http://www.beyondtheboxscore.com/2008/5/12/506919/a-nibble-here-a-nibble-the
MGL: I don’t agree. It seems from the data that Max, Mike and others are presenting that each pitcher-umpire-catcher combination will have a unique strikezone (actually, each pitcher-hitter-umpire-catcher combination). I’m suggesting that hitters’ understanding of that zone improves over his PA, such that he does a better job of swinging at pitches that will be called strikes. When a reliever comes in, it is true of course that the ump and catcher remain the same. But the new pitcher will have different ways of working the zone, and thus a somewhat different strike zone.
I didn’t mean to suggest that familiarity with the opposing pitcher couldn’t also be part of the answer. But I think learning the pitcher/ump strikezone might be part of hitters’ in-game improvement.
As a former college and professional catcher, I though I’d toss in this thought on the effect of framing (indeed there’s talk of little else around the catchers’ water cooler): the benefit of framing has little to do with the pitch that was just thrown (though spasmatic lunging probably does have a negative effect). You rarely, if ever, try to steal strikes since most, though not all, umpires have decided what the pitch is before you catch it (plus, they generally feel you’re showing them up with conspicuous strike-stealing). Framing isn’t about stealing strikes, it’s about not losing them.
That an umpire has decided, however, does not mean he’s certain; a candid ump would say he is making his best guess on 10-15% of pitches (especially on pitches away from where he’s set-up). Thus, from my experience, you frame pitches not to get the instant pitch, but, by gently showing the umpire that he blew a call (or was right), you later on get the same pitch called (or a make-up call), or prevent the hitter from getting the same.