Fast in April, slow in September?
Max Scherzer’s fastball averaged 94.1 mph back in April; last month it was clocked at 92.4 mph.
On the other hand, the radar gun (well, Sportvision tracking system, actually) showed 90.4 for Ross Ohlendorf’s heater when the season started, 92.5 in September.
Which of the two is more typical for major league pitchers? Do they begin the year a bit rusty, then go on a roll, or do they start fresh and slowly wear down?
I went to my PITCHf/x database and selected the four-seam fastballs, trusting in MLBAM classification algorithm. I rescaled the speed to every pitcher’s average four-seamer. In other words, if Roy Halladay this year threw his fastball at an average speed of 92.4 mph, then his heaters would get a value greater than 100 when delivered at a higher speed than 92.4 mph, and lower than 100 every time he was shy of his average mark. Let’s call “Speed Index” this rescaled value. I kept only the pitchers who fired at least 100 fastballs in every month.
Here is the major league average Speed Index by month.
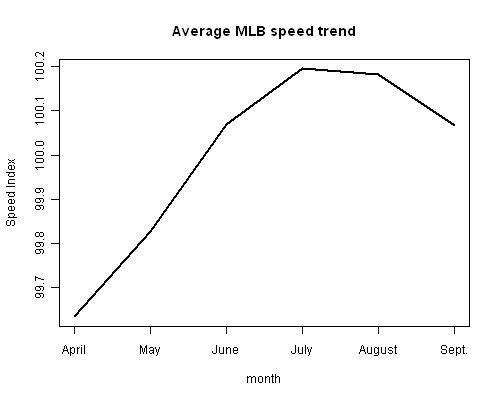
We can see a steady increase during the season until July, then the wear and tear of the season begins to show up.
Likely selection bias alert: It is possible that some pitchers didn’t make the 100 fastballs cut because their fastball was slowing down and they were consequently released, sent to the minors or ordered some rest. Or maybe the slowing down was a sign of an imminent injury that eventually happened, thus sidelining the player (and preventing him from making the cut). Summing up, the choice of keeping pitchers who regularly took the mound all year long might have selectively left out those declining.
Keeping the aforementioned bias issue in mind, I tried to figure whether there are different types of players in relation to the speed trend during the season —for example, players finishing strong (like Ohlendorf) and players finishing… their fuel (Scherzer).
I performed a cluster analysis, aiming at classifying pitchers in homogeneous groups, according to their Speed Indexes in each month.
The optimal solutions found by the software I used (R, and his package MClust) grouped all the pitchers in a single cluster, meaning that they have pretty similar speed trends. Anyway, I explored a few sub-optimal solutions that split them into two or more groups, hoping to separate the Ohlendorfs from the Scherzers.
Here is a three-groups solution.
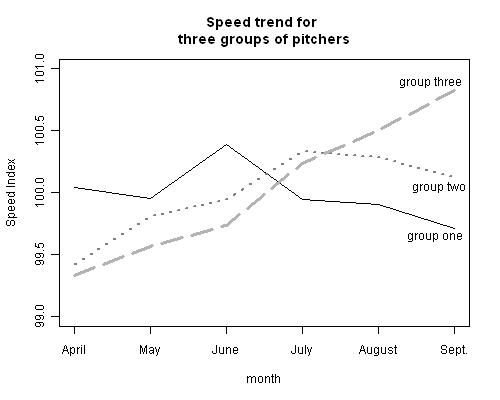
One of the clusters shows a decline and—you guessed correctly—Scherzer is in that cluster.
I gave a quick look at the names in group one and group two (only 13 players are assigned to group three, Ohlendorf among them), trying to figure some common characteristic among the group members that may lend them to have different paths during the season. Not being able to spot a common denominator by eyes, I calculated a couple of means.
Pitchers in the first group, let’s call them the Decreasers, had on average 440 pitches under their belt by the end of April; the Increasers (pitchers in the second group) 399. When the season was two months old the count was 947 to 877.
Let’s see the full pitch count progression in a table, adding the small group of the Skyrocketers.
Cumulative number of pitches by month.

Group		 Apr   May   Jun   Jul   Aug   Sep
Decreasers	 440   947  1418  1850  2349  2741
Increasers	 399   877  1321  1765  2231  2591
Skyrocketers	 345   772  1171  1536  1930  2208
Though we can spot a some differences, I’m not sure if 70 pitches in the first two months can make a difference three-four months later, especially since the variability (not shown) is not trivial. Anyway, I find interesting that the group that exhibits the steepest increase is the one that was by far less employed at the beginning of the season. Again, there might be some bias here, too—the Skyrocketers probably were underperforming (recovering from injury?) during spring and they just fulfilled their potential later in the season.
I made another comparison based on workloads. Here is the cumulative fastball count for the three groups of pitchers.

Cumulative number of fastballs by month.

Group		 Apr   May   Jun   Jul   Aug   Sep
Decreasers	 243   538   809  1056  1339  1564
Increasers	 196   454   695   939  1189  1388
Skyrocketers	 198   449   681   892  1130  1298
Differences are there, too (relatively speaking, group one and group two are more distant here than in the previous table), but again I don’t feel like making definitive statements about the effect of throwing more fastballs early in the season on the speed later in the year. I ran a correlation test between the variables “fastballs thrown in April and May” and “fastball speed in September relative to fastball speed in April” and found a low, non-statistically significant, negative association.
I’m sure the words I wrote in this article haven’t raised many oohs and aahs: there’s nothing revolutionary in saying that—maybe—heavier workloads can lead to fatigued arms. But I will keep in mind the charts I drew above should other Roger Clemenses, Pedro Martinezes or Paul Byrds start their season after the All-Star break.
References & Resources
Data and classifications from MLBAM.
It seems to me that your first chart indicates that pitchers that continue to throw a lot of fastballs all season don’t vary in velocity all that much as a group…
The range in your chart is from something just above 99.6 to a max of just less than 100.2… If I take your Roy Halladay example (92.4 mph avg) and assume he follows this curve (which I assume he didn’t really), the range on his monthly average fastballs would be between 92 and 92.6 mph… If someone had an 88 mph avg, their range would be 87.4 to 88.2… Those don’t seem like much to me (but I don’t really know how big it would need to be to be an issue)…
“How much does temperature affect fastball speed?”
I’m trying to factor this and other variables in a more elaborated model. I’ve been working on it for a while, but I need to better master multilevel modelling to simultaneously assess the effects of many variables.
Your graph for all pitchers looks a little (a lot?) like a temperature graph. How much does temperature affect fastball speed?
What about if you split that graph into two groups? One are all pitches thrown in indoor stadiums and those that don’t have much of a temperature change from April to September (like LAN/SDN/ALA/FLO/SFN), and those that have 4 seasons?