Finding the Chacon Zone
Brad Ziegler is firmly entrenched in the Chacon Zone. (via Grant Dawson & Joon Lee)
Editor’s Note: This is the first post of “Fantasy Baseball Preview Week!” For more info, click here.
In the dozen years I’ve been playing fantasy baseball, I’ve never once owned Mariano Rivera or Billy Wagner. Never drafted Craig Kimbrel, never traded for Aroldis Chapman. Historically, my teams have been littered with such luminaries as Shawn Chacon, Danny Graves and Al Reyes. See, I’m unwilling to shell out the big bucks required to land a stud closer as far too many fantasy managers are wont to do. And as frustrating as it can be watching my ERA soar as I desperately chase a handful of saves, I have no doubt that picking my third outfielder or starting pitcher before my first closer is the “responsible” decision.
But there has to be a better strategy than blindly chasing saves opportunities. Sure, everyone can agree that Dellin Betances is a better pitcher in reality than Shawn Tolleson. But is he better in fantasy? Do his elite rate stats and strikeouts compensate for his lack of saves? And if not, then which closers is he more valuable than? At what point should fantasy owners say “Enough” and relegate underperforming closers to The Chacon Zone (hat tip to Paul Sporer for the name)?
Enter Z-Scores. For those who may need a stats refresher, a Z-Score is the number of standard deviations an observation lies from the mean. It’s calculated by dividing the difference between an observation (how a player did in a given stat) and the average of that stat by the stat’s standard deviation, a measure of variance. A starting pitcher who has a Z-Score of 2 in ERA, posted an ERA that is two standard deviations better than the average. This would place him in approximately the 95th percentile of his peers.
We can add Z-Scores across multiple categories to arrive at a single number comparable across a position. For relievers, summing Z-Scores for saves, strikeouts, ERA and WHIP results in a composite figure that allows us to compare the value of a setup man to that of a closer or a long reliever without having to arbitrarily differentiate the value of each stat. Zach Sanders wrote an excellent series introducing and explaining Z-Scores back in 2011.
So which non-closing relievers are objectively more valuable than their ninth-inning counterparts? To determine this, I turned to Steamer’s 2016 projections. Among relievers expected to meet the qualified innings threshold (consistently ~49 innings pitched over the last five years), Steamer estimates the following averages and standard deviations across the four relief pitcher stats:
| Stat | Average | Std Dev |
| Saves | 9.842 | 12.032 |
| Ks | 61.108 | 11.308 |
| ERA | 3.348 | .410 |
| WHIP | 1.223 | .084 |
Based on depth charts, I separated the relievers into two groups, closers and non-closers, and plotted their Z-Scores using Steamer’s projections. First, let’s look at a visual representation of the closer position.
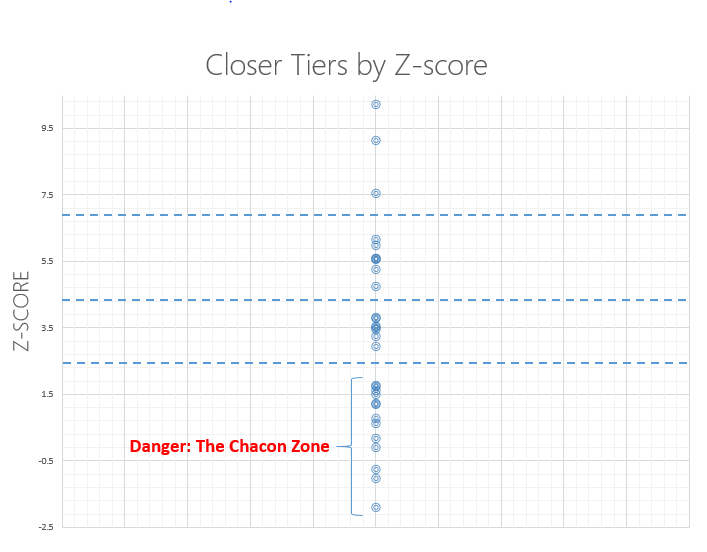
It appears that closers fall into four tiers, arguably five if you assign Craig Kimbrel his own. In the bottom two tiers lie the majority of closers, many of whom Steamer projects to reach the 30-save plateau. But should you pay a premium for 30 saves when those same pitchers will likely hurt you in ERA, strikeouts and WHIP?
I calculated the Z-Scores for all remaining non-closing relievers, setting a cutoff of -1.913, the Z-Score of the lowest ranked closer. The plot below shows the number of non-closers projected to out-perform the Brad Zieglers and Steve Cisheks of the world.

Now, I have to add a caveat. Steamer projects that many of these non-closers will log some number of saves and in a few cases that number is quite substantial. Projecting saves for setup men and middle relievers is reasonable since closers require off days and suffer injuries like anyone else. However, we’re trying establish value independent of save chances. This not only interferes with our efforts to isolate performance from opportunity but also complicates comparisons within the non-closer group. Therefore, I re-calculated the Z-Scores for each non-closer using the average number of saves that Steamer projects across this group, 4.054. It produced this alternate plot.
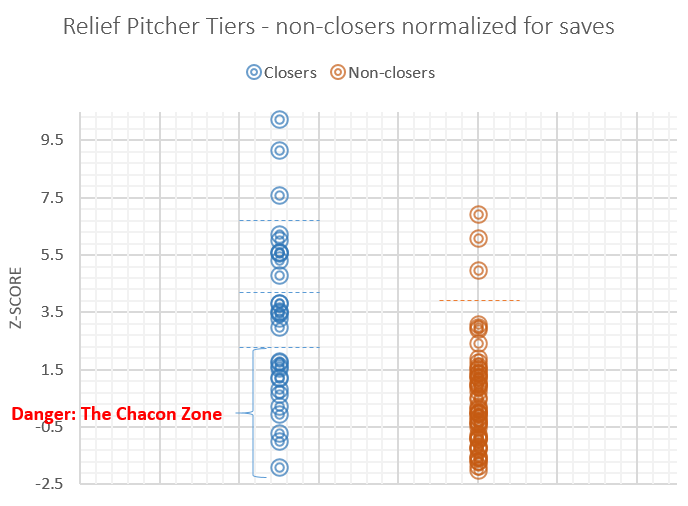
As you might expect, having assigned a uniform number of saves across the set, we see less separation in Z-Scores to the point where we even lose a tier. However, the takeaway is the same: A significant number of relief pitchers who occupy non-closing roles provide greater value than relievers who, at least for the time being, pitch the ninth. In other words, opportunity alone is not compelling enough a reason to draft a third or fourth tier closer, when the same production can be found for much less.
Additionally, opportunity is fickle. Third and fourth tier closers will provide value for only as long as they retain ninth-inning duties. Injuries or performance commensurate with lesser talent opens the door for their value to crater. With top-tier non-closers, their talent represents the baseline and the opportunity to step into ninth-inning duties, untold potential.
So who are these middle relievers you should target and the closers you should avoid? Let’s take a look at the latter in tabular form, and then both in graphical form.
| Name | Team | Composite Z-Score |
| Arodys Vizcaino | Braves | 1.779 |
| Drew Storen | Blue Jays | 1.745 |
| A.J. Ramos | Marlins | 1.617 |
| Santiago Casilla | Giants | 1.504 |
| David Hernandez | Phillies | 1.237 |
| Shawn Tolleson | Rangers | 1.180 |
| Jonathan Papelbon | Nationals | 0.791 |
| Fernando Rodney | Padres | 0.619 |
| Francisco Rodriguez | Tigers | 0.192 |
| Huston Street | Angels | -0.094 |
| J.J. Hoover | Reds | -0.769 |
| Steve Cishek | Mariners | -1.029 |
| Brad Ziegler | Diamondbacks | -1.913 |
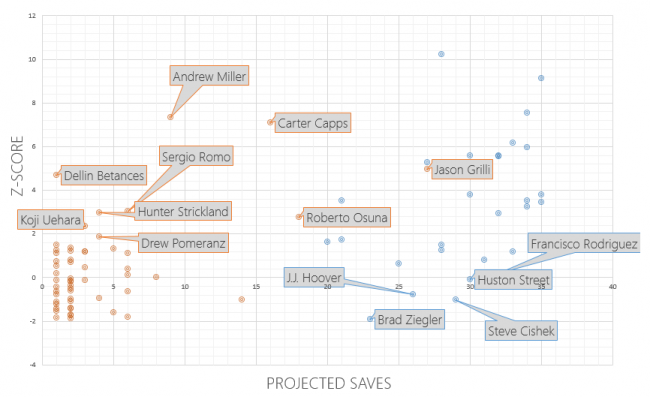
First off, Roberto Osuna, Jason Grilli and Carter Capps all benefit from a relatively high number of projected saves. While they’re also anticipated to perform better than average in strikeouts, ERA, and WHIP, Osuna’s value is only marginally better across these three stats. In other words, his value is driven in large part by the 18 saves Steamer foresees.
Normalizing his save totals, Osuna’s composite Z-Score drops by over 40 percent. Despite residing in The Chacon Zone, Drew Storen appears to enter 2016 with a firm grip on ninth-inning duties in Toronto, meaning you can disregard Osuna for now.
Battling his way back from a torn Achilles, Grilli’s value is also highly tied to saves. Normalizing his saves total drops his value by 39 percent. However, Grilli has a much clearer path than Osuna to regaining his closer duties. Monitor his progress this spring; he may prove to be a draft-day steal.
Carter Capps is one of the most compelling names on this plot. He was phenomenal last season as the Norgay to A.J. Ramos’ Hillary. While once again slotted into eighth-inning duties, he may challenge Ramos for the closer’s role as early as this spring. If he wins, his value will skyrocket.
Capps represents the perfect example of when to bet on talent first and opportunity second. Worst case scenario, you draft a setup guy who provides comparable production to a second tier closer and if he takes over the ninth, he immediately ascends to the top. Just hope that your league drafts before Don Mattingly makes his decision.
The same principle applies to Andrew Miller, though Miller’s path to regaining full-time closing duties is less certain than Capps’. While Chapman may miss time due to a suspension, Miller is unlikely to retain the job long-term. Dellin Betances’ opportunity to pick up saves is even bleaker than Miller’s but that just means you can wait even longer to draft him. In standard leagues, very few managers will use a draft pick on a pitcher third in line for saves. Don’t make that same mistake.
I talked a bit about Sergio Romo and Hunter Strickland in a FanGraphs piece on the Giants’ playing time battles. I’m not surprised by Romo’s appearance on this plot because he’s an excellent pitcher and sits first in line for saves should Casilla falter.
Strickland however, is very intriguing. Steamer projects that most of his value will come from outperforming his peers in ERA and WHIP. That said, Strickland’s whiff rate ranked 25th out of 137 qualified relievers last season despite striking out less than a batter per inning. It’s very possible that he exceeds Steamer’s expectations and emerges as an elite source of strikeouts as well.
In The Chacon Zone sit some familiar names. If you’ve owned these closers in the past, as I have, you likely pulled them off the scrap heap.
Brad Ziegler and Steve Cishek’s value is entirely tied to their roles. They’re projected for below average stats across the board. Let someone else pay for their saves. Ziegler, an extreme ground ball pitcher, benefited from an absurdly unsustainable .218 BABIP last season (his previous career-low BABIP was .258). His ground ball proclivities play well in his ballpark but his inability to strike batters out will come back to bite him when his BABIP predictably regresses.
Cishek struggled with his mechanics last season in Miami before being traded to the Cardinals. While his numbers improved in St. Louis, his peripherals suggested that he still has some work to do. With Tony Zych, Joaquin Benoit and Evan Scribner, the Mariners have several viable options to close, making their bullpen situation volatile. Cishek, like Ziegler, doesn’t possess the fantasy-relevant skill set to justify a roster spot over a more deserving seventh- or eighth-inning reliever.
Some of the more prominent names in The Chacon Zone include Santiago Casilla, Huston Street and Jonathan Papelbon, all projected to approach or surpass 30 saves but to disappoint in other categories. If you’re looking at these pitchers to complete your staff, consider some of the aforementioned middle relievers and setup men. A full list of relievers appearing in the plots above can be found in the table embedded below, with citizens of The Chacon Zone highlighted in red.
I’d like to think that one of these days I’ll draft a Craig Kimbrel or the next Mariano Rivera. But if history is any indication of what’s to come, I’ll predictably watch the run on closers go by and find myself in an all-too-familiar predicament. The next time you’re faced with the choice of picking one of your favorite sleepers or rolling the dice with Fernando Rodney, take my advice and avoid The Chacon Zone at all costs. I’ll leave you with all the relievers down to Ziegler, but fear not, “The Chacon Zone” will be a recurring RotoGraphs column this season!
| Name | Team | Starting Closer? | Composite Z-Score | Chacon Zone? |
| Aroldis Chapman | Yankees | Y | 10.21707555 | No |
| Kenley Jansen | Dodgers | Y | 9.115765609 | No |
| Craig Kimbrel | Red Sox | Y | 7.535082887 | No |
| Andrew Miller | Yankees | N | 7.339540868 | N/A |
| Carter Capps | Marlins | N | 7.095960207 | N/A |
| Cody Allen | Indians | Y | 6.17545418 | No |
| Zach Britton | Orioles | Y | 5.956071429 | No |
| Trevor Rosenthal | Cardinals | Y | 5.590013869 | No |
| David Robertson | White Sox | Y | 5.581990441 | No |
| Wade Davis | Royals | Y | 5.555427291 | No |
| Will Smith | Brewers | Y | 5.260213811 | No |
| Jason Grilli | Braves | N | 4.960741056 | N/A |
| Sean Doolittle | Athletics | Y | 4.738241434 | No |
| Dellin Betances | Yankees | N | 4.68476598 | N/A |
| Brad Boxberger | Rays | Y | 3.800293503 | No |
| Mark Melancon | Pirates | Y | 3.784172469 | No |
| Hector Rondon | Cubs | Y | 3.53459893 | No |
| Jake McGee | Rockies | Y | 3.505906856 | No |
| Ken Giles | Astros | Y | 3.436131343 | No |
| Jeurys Familia | Mets | Y | 3.251920114 | No |
| Sergio Romo | Giants | N | 3.049612174 | N/A |
| Hunter Strickland | Giants | N | 2.980025259 | N/A |
| Glen Perkins | Twins | Y | 2.941979281 | No |
| Roberto Osuna | Blue Jays | N | 2.772038087 | N/A |
| Koji Uehara | Red Sox | N | 2.340508503 | N/A |
| Drew Pomeranz | Padres | N | 1.873205042 | N/A |
| Arodys Vizcaino | Braves | Y | 1.778835274 | Yes |
| Drew Storen | Blue Jays | Y | 1.744851578 | Yes |
| Daniel Hudson | Diamondbacks | N | 1.700640328 | N/A |
| A.J. Ramos | Marlins | Y | 1.617143008 | Yes |
| Santiago Casilla | Giants | Y | 1.504181251 | Yes |
| Brett Cecil | Blue Jays | N | 1.501261002 | N/A |
| Pedro Strop | Cubs | N | 1.372501804 | N/A |
| Shawn Kelley | Nationals | N | 1.320087575 | N/A |
| Yimi Garcia | Dodgers | N | 1.251085604 | N/A |
| David Hernandez | Phillies | Y | 1.236789109 | Yes |
| Chris Hatcher | Dodgers | N | 1.201339479 | N/A |
| Shawn Tolleson | Rangers | Y | 1.179899338 | Yes |
| Kevin Siegrist | Cardinals | N | 1.169851677 | N/A |
| Darren O’Day | Orioles | N | 1.168577255 | N/A |
| Tony Cingrani | Reds | N | 1.111506568 | N/A |
| Liam Hendriks | Athletics | N | 1.110043363 | N/A |
| Nate Jones | White Sox | N | 0.805061013 | N/A |
| Jonathan Papelbon | Nationals | Y | 0.790541064 | Yes |
| Justin Grimm | Cubs | N | 0.739975945 | N/A |
| Tony Watson | Pirates | N | 0.713144601 | N/A |
| Fernando Rodney | Padres | Y | 0.619025955 | Yes |
| Oliver Perez | Nationals | N | 0.514798489 | N/A |
| Jumbo Diaz | Reds | N | 0.464217662 | N/A |
| Joakim Soria | Royals | N | 0.397092655 | N/A |
| Francisco Rodriguez | Tigers | Y | 0.191783997 | Yes |
| Carson Smith | Red Sox | N | 0.188520354 | N/A |
| Danny Farquhar | Rays | N | 0.117262857 | N/A |
| Joaquin Benoit | Mariners | N | 0.015515919 | N/A |
| Mike Dunn | Marlins | N | -0.056920355 | N/A |
| Huston Street | Angels | Y | -0.093563263 | Yes |
| Josh Fields | Astros | N | -0.115903016 | N/A |
| Fernando Salas | Angels | N | -0.136596601 | N/A |
| Zach McAllister | Indians | N | -0.158486719 | N/A |
| Luke Gregerson | Astros | N | -0.18837396 | N/A |
| Mike Morin | Angels | N | -0.356625952 | N/A |
| Chris Withrow | Braves | N | -0.428873443 | N/A |
| Jordan Walden | Cardinals | N | -0.486400766 | N/A |
| Antonio Bastardo | Mets | N | -0.604718189 | N/A |
| Ryan Madson | Athletics | N | -0.629078579 | N/A |
| Hansel Robles | Mets | N | -0.655092478 | N/A |
| J.J. Hoover | Reds | Y | -0.76886313 | Yes |
| Kelvin Herrera | Royals | N | -0.771136778 | N/A |
| Joe Smith | Angels | N | -0.945121819 | N/A |
| Addison Reed | Mets | N | -0.97321101 | N/A |
| Tyler Clippard | N | -1.017403638 | N/A | |
| Steve Cishek | Mariners | Y | -1.028833701 | Yes |
| Charlie Furbush | Mariners | N | -1.093145909 | N/A |
| Junichi Tazawa | Red Sox | N | -1.122008486 | N/A |
| Blake Treinen | Nationals | N | -1.213054845 | N/A |
| Alex Colome | Rays | N | -1.392214295 | N/A |
| Mark Lowe | Tigers | N | -1.439318281 | N/A |
| Xavier Cedeno | Rays | N | -1.441314162 | N/A |
| Tony Zych | Mariners | N | -1.538989927 | N/A |
| Justin Wilson | Tigers | N | -1.607948336 | N/A |
| Fernando Rodriguez | Athletics | N | -1.707862213 | N/A |
| Brian Matusz | Orioles | N | -1.741640054 | N/A |
| Jeremy Jeffress | Brewers | N | -1.816124975 | N/A |
| Arquimedes Caminero | Pirates | N | -1.846029473 | N/A |
| Jake Diekman | Rangers | N | -1.868737376 | N/A |
| Brad Ziegler | Diamondbacks | Y | -1.912661128 | Yes |
I am in a small league (somewhere between 7-9 players) standard draft and I am wondering if, even given the talent I should be able to acquire, should I even bother with the elite setup men? I could realistically grab three closers that are not in the Chacon Zone.
Side note, I owned Wade Davis for a bit last year even though he was in the setup role, Holland went down for a bit so not only did I benefit from his numbers before I got the increased value with saves.
In a smaller 7-9 league team, and assuming 3 closers per team on average, you’re looking at at least 21-27 being drafted. With 13 closers in the Chacon Zone, that means you’re most likely having to draft at least 1 in that bottom tier. And given the likelihood that at least a couple managers will hoard closers, rostering 4 or more, you might have to reach substantially to avoid that last tier of closers.
The good news is that in a shallow league you can reach knowing you’ll have hitter and SP options still available in FA. I’m not advocating it but it’s an option.
I’d think of it this way – last season Liam Hendriks, Dellin Betances, and Sergio Romo combined for 206 innings, a 2.36 ERA, a 1.10 WHIP, and 273 Ks. Among starters, that would have ranked 4th in ERA, 16th in WHIP, and 3rd in Ks while snatching up 11 wins. Yeah you’re punting saves, but instead of taking closers, you’re getting the equivalent of Chris Sale and drafting Adrian Gonzalez, Jason Heyward, or Matt Carpenter in the 7th or 8th round.
Now you don’t have to take it that far. There’s obviously middle ground but opportunity cost matters.
I’m not a stats expert, but is a Z-score the best test? Relievers only pitch about 1/3 of the innings of a starter, thus their contribution to ERA and WHIP are less important. Aren’t you weighting all categories the same in your Z-score? So for example, assuming 5 SP and 3 RP, a reliever should be expected to contribute about 33% of the saves category, but only about 6% of ERA and WHIP and practically 0% of wins – so weight accordingly.
If we were trying to draw comparisons between starters and relievers, you’d be absolutely right. But since we’re only comparing relievers to each other, weighting isn’t necessary. The ERA and WHIP contributions of a closer is just as significant (or insignificant) as that of a setup man since they pitch a similar number of innings.
A closer’s contribution to saves is obviously very important and that’s reflected in the standard deviation. That’s also why to be conservative I normalized for saves among non-closers. For closers, the Z-Scores in saves were generally much higher than for the other categories meaning to be more non-closer with a higher composite score, you had to severely outperform the mean in ERA, WHIP, and Ks.
I think David is right. A reliever whose saves, era, and whip are 1 standard deviation above the mean will have the same z score as one whose saves are 3 standard deviations above the mean, and era and whip are mean. But the first reliever will have a much lesser effect on your team because of the effect of the starter/reliever split. I think you need to convert era and whip to counting stars.