Independent League to Affiliated Baseball: Who Makes the Move?
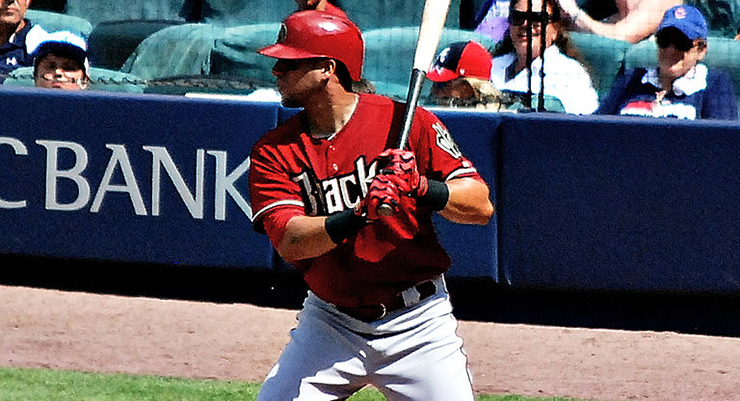
David Peralta is one of the most recent success stories from the Independent Leagues. (via Grant Dawson)
Not every baseball player has the opportunity to be signed by a major league team. Generally, the reason most players don’t move on after high school and college is MLB teams don’t think the player is good enough. Sometimes however, a player in remote parts of the country may not have been seen by scouts. For players who feel they belong with an MLB organization, they can showcase their talent with an independent baseball team. Even though the player gets a small pittance of money, he has the chance to keep his going.
David Peralta is one such player. He was originally signed by the St. Louis Cardinals but eventually released after several subpar, injury-filled seasons. Then he signed with three different independent league teams until the Diamondbacks bought out his contract. Peralta hit 17 home runs to go with a .312 batting average last year. Even though it took him nearly nine years to become a productive player, he probably would never have been given the opportunity if independent ball didn’t exist.
Other players see independent ball as a chance to get back to the majors after an injury derails their career. Enter Rich Hill. Hill’s career began to crater during the 2009 season when his ERA ballooned to 7.80. He moved to the bullpen, where he continued to struggle until he needed Tommy John surgery in 2011. He bounced around the majors and pitched for four different organizations. After being released by the Nationals in 2015, Hill signed with the independent Long Island Ducks out of the Atlantic League. He thrived with the Ducks, and the Red Sox eventually re-signed him. He started just four games for the Sox and struck out 36 batters in just 29 innings pitched and posted a 1.55 ERA. Those four starts impressed the Athletics so much, they gave the nearly/formerly washed-up Hill a one-year, $6 million dollar deal for 2016.
While Peralta and Hill are independent ball success stories, few players from those leagues get picked up by major league teams, and even fewer make it to the majors. The following is a statistical breakdown of the players who get picked up, which teams pick them up, and how they perform once in affiliated ball.
Right now there are six “major” independent baseball leagues:
- American Association (Midwest) – 13 teams
- Atlantic League (Northeast) – Eight teams
- Canadian American Association or Can-Am League (Canada and Northeast) – Six teams
- Frontier League (Midwest) – 12 teams
- Pecos League (Rockies) – 10 teams
- Pacific Association (California) – Four teams
Two of the six leagues, Pecos and Pacific, are for really young players and don’t get players picked up by major league teams. If a player is picked up, it is from a higher-level independent league team. Of the four remaining leagues, I could find usable historic transaction data only for the American Association, Atlantic League and Frontier League. For this initial stab, I looked at only the past three seasons’ worth of transactions. For each of these three leagues, here is some baseline information.
First, here are the overall numbers of independent-league players who were signed by major league clubs:
| League | Players Signed | Players/Year | Pitchers | Hitters | Ratio of Pitchers to Hitters |
| Atlantic | 93 | 3.9 | 54 | 39 | 1.4 |
| American | 64 | 1.6 | 33 | 31 | 1.1 |
| Frontier | 51 | 1.4 | 33 | 18 | 1.8 |
| Overall | 208 | 2.1 | 120 | 88 | 1.4 |
The number that sticks out is about two players per team actually getting picked up during a season. When major league teams go looking for indy ball players, they definitely look to the Atlantic League, with more than twice as many players getting picked up from there as the other leagues. A pitcher is 40 percent more likely to have his rights sold to a major league club than a position player.
Now, here are the indy ball teams with the most players lost:
| Team | Picks | League |
| Lancaster | 16 | Atlantic |
| Somerset | 16 | Atlantic |
| Sugar Land | 16 | Atlantic |
| Bridgeport | 13 | Atlantic |
| Wichita | 13 | American |
| Long Island | 12 | Atlantic |
| York | 10 | Atlantic |
| Windy City | 9 | Frontier |
| Camden | 8 | Atlantic |
| Laredo | 8 | American |
It is no surprise to see the Atlantic League teams dominating this list, with just the Southern Maryland Blue Crabs not making this top 10.
Now that we know which independent teams are getting their players taken, here are the teams doing the taking:
| MLB Team | Players |
| Diamondbacks | 34 |
| Braves | 21 |
| Angels | 16 |
| Padres | 13 |
| Red Sox | 9 |
| Mets | 8 |
| Nationals | 7 |
| Orioles | 7 |
| Phillies | 7 |
| Twins | 7 |
| White Sox | 7 |
| Rockies | 6 |
| Royals | 6 |
| Blue Jays | 5 |
| Giants | 5 |
| Mariners | 5 |
| Pirates | 5 |
| Yankees | 5 |
| Cubs | 4 |
| Rangers | 4 |
| Reds | 4 |
| Athletics | 3 |
| Brewers | 3 |
| Dodgers | 3 |
| Indians | 3 |
| Marlins | 3 |
| Rays | 3 |
| Cardinals | 2 |
| Tigers | 2 |
| Astros | 0 |
| Average | 6.9 |
Holy Diamondbacks! With 34 players picked up, no wonder they hit on Peralta. It is the same total as the 12 lowest teams combined. But it is just not the Diamondbacks who are picking up lots of the independent league players. The Braves, Angels and Padres have also signed more than 10 players each. The total from these four teams is the same as the 21 lowest. At the other end of the spectrum are the Houston Astros, who haven’t bought the contract of a single independent league player in past three seasons.
Major league teams do have to pay a small amount to the independent league teams. Josh Robertson, Wichita Wingnuts general manager and brother of former major league pitcher Nate Robertson, says the American Association has a set price for all players. In-season acquisitions cost a major league team $4,000, with $3,000 going to the independent league team and $1,000 to the league. For players signed in the offseason, the independent team gets just $1 for the signing and an additional $1,499 if the player is with any of the affiliated levels after spring training. Independent league signings are just a blip on a team’s budget.
Now, let’s move onto the production level for the players involved. This where the math gets a little deep and murky. First, the stats collected by the independent league teams don’t provide the most detailed data. It’s basic box score information. I wanted to keep the transfer of stats easy and useful. I decided to go with only three for now: Basic wOBA, ISO and strikeout percentage for hitters and ERA, strikeout percentage and strikeout-walk ratio for pitchers. It would be great to know pitcher velocity, but it isn’t publicly available except at the MLB level. The stats aren’t perfect, but I didn’t have access to batters faced for pitchers, so I decided to go with those for now.
The Atlantic and Frontier Leagues have generally the same scoring environment, with the American Association being a little more hitter friendly.
Now, here is the overall players’ performance and difference from the independent league average of the players picked up by majorleague teams. For pitchers I have combined and then split them into starters (GS/G >= 0.5) and relievers (GS/G < .5).
| League | season | wOBA | K% | ISO | wOBA | K% | ISO |
| American Association | 2013 | 0.393 | 15.1% | 0.161 | 0.059 | -1.3% | 0.033 |
| American Association | 2014 | 0.380 | 11.9% | 0.120 | 0.043 | -2.4% | -0.002 |
| American Association | 2015 | 0.347 | 10.1% | 0.085 | 0.021 | -6.8% | -0.029 |
| Atlantic | 2013 | 0.374 | 15.4% | 0.155 | 0.052 | -1.6% | 0.026 |
| Atlantic | 2014 | 0.357 | 16.3% | 0.140 | 0.040 | -0.2% | 0.011 |
| Atlantic | 2015 | 0.326 | 15.6% | 0.100 | 0.015 | -3.1% | -0.018 |
| Frontier | 2013 | 0.384 | 17.3% | 0.167 | 0.065 | -0.8% | 0.045 |
| Frontier | 2014 | 0.366 | 17.5% | 0.149 | 0.040 | -1.4% | 0.025 |
| Frontier | 2015 | 0.296 | 14.5% | 0.103 | -0.020 | -4.7% | -0.015 |
| Median | 0.040 | -1.6% | 0.011 | ||||
| Average | 0.035 | -2.5% | 0.008 | ||||
| League | Season | ERA | K/BB | K/9 | Diff in ERA | Diff in K/BB | Diff in K/9 |
| American | 2013 | 3.15 | 2.7 | 7.9 | -1.31 | 0.8 | 1.3 |
| American | 2014 | 3.26 | 2.6 | 8.7 | -1.34 | 0.7 | 2.1 |
| American | 2015 | 2.69 | 3.4 | 10.0 | -1.52 | 1.4 | 3.4 |
| Atlantic | 2013 | 2.59 | 3.0 | 7.0 | -1.55 | 1.0 | 0.4 |
| Atlantic | 2014 | 3.20 | 2.5 | 7.0 | -0.74 | 0.5 | 0.7 |
| Atlantic | 2015 | 2.45 | 3.2 | 7.0 | -1.30 | 0.9 | -0.2 |
| Frontier | 2013 | 3.00 | 3.8 | 9.8 | -0.98 | 1.9 | 2.8 |
| Frontier | 2014 | 3.10 | 2.7 | 9.6 | -1.18 | 0.7 | 2.2 |
| Frontier | 2015 | 3.14 | 2.8 | 8.3 | -0.86 | 0.7 | 0.9 |
| Median | -1.30 | 0.8 | 1.3 | ||||
| Average | -1.20 | 1.0 | 1.5 | ||||
| League | Season | ERA | K/BB | K/9 | Diff in ERA | Diff in K/BB | Diff in K/9 |
| American | 2013 | 3.07 | 2.8 | 7.7 | -1.39 | 0.9 | 1.1 |
| American | 2014 | 3.30 | 2.8 | 8.0 | -1.30 | 0.9 | 1.4 |
| American | 2015 | 3.24 | 3.1 | 9.3 | -0.96 | 1.2 | 2.7 |
| Atlantic | 2013 | 2.87 | 2.7 | 6.4 | -1.27 | 0.7 | -0.2 |
| Atlantic | 2014 | 3.29 | 2.2 | 6.6 | -0.65 | 0.3 | 0.3 |
| Atlantic | 2015 | 2.49 | 3.2 | 6.8 | -1.27 | 0.8 | -0.4 |
| Frontier | 2013 | 2.94 | 4.0 | 9.8 | -1.04 | 2.1 | 2.8 |
| Frontier | 2014 | 3.36 | 2.9 | 8.8 | -0.92 | 0.9 | 1.4 |
| Frontier | 2015 | 3.69 | 2.4 | 7.8 | -0.31 | 0.2 | 0.4 |
| Median | -1.04 | 0.9 | 1.1 | ||||
| Average | -1.01 | 0.9 | 1.0 | ||||
| League | Season | ERA | K/BB | K/9 | Diff in ERA | Diff in K/BB | Diff in K/9 |
| American | 2013 | 3.36 | 2.6 | 8.4 | -1.10 | 0.7 | 1.8 |
| American | 2014 | 3.22 | 2.4 | 9.3 | -1.39 | 0.5 | 2.7 |
| American | 2015 | 1.83 | 3.8 | 11.0 | -2.37 | 1.9 | 4.4 |
| Atlantic | 2013 | 1.65 | 4.1 | 9.2 | -2.50 | 2.1 | 2.6 |
| Atlantic | 2014 | 2.41 | 5.6 | 10.6 | -1.53 | 3.7 | 4.2 |
| Atlantic | 2015 | 2.17 | 3.8 | 8.2 | -1.58 | 1.5 | 1.1 |
| Frontier | 2013 | 3.33 | 3.0 | 9.8 | -0.65 | 1.0 | 2.8 |
| Frontier | 2014 | 2.77 | 2.5 | 10.6 | -1.51 | 0.6 | 3.2 |
| Frontier | 2015 | 1.80 | 4.3 | 9.7 | -2.20 | 2.1 | 2.3 |
| Median | -1.53 | 1.5 | 2.7 | ||||
| Average | -1.65 | 1.6 | 2.8 |
Besides a few instances, players coming over from the independent leagues are quite a bit better than the league average. Looking for players who meet these criteria may be a good way to find players MLB teams want to target.
The next area examined is performance in the different minor league levels. After matching player IDs, here is how the players performance change after making the move. I would have loved to compare performance from each of the independent leagues, but the sample size was too small. Instead, I kept the players grouped together.
(Note: I compared the data in season weighted by the harmonic mean of the innings pitched. It is the same method I use for aging curves.)
| Actual Change | ERA | K/BB | K/9 | Average Age | Count |
| AAA | 3.51 | -1.4 | -0.7 | 29.3 | 38 |
| AA | 1.84 | -0.9 | -0.1 | 27.7 | 38 |
| A+ | 1.06 | -0.6 | -1.1 | 25.3 | 30 |
| A and A- | 0.05 | 1.6 | -0.5 | 23.8 | 22 |
| Rookie | 1.92 | -0.2 | -1.3 | 24.6 | 11 |
| % Change | |||||
| AAA | 251% | 61% | 88% | ||
| AA | 140% | 75% | 96% | ||
| A+ | 147% | 71% | 86% | ||
| A and A- | 80% | 114% | 90% | ||
| Rookie | 220% | 102% | 92% | ||
| Affiliate Stats | |||||
| AAA | 5.49 | 2.2 | 6.5 | ||
| AA | 4.48 | 2.5 | 7.2 | ||
| A+ | 3.55 | 4.2 | 7.7 | ||
| A and A- | 3.36 | 4.7 | 8.5 | ||
| Rookie | 3.57 | 4.4 | 8.3 |
On average, a pitcher will see a drop in production when they make the jump to affiliated ball, but the change isn’t unplayable. Most keep 90% of their strikeout ability. Additionally, there is about a 1.5 year decline in age for each level under AAA to A-. Of the players I tracked, John Holdzkom, Rich Hill and Tim Stauffer where able to make it to the majors after playing indy ball the year before.
Now, how many of these pitchers stick around or are they just roster band-aids? Of the 70 pitchers who threw for both an Indy and an affiliated team in 2013 and 2014, 40 (or 57%) were still pitching the next season somewhere in affiliated ball.
Now it is time for the hitters.
| Actual Change | wOBA | K% | ISO | Average Age | Count |
| AAA | -0.051 | 4.0% | -0.034 | 28.7 | 29 |
| AA | -0.051 | 3.6% | -0.049 | 27.0 | 44 |
| A+ | -0.056 | 3.2% | -0.078 | 24.9 | 15 |
| A and A- | -0.016 | 1.3% | -0.025 | 23.9 | 10 |
| Rookie | -0.034 | 2.3% | -0.034 | 23.4 | 9 |
| % Change | |||||
| AAA | 84.0% | 131.6% | 75.1% | ||
| AA | 86.0% | 129.6% | 65.4% | ||
| A+ | 93.0% | 125.3% | 66.8% | ||
| A and A- | 89.5% | 114.2% | 82.5% | ||
| Rookie | 74.1% | 120.4% | 36.5% | ||
| Affiliate Stats | |||||
| AAA | 0.315 | 22.3% | 0.133 | ||
| AA | 0.322 | 19.4% | 0.136 | ||
| A+ | 0.357 | 18.0% | 0.175 | ||
| A and A- | 0.316 | 15.5% | 0.102 | ||
| Rookie | 0.325 | 17.2% | 0.159 |
Again, the hitters making the jump to affiliated ball will see their production decline compared to independent ball. The hitters see some performance loss — around a 15 percent or 50 point reduction in their wOBA in the highest three levels. The only hitter to make the jump to the majors was Ryan Langerhans in 2013. Looking at 69 hitters who played in 2013 and 2014, 29 (42%) were still playing affiliated ball the next season.
I think I will draw the line in the sand at the last bit of information. At this point, I have shown how many, from what independent leagues, and which teams sign the players. Additionally, the average amount of player production is measured in the independent league and affiliated ball performance. The one issue I will have creating any league equivalency score is the lack of data.
I can think of a few ways to expand the information provided, but every idea basically comes back to needing more and better data. Comparison to average Indy league player, differences in players transferring from different Indy leagues, percentage chance of making it to majors, success depending on age, etc. I am not sure the additional information is needed or even wanted for 99.9 percent or more of baseball fans, including myself. So few of the players make any impact on the MLB level, they can easily be ignored by almost everyone.
But then there are cases like David Peralta and his 3.7 WAR in 2015. The Diamondbacks probably got him for around $4,000. The Tigers just gave Justin Upton $133 million and he produced 3.6 WAR in 2015. Maybe the chances the Diamondbacks are taking with independent ball are cost efficient.
I don’t expect many teams to jump at every player in the independent leagues. Most are there because they couldn’t cut it in the majors. But those exceptions can make all the difference.
By day, I am a professional public educator. For several years, the Indy Leagues have supplied my school with a one or three substitute teachers per fall and winter. From them, I have learned of Chris Carminucci, a scout assigned by the Diamondbacks to dig up the Indy Leagues for rebound talent. His nicest find was David Peralta.
Carminucci played small college ball at LaGrange College in Georgia, the now-deceased Big South League and managed in both the AA and Can-Am Leagues. –the dude has seen some dusty roads and eaten some cardiac-arrest-in-a-bag but his portfolio indicates he can distinguish sinking talent from rising talent.
Carminucci’s Linked-In portfolio says he parla italiono. Perhaps one day, after other teams copy Arizona’s trail, Tony LaRussa, Dave Stewart and D-Backs Player Development Chief Mike Bell will send Carminucci to Italy to work with Lenny Randle (did you see the MLB Network Presents on the former MLB infielder?) to bring in giocatores di baseball to the desert.
Chris got my son signed this summer by the Kansas City T-Bones. I may be biased but Chris knows talent!
Loved this article.
Living near the Rockland Boulders of the Can Am league, happy to share some names such as Raul Valdes (5 years in the bigs playing for Mets, Yankees and Phils) and Chris Colabello (OPS+ of 142 w Toronto last season) who played in the Can Am before making the show.
Got to see Chris Edmondson dominate for the Boulders before leaving to play in the Braves organization and 2014 Can Am player of the year Balbino Fuenmayor who played in the 2015 Futures game and finished the season at AAA for the KC Royals. His 377 BA and 951 OPS at AAA after his 977 OPS at AA makes him someone to keep your eye on. Fangraphs had a great article on Fuenmayor last season.
Some more recent “graduates” from the Can Am to affiliated baseball include Johnny Walter and Alex Powers, both pitchers from the Jackels who were signed by the Reds. Walter led the Can Am w 138 K’s in 140 innings in 2015 and his 12 – 2 record was impressive. Saw him pitch once and he has a nice repeatable delivery.
Also, I wont be seeing Stephen Cardullo with the Boulders in 2016 as the Rockies signed the OFer who led the Can Am league w 34 doubles last season. Both kids got autographs (nice perk of indy ball is how close fans get to the players) from the 6′ 4″ Cardullo last season.
Chris Colabello played 7 years in Indy ball. Finally made the bigs at 29. Hit .321/.520/.886 last year for the Jays.
I’ve never seen a triple-slash listed like that. To clear things up, Colabello had a .321 BA, .367 OBP, .520 SLG and .886 OPS.
How about doing your homework next time. Facts are terribly incorrect. From league information to individual team information. This is very public data. You can simply check league websites to confirm the information.
First, thanks for reading the article.
I am not sure what you are talking about the facts being incorrect. I would like an example.
I pulled all the above data from Pointstreak’s transactions for each league.
American:
http://www.americanassociationbaseball.com/statistics/team-stats/fargo-moorhead-redhawks/
Atlantic:
http://alpb.bbstats.pointstreak.com/transactions.html?leagueid=174&seasonid=29210
Frontier:
http://frontier.bbstats.pointstreak.com/transactions.html?leagueid=200&seasonid=29214
I went back and looked at the Can-am league and they had no 2015 transactions with MLB clubs. everything was after the season:
http://www.canamleague.com/transactions.php
Now if these sources are wrong, there is nothing I can do there.
Now I did start looking at team reported numbers, but those are completely over inflated. If a player played for 6 different teams, they all claimed him. I was just looking for the last team he was on. This is like the Pirates taking credit for Bonds MVPs while he was on the Giants.
Now, the count of players in the AAA, AA, etc are a bit lower than the initial numbers because I was looking for players who had countable stats in the same season to get those numbers.
I am completely open with the work and would like to know where my sources are off.
I have a son that went undrafted out of college even though he put up great offensive and defensive numbers as a catcher in the Big 12. Offensively he hit .302 his Junior season and .321 his Senior campaign. He was signed by a team in the American Association in late June 2016 and immediately faced Caleb Thielbar, formerly with the Twins organization. He has had the opportunity to catch former MLB and MiLB pitchers, this as a 22 year old rookie. I have seen a number of games in the American Association and would categorize the play as AA caliber, having coached and seen play at this level. There are a number of players in the American Association that were passed over in the draft that absolutely could play affiliated ball. These leagues provide highly competitive games and the hope for many players to “move up.”
I liked the articles. Did work behind the scenes for the Sussex Skyhawks 2006-2010, and also for the New Jersey cardinals from 1994-2005. Johnny baseball Regan baseball historian of skylands park1994-2015.somerville, nj.