Good team, bad team, glad team, sad team
Three things are required for a team to win a lot of baseball games:
1. Have a lot of talented players.
2. Have those players play well.
3. Have more runs than the other team at the end of games.
The first item is the job of the general manager: assemble lots of really good players. The second and third items are the jobs of the players and management. In a perfect world, all three of these things would work in concert. Get a bunch of good players, have them hit the snot out of the ball and smother opposing hitters, and outscore your opponents in every game. It’s the perfect formula. Of course, there’s an element of luck involved. Sometimes good players play poorly. Sometimes good players play well but the team can’t catch a break in one-run games. It can get pretty complicated pretty quickly.
For example, you can have a bad team play poorly and lose a lot of games. You’d expect that wouldn’t you? But if those bad players were playing well, even if it was a fluke, those then you’d have a bad team winning games. Unless they were having bad luck in close games; then you’d have a bad team playing well but still losing games. Or, you could have a good team playing poorly but still winning games, or an average team playing well but losing lots of games, and so on.
As we near the halfway point, now is a good time to review which teams are good or bad, playing well or playing poorly, winning and losing.
To measure how “good” a team is, we’ll use a projection to estimate their true talent. Since we’re just playing quick-and-dirty here, I’ll use a projection that MGL published on his blog last month. Yes, they’re a month old, but the overall true talent of a team is unlikely to change much over the course of that month, anyway. To measure how well a team is playing, we can measure their production via BaseRuns, which is now THT’s run estimator of choice. By counting all the hits, walks, home runs, etc. that an offense accumulates and that a defense allows, we can estimate their runs scored and runs allowed and convert that to wins.
Finally, we’ll just use a team’s current winning percentage to tell us how often a team wins.
So, for each team, we’ll have three numbers: their true talent wins (per 162 games), their wins based on performance, and their actual wins.
Numbers are presented here as “wins per season” and are include games through June 27. And, as usual, I’ll try to present the information with an interesting visual.
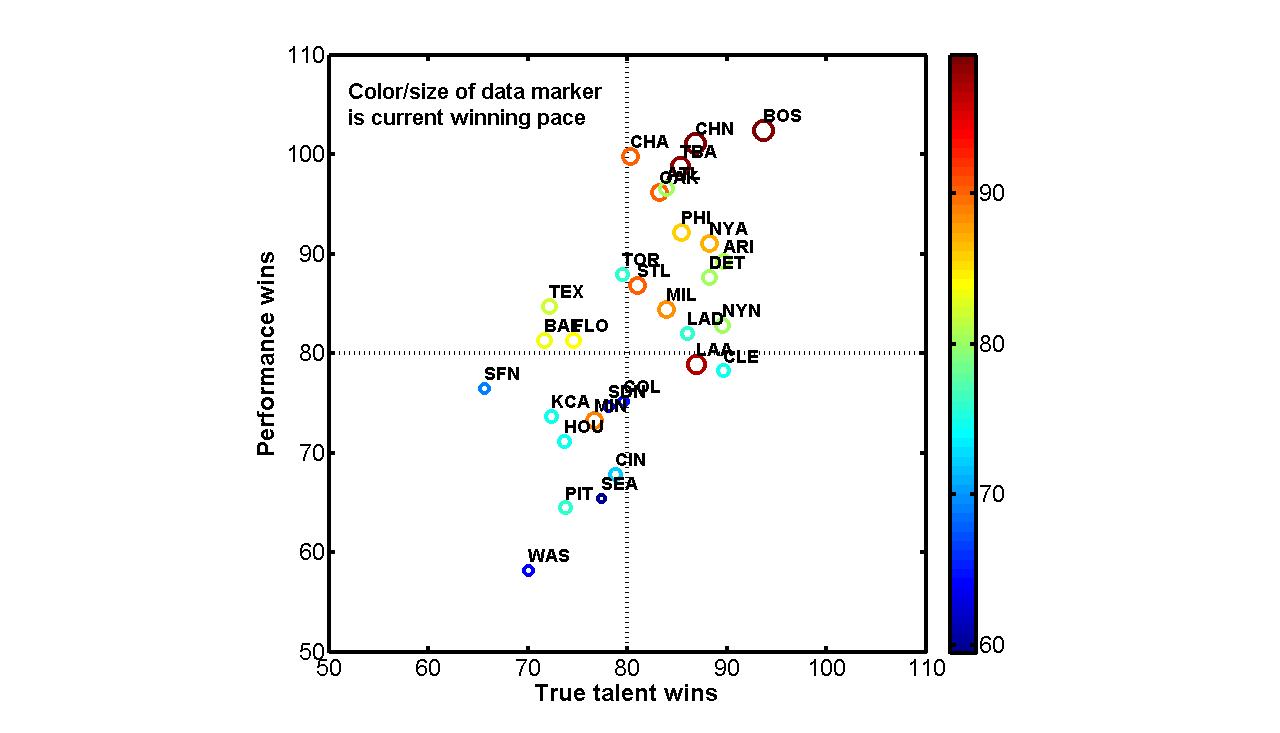
On the horizontal axis is the team’s “true talent,” or their projected wins (per 162 games) based on MGL’s numbers. On the vertical axis is the number of games a team should have been expected to win, based on how well they have hit and pitched, based on Base Runs. I’ve also given each team a different marker to give you an idea of their current winning pace. Large markers and warm colors are teams on pace to win lots of games (e.g., Boston); small markers and cool colors are teams on pace to lose lots of games (e.g., Seattle).
The plot is arranged into four quadrants. You can think of each quadrant as representing a different type of team. In the top left are bad teams that are playing well; in the top right are good teams that are playing well; bottom left, bad teams playing poorly; bottom right, good teams playing poorly.
In general, good teams tend to play pretty well and bad team poorly, but there are some exceptions. Cleveland has to rank as one of the most disappointing teams in the majors this year, and they live all by themselves in the good teams playing poorly quadrant. Their poor play is costing them, too, as they are on pace to win 70-some-odd games. They’re a 90-win team on paper playing like an 80-win team. The Mets, having recently canned their manager, are playing decently but aren’t living up to expectations either.
 |
| Genius at work (Icon/SMI) |
On the flip side, you’ve got the Rangers and the Marlins, who are below average in terms of true talent but are nevertheless outhitting and outpitching their opponents. Seattle is a slightly below average team playing horribly (and losing tons of games) while the Giants are a horrible team playing slightly below-average ball (and picking up a few wins along the way). The White Sox are a mediocre team by true talent, are being willed to play 100-win baseball by the sheer force of Ozzie Guillen’s presence, but aren’t winning as many games as expected due to the negative vibes Jay Mariotti is sending their way. The Cards are also a mediocre team, playing above-average ball, and lucking into a bunch of extra wins as well. Tony La Russa is a genius.
The Dodgers and Angels are playing interesting ball in Los Angeles (and the associated suburbs). Both appear in the same place on the plot, indicating that they have similar true talents (wins in the high eighties) and are both playing below expectations (wins in the low 80s). But the Angels are pacing the AL in wins, while the Dodgers are well below .500. The Halos are a talented team playing mediocre ball winning games whereas the Dodgers are a talented team playing mediocre ball and losing games! (And please – spare me the magic bullpen pixie dust that allows teams to overperform their Pythagorean by a whopping three games per season.) Maybe the Angels’ no-hit loss at the hands of the Dodgers is some kind of karmic retribution.
That must frustrate Oakland fans looking up at the Halos in the standings. The A’s are the inverse of the Angels: a slightly above-average team playing extremely well but with only a slightly above-average number of wins to show for it.
We should always keep in mind the three levels of winning: talent, performance and what I’ve been calling “luck” but could just as easily be called “clutch” or “timing” or “unrepeatable skill.” It’s great when a team has good marks on all three levels, but the really great baseball stories come from teams that have exceptionally good or bad marks on one or more of these levels.