Guarding the lines
Always guard the lines late in the game when protecting a small lead.
It’s one of those things you are supposed to do if you go by the book. It’s also one of those things we can put to test, now that we have the wonderful data from Retrosheet and Gameday. Actually, when HITf/x data and all the fancy stuff Sportvision showed us a few weeks ago at the second PITCHf/x Summit are available, we will be better equipped to analyze this common wisdom.
But, as I said, we can do something with what we have right now. My toolbox for the following work consists of Retrosheet data, Gameday hit locations (both for year 2008) and win expectancies. (Please, don’t skip the References and Resources section at the end of this post, and be as thankful as the author to those who make this kind of analysis possible.)
I’m just showing a path. Thus, you will encounter some oversimplifications. I hope I won’t omit to point out any of them. Somebody (myself?), I hope, will resurrect this article when we have HITf/x, fielding positioning and what else, and redo it more rigorously.
I’m sure it’s time to start. Let’s define the moment: “late in the game, protecting a small lead.” There are many situations that abide by those couple of requirements, and I don’t think we can draw a line separating late-in-the-game-protecting-a-small-lead from everything else. Thus, simplification number one is that I chose just one scenario; replicating this study for other situations won’t be hard.
“Late in the game”: There’s nothing later than the bottom of the ninth. (Well, there are extra innings too, but for the purpose of our analysis they are equal to the last regulation inning.)
“Protecting a small lead”: You can’t have fractional leads, thus the smallest lead is one.
Since the home team can not be leading by one in the bottom of the ninth—otherwise the game would be over and there would be no use in thinking about guarding the lines—here is the complete scenario:
You are managing the visiting team, you are up by one and the home team sends the first batter of the ninth inning to the plate. Is it wise to move your corner infielders toward the foul lines?
The answer has to be different depending on the spray tendency of the particular hitter but, since the common wisdom sentence begins with “always,” we are going to answer considering an average (in term of spray tendency) batter. Well, an average right-handed batter, but again, the analysis can be easily replicated for a lefty.
The rationale in choosing to protect the lines is that balls hit through the hole usually go for singles, while chances are that those passing close to the bags will become extra bases. Thus, moving the first and third basemen toward the corners implies that some outs will become singles, while some doubles will become outs. Obviously the common belief is that the tradeoff is beneficial for the team on the field. We are talking about infield defense, so ground balls and some line drives are involved in the decision process.
Simplification number two is that we will consider just ground balls. This is probably the one that will more heavily impact the results of the study. And this is surely the one I won’t have made had HITf/x data been available for one complete season.
Unfortunately, with Gameday location and batted ball type data, we can not infer whether a line drive might have been caught by a conveniently positioned infielder or left the infield 15 feet from the ground. HITf/x vertical angle and speed off the bat will help us in this area. While we wait, let’s stick with just ground balls.
Simplification number three is that I considered three possible outcomes for a ground ball: ground out, single, double. At least two others can happen in a bases empty situation, namely an error or a triple. I left triples out* because of their rarity and errors* because I supposed they are not dependent on the infielders positioning. This might be not true, but again should not be difficult to take into account when this analysis will be exhumed.
*Actually I considered triples as doubles and errors as ground outs.
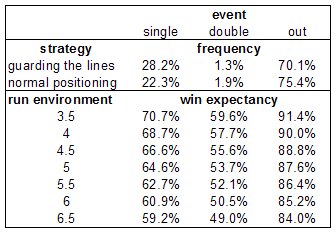
The following table, produced with the help of our WPA Inquirer, and a few multiplications is what we need to confirm (or disprove) the credo cited at the beginning of this article.

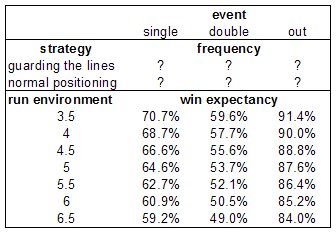
Only six cells need to be filled before we are done, but some work is required, so let’s roll our sleeves up.
Today’s first chart shows the spray tendency of the average right-handed batter.
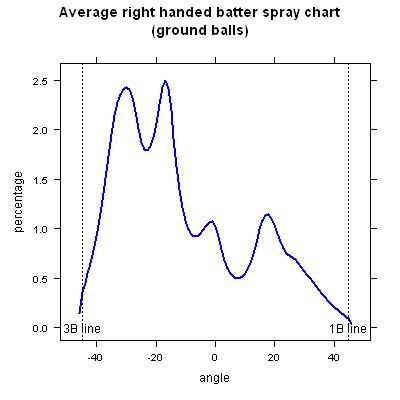
The higher percentage of grounders on the left side is not surprising. HITf/x data will tell us if the minor peaks along the graph are something real or just a scoring bias of the stringers, the people who compile the data. (It is likely that a human scorer tends to mark ground balls turned into outs closer to the fielder’s position.)
Next we’ll look at the percentage of grounders converted into an outs by either the first or the third baseman, by direction.

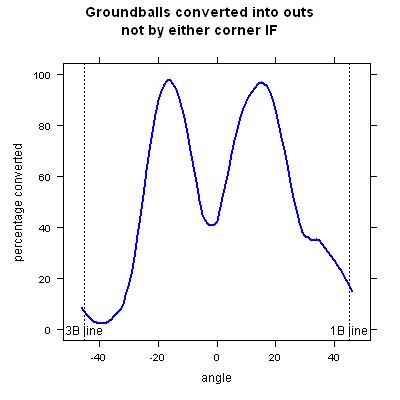
Nobody should be surprised by this chart, either. And nothing revolutionary appears on the following picture, showing—for grounders not turned into outs by the corner infielders—the percentage converted into outs by the other fielders.
We are left with the hits. When the grounders go through (i.e., they are not turned into outs by any infielder) they become, most of the time, singles. Some go for extra bases and, since this is the interesting part for the current analysis, here is a chart showing the percentage of grounders gone through that resulted in extra base hits.
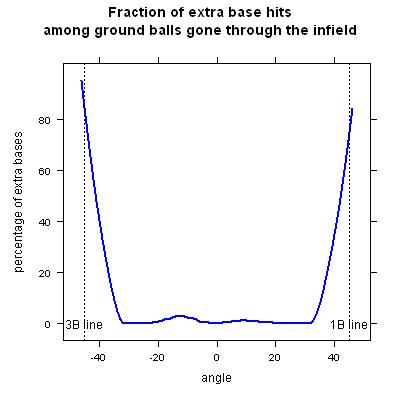
We were expecting a higher percentage of doubles and triples down the lines. In fact this is the idea behind the strategy we are testing.
Let’s see what we have now in our toolbox.
For each angle going from -45 degrees (down the third base line) to +45 degrees (first base line) we have the following quantities (we have just used them to produce the previous charts):
{exp:list_maker}a. proportion of grounders hit at that angle;
b. percentage of grounders converted into outs by either corner infielder;
c. percentage of grounders (those remaining after point b) converted into outs by any other fielder;
d. of the balls gone through (all the grounders minus those at both point b and c), the percentage that became singles and
e. the percentage that became extra base hits. {/exp:list_maker}
Thus, for each angle we can find
{exp:list_maker}f. the percentage of outs on grounders as b + (1-b) * c;
g. the percentage of singles on grounders as (1-f) * d;
h. the percentage of extra base hits as (1-f) * (1-d), or (1-f) * e. {/exp:list_maker}
Weighting each angle by a, we obtain the values to fill three of the empty cells on the table a few paragraphs above.
Out:    75.4 percent
Single: 22.3 percent
Double:  1.9 percent
Obviously, to fill those three cells, we might have simply calculated the the percentage of outs, singles and doubles for the aggregate (i.e. not stratified by angle) data, saving us a lot of trouble and obtaining nearly* the same result.
*It’s not the same precise result only because I performed some degree of smoothing in all the charts above.
The pain of going through the charts and points a to h is needed to produce the values for the guarding-the-lines alignment.
Everything remains the same when guarding the lines except the values of point b, that produce the second chart*.
*I’m assuming that, when shifting the corner infielders toward the lines, the middle infielders maintain their positions. Otherwise point c changes too.
Here is a modified version of that graph (in gray you can still see the original line).
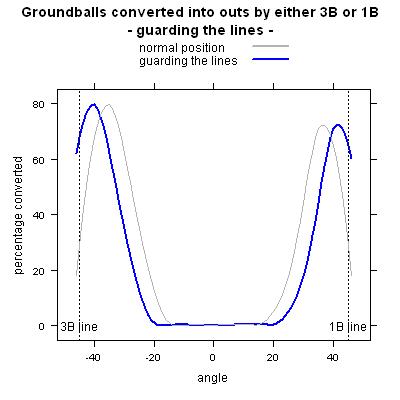
I moved the first and third basemen five degrees closer (relative to their average position) to their respective line.
Note that I never tried to calculate the average positioning of the infielders. What I have done is “stretch” the chart of the plays made by five degrees in both directions, my assumption being that the range of successful plays doesn’t vary when the fielders modify their initial position. This assumption might be debatable as well, and I’m ready to receive criticism and suggestions for improvement.
The new chart is—like every chart—produced by values, and the values are the guarding-the-lines version of point b. Thus, going again from point a to point h, we obtain the numbers to fill the remaining empty cells in our original table. And here is the table, this time complete with all the necessary values.
There are a few more multiplications left.
{exp:list_maker}Just pick a run environment—I suggest a low one, since being late in a close game a good closer should be on the mound. Let’s pick four runs per game.
Multiply the Win Expectancy in case of an out by the percentage of getting an out on normal positioning;
multiply the Win Expectancy in case of a single by the percentage of giving up a single on normal positioning;
multiply the Win Expectancy in case of a double by the percentage of giving up a double on normal positioning;
add up the three and you have Win Expectancy if playing your corner infielders straight. {/exp:list_maker}
Repeat for guarding-the-lines alignment.
And the answer is…
Win Expectancy playing straight: 84.3 percent
Win Expectancy guarding the lines: 83.2 percent
Note that this are the Win Expectancies in case the batter hits a grounder. Since the outcome of a plate appearance is a ground ball around 45 percent of the time, assuming that groundball tendencies don’t vary because the infielders are shifted, the difference between the alignments shrinks from 1.1 percent to 0.5 percent
Okay, so the difference is very low, and having done some assumptions along the way I don’t feel like stating that guarding the lines is detrimental to the team on the field in the situation we examined. (Properly valuing triples might be enough to close the gap).
On the other hand there is surely no evidence that shifting your first and third basemen toward the corners helps you.
References & Resources
Retrosheet – The information used here was obtained free of charge from and is copyrighted by Retrosheet. Interested parties may contact Retrosheet at 20 Sunset Road., Newark, Del. 19711.
Gameday data are provided by MLBAM.
Our WPA Inquirer would not have been available hadn’t Tom Tango been so kind to share his Win Expectancy tables with us.
And when you read about Win Expectancy, don’t forget about the Mills brothers (in the ’70s) and Jay Bennett (in the ’90s), who paved the way for this kind of analysis with their work.
Great article Max. Did you consider shifting the 1B and 3B by amounts other than 5 degrees? There must be some optimal position for protecting the one run lead. I guess somebody has already done an analysis on the positioning of the four infielders required to minimize the expected runs scored in an inning conditioned on the various permutations of baserunner/out positions? Or in order to minimize the probability of a hit occurring (like when protecting a two run lead late)?
David, I only tried from average positioning toward the lines from 1 to 5 degrees: the more you go away from the average positioning the lower your win expectancy – didn’t try to go in the opposite direction.
My head hurts from reading this, but the examination is fantastic.
It is articles like this one which show the true value/importance of sabrmetrics.
Baseball is rooted in traditional views that beg the question.
“Guard the lines to protect a lead”
“Why?”
Because guarding the lines is better for preventing a run late in the game, therefore you should guard the lines to protect a lead.”
It’s great to see these traditional ideas challenged/studied.
Max, great work, really interesting. Did you do the analysis just for RHBs? Do you think it would change at all if you included LHBs? Are they any more likely to hit the first baseline than RHBs are to hit it down the third baseline?
Dave, a quick run of the code for LHBs gives similar results, but the first baseman already plays very close to the line, thus I should tinker a bit with the code for an asymmetric shifting of the corner men.
Conventional wisdom doesn’t necessarily say you should guard the lines against the leadoff man. Some managers do, some don’t. But almost everybody does it if there is already a man on first. Could you test that scenario? Also, does it matter how many outs there are? I think the man on first, two out situation would be the most compelling since a double then almost always produces the tying run.
James, with a bit of working I can test any scenario. I’ll go for it during the week end.
James, I tried something for your suggested scenario and the difference between positioning is very small (still advantage to normal positioning around 0.2%).
Anyway in such a scenario, the simplifications I used in my reasoning have a heavier impact (are the middle IFs playing closer to the keystone? what about double play rate in each scenario?); thus we must be even more cautios with the results.
Max,
you chose to analyze only the scenario which is most likely to show a benefit from guarding the line, and therefore most likely that some guarding is taking place.
Can you describe what you did to establish a baseline for groundball outcomes to compare against the guarding the lines scenario? I don’t know how much difference it makes, but perhaps it would be best to use only scenarios in which it was certain that guarding the lines was not taking place, for example innings 1-6 with the bases empty.
This is another thing I should have pointed out in the article (I was sure I was going to forget a few of them).
I used MLB average, i.e. every at bat, included those where the corner infielders might be guarding the lines.
I played with the very same idea you are suggesting, but then I chose not to go with it, because in an empty bases situation fielders are more likely to be (over-)shifted according to the batters’s spray tendency.
Now I’m not sure I made the best decision (my assumption should make differences harder to spot).
Again, I can’t wait for HITF/x and fielders positioning data.
1)I was curious if the new data would show whether the shift against left handed batters or “Just guarding one line and still taking away the most likely single” has A higher WE.
2) should teams that guard the third base line bring over the shortstop further and bring the 2nd baseman to play on the left side of the infield to employ a shift for right hand batters. I would think this could be a possible best play against certain RH batters in certain situations but have never seen it.
Max, I have no comment except to say, fine article. Bravo.
@joe
“baseline” lol