Historical Win Shares Above Bench
You may come to the Hardball Times to catch up on Bill James’ Win Shares during the season. The history of Win Shares is briefly covered in this article, so I won’t go into all of that here. But I will say that Win Shares is a fairly controversial subject among hardcore baseball analysts due to a number of flaws in its framework.
The most serious flaw is the lack of “Loss Shares.” It’s nice to know that a player had, say, 200 Win Shares in his career. But if he also had 200 Loss Shares, as opposed to 150, you’d think very differently about him. The lack of Loss Shares means that Win Share totals lack perspective.
We’ve overcome that flaw by adding a stat called Win Shares Above Bench at THT. The concept is simple: first we calculate a player’s expected Win Shares, which are the number of Win Shares an average player would receive given that specific player’s time in the field, at bat and on the mound. We then take 70% of expected Win Shares and call that “bench level Win Shares.” Actually, we don’t call it anything. We just calculate it and subtract it from total Win Shares to get Win Shares Above Bench.
The result is the value a player contributed to his team above what a player with a .350 “winning percentage” would have contributed. We haven’t calculated Loss Shares, but we’ve basically accomplished the same thing by putting total Win Shares in a playing time context.
We’ve been doing this at THT for a couple of years now, but I’ve never gone back to compute WSAB for historical Win Shares. I decided to rectify that this winter. I’ve taken the first (and easiest) step by calculating WSAB for all everyday players who have played since 1900; pitchers will hopefully arrive in a few weeks. Ideally, I would have posted the results before the Hall of Fame election, but I didn’t finish in time. Still, you may find these rankings enjoyable.
My player comments are based on graphs and stats found in Fangraphs and Baseball Reference, two remarkable statistical resources.
The Top Ten
1*. Babe Ruth (478 WSAB/659 WS): The Babe actually has fewer WSAB than Cobb in this edition, but these figures don’t include the Babe’s first four years, when he didn’t play in the outfield at all. Once I figure out how to calculate pitching WSAB, Ruth will blow Cobb away. He gets a provisional first.
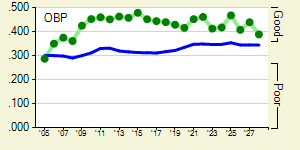 2*. Ty Cobb (486 WSAB/722 WS): Cobb’s season-by-season OBP is on the right. What an amazing record. Plus, he led the league in Slugging Average eight times.
3. Barry Bonds (472 WSAB/693 WS): And counting. These top three players form their own league, if you will; there’s a big gap in WSAB between Cobb, Ruth and Bonds and the next threesome.
4. Tris Speaker (414 WSAB/630 WS): It’s too bad Speaker played the exact same time as Cobb; he’s been somewhat underappreciated as a result. Cobb was voted into the Hall in the first year of voting; Speaker in the second. Speaker was a sensational fielder. In fact, he has the 11th highest total of fielding Win Shares in history, far more than any other outfielder.
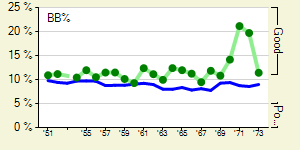 5. Willie Mays (413 WSAB/632 WS): Mays is one WSAB behind Speaker. He sure learned to take a walk late in his career, didn’t he? Take a look at the graph on the left.
6. Honus Wagner (410 WSAB/598 WS): The first infielder among the greats, Wagner dominates the all-time shortstop list like no other player at any other position.
7. Hank Aaron (389 WSAB/643 WS): There’s another, smaller, gap between the second threesome and Aaron. Holder of the career home run record, at least for now. According to Baseball Reference, he would have hit 801 home runs in today’s environment.
8. Mickey Mantle (385 WSAB/565 WS): Here is the power of WSAB: Mantle accumulated about 80 fewer Win Shares than Aaron, but they’re virtually even in WSAB. Aaron had a great, long career; Mantle had a greater shorter career. The Mick didn’t accumulate as many “Loss Shares” as Aaron, and any all-time ranking should reflect that.
9. Ted Williams (381 WSAB/555 WS): Same thing with The Kid. Williams famously had several years lopped off his career due to two different wars. If not for that, he’d be right up there with the top threesome.
10. Stan Musial (375 WSAB/604 WS): Isn’t it amazing how many great players seemed to come in pairs? Cobb/Speaker, Mays/Mantle, Williams/Musial? Musial finished in the top ten in National League MVP voting in 13 of 14 consecutive years. I recently read a blogger nastily complain that Cal Ripken didn’t get 100% of the Hall vote. Musial only got 93% of the Hall vote, as did Williams. Really, how is that possible?
The Next Ten
11. Eddie Collins (357 WSAB/574 WS): Another gap down to the highest-ranked second baseman. Collins started young and played extremely well until he was 40.

12. Rogers Hornsby (331 WSAB/502 WS): Hornsby is another player whose star rises with WSAB. He was never the same after breaking his leg at the age of 34, and his shortened career gets shortchanged by pure counting stats. Did you know that the year Hornsby hit .424, he actually finished second in the National League MVP race to a pitcher? Dazzy Vance took the honor in the first year of “official” MVP voting.
13. Mel Ott (325 WSAB/538 WS): Ott deserves this ranking, although his home run totals were significantly boosted by the Polo Grounds; he hit 323 home runs in New York and 188 elsewhere. He’s the first player on this list to have never won an MVP award, despite leading the NL (or tying for the lead) in WSAB four times.
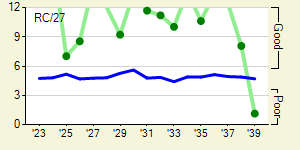 14. Lou Gehrig (318 WSAB/489 WS): With his short career, Gehrig is another player whose career is boosted by WSAB. He ranks 19th in total Win Shares among position players. First basemen don’t garner a lot of fielding Win Shares; Gehrig had only 34. But he was a spectacular hitter. In the accompanying graph, his Runs Created per game is literally off the chart for many years.
15. Joe Morgan (306 WSAB/512 WS): My brother had Joe Morgan on his APBA team his entire career. During his Houston tenure, when Joe’s stolen bases were down due to an injury, my brother wrote him to ask him how he was doing. Joe wrote back and told him not to worry; he’d keep stealing bases. And he did.
16. Frank Robinson (304 WSAB/519 WS): Let’s play What If: Robby had a .724 Slugging Average in Fenway Park.
17. Rickey Henderson (294 WSAB/535 WS): Rickey is another player whose standing is reduced a bit by WSAB. Heck, he’s probably still playing somewhere. His career walk rate was the same as Morgan’s (17%). Only the most feared sluggers, like Ruth and Williams, had higher walk rates.
18. Mike Schmidt (282 WSAB/467 WS): The highest ranking third baseman of all time, despite that .196 average his rookie year. Schmidt may have had one of the most dramatic improvements in contact rate ever. He struck out 180 times when he was 25. By the age of 36, he was down to 89 strikeouts with no loss in power.
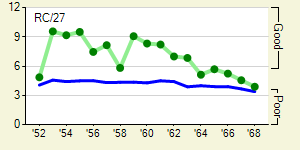 19. Eddie Mathews (266 WSAB/450 WS): According to Baseball Reference, Schmidt’s most similar batter is Mathews. It’s a good thing that Mathews broke into the majors at 20, because his skills mostly went downhill from there. As you can see in the Runs Created graph, he slumped in his mid-20s, but his career was otherwise a gently sloping downhill ride.
20. Nap Lajoie (265 WSAB/425 WS): This listing is unfair to Lajoie, because I only collected stats from 1900 on, four years after Nap broke into the majors. He should be right up there with Collins, Hornsby and Morgan. His crossover to the new American League’s Athletics in 1901, and the subsequent crazy court ruling and trade to Cleveland, were key events in the formation of the junior league.
The Twenties
21. Jimmie Foxx (264 WSAB/435 WS): Add Gehrig and Foxx to the list of similar players playing at the same time. Foxx’s RC/G graph looks very similar to Gehrig’s. Foxx’s career also seemed to peter out early; he was pretty much done at the age of 34.
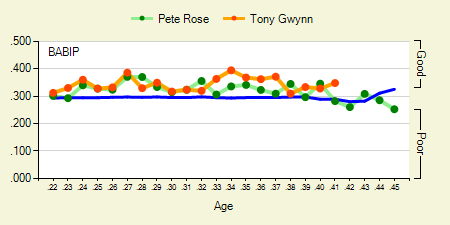
22. Pete Rose (260 WSAB/547 WS): And now we come to Charley Hustle. Rose had a ridiculously long career, and he has the largest gap between his Win Shares and WSAB totals of any player ever (he ranks 12th in total Win Shares among position players). Like the most recent Hall inductee, Tony Gwynn, Rose was a hitting machine. Here’s a graph comparing the BABIP of Rose and Gwynn (the blue line is the league average). The two stars track each other very well, though Gwynn maintains an awesome pace in his 30s.
23. Joe DiMaggio (251 WSAB/387 WS): Joltin’ Joe gets a huge boost from WSAB, as he should. His career was shortened by the war, but DiMaggio finished in the top 10 in MVP voting in 10 of the 13 years he did play. If you added back his war years, he’d probably have about 320 WSAB, right around Gehrig, his one-time teammate.
24. Sam Crawford (251 WSAB/442 WS): In the new Baseball Historical Abstract, Bill James recalibrated Crawford’s stats 20 years forward (starting from 1900 to 1920, etc.) and came up with 494 career home runs for the right fielder. He was a slugger before sluggers were appreciated, leading the AL in extra-base hits four times and placing second four more times…
25. Reggie Jackson (233 WSAB/444 WS): … as opposed to Reggie, who was way appreciated. Reggie was all power: his batting eye was OK but not great, he was an OK not great fielder, he had good but not great speed. Mr. October? He did bat .357/.457/.527 in the World Series, but .227/.298/.380 in League Championship series.
26. Paul Waner (232 WSAB/423 WS): Three great right fielders in a row. In Waner’s second year, he won the league batting title at .380, as well as the MVP. Like Mathews, his production steadily declined after that. Unfortunately, he didn’t break into the majors until the age of 23, which put him behind the starting line of most of the players so far. He had batted .369, .356, and .401 in the Pacific Coast League when the Pirates bought his contract. If he had spent those years in the majors, he would probably rank among the top 20 players of all time.
27. Carl Yastrzemski (231 WSAB/488 WS): WSAB brings Yaz’s stratospheric Win Shares total back down to earth, but he’s still 27th all time. I wonder if his 1967 was the greatest, most dramatic year ever. He won the MVP almost unanimously; one writer infamously cast his first-place vote for the Twins’ Cesar Tovar instead. While his 1970 was just as good on the surface, the way he carried the Sox to the pennant in ’67 was stunning. With two outs and runners in scoring position, Yaz batted .396/.540/.750 and seemed to win that pennant race all by himself.
 28. Gary Sheffield (230 WSAB/404 WS): Back to right fielders. When he retires, Sheffield should be a first-ballot Hall of Famer. Remarkably, however, Sheffield has never won the MVP. Sheffield really arrived as a hitter in 1995 and 1996, when he was 26, by getting his plate discipline under control, as you can see in the right-hand graph.
29. Al Kaline (230 WSAB/443 WS): The last right fielder you’ll see on this list for a while, Kaline never played a game in the minor leagues. He actually wasn’t very good his rookie year, batting .276/.305/.347 with only four home runs and 18 doubles. Kaline never had a great, standout year. He never hit 30 home runs, never won the MVP. But he consistently produced a great all-around game year after year.
30. Willie McCovey (229 WSAB/408 WS): McCovey was the unanimous NL Rookie of the Year, despite batting only 192 times. It helps that he batted .354/.429/.656 in those at bats. 1969 was his MVP year: he batted .394/.553/.789 in “late and close” situations. 1969 is the year of the Mills Brothers famous first foray into Win Probability Added; they called it Player Win Average. McCovey had the highest average, .677, handily beating Rose’s .611 PWA.
The Thirties
31. Yogi Berra (224 WSAB/375 WS): The first catcher on our list, Berra gets a boost from WSAB. He would be 51st if we ranked these guys by total Win Shares. Win Shares goes out of its way to properly credit catchers with defensive value, but there’s no getting around the shortened careers catchers typically have. From 1951 through 1956, Berra won three MVP awards and came in second twice. His WSAB rank each of those years: 2,4,3,3,7,2.
 32. George Brett (220 WSAB/ 432 WS): Ranking a bit behind Schmidt and Mathews in the third base race, Brett has one of the most interesting plate discipline development lines, as shown in the graph. He worked 38 walks in 422 plate appearances in 1984, then shot up to 103 walks in 665 plate appearances in 1985. After that, his walk rate slowly declined.
33. Frank Thomas (220 WSAB/384 WS): The Big Hurt should also be a first-ballot Hall of Famer; just think how he would rank if he could field or run? As a first baseman, he batted .337/.453/.625, as a designated hitter, he batted .277/.399/.515. However, that huge variance is primarily driven by the fact that he primarily played first base in the first half of the ’90s, when he was awesome, and DH’d in his later years.
34. Arky Vaughn (218 WSAB/356 WS): I’m guessing that you don’t know a lot about the second-best shortstop of all time. Vaughn played short for the Pirates and Dodgers in the 1930s and 1940s. Offense in the 1930s National League was electric, but his bat still stands out. His .385/.491/.607 in 1935 is probably the best year by any shortstop other than Wagner. Vaughn actually quit baseball for three years, between the ages of 32 and 35, after getting into a fight with Leo Durocher. Because of his short career, he’s someone who is better appreciated by WSAB than total Win Shares.
35. Jeff Bagwell (218 WSAB/388 WS): Bagwell and Thomas: born on the same day, reached the majors the same year and currently have just about the same WSAB andWin Share counts. It’s a shame they won’t enter the Hall at the same time.
36. Tony Gwynn (212 WSAB/398 WS): This newest Hall of Famer clearly belongs.
37. Craig Biggio (210 WSAB/425 WS): Biggio is the fifth-greatest second baseman of all time according to this list. Minute Maid Park has definitely extended his career. Last year, he batted .298/.346/.522 at home and .178/.253/.288 on the road.
 38. Dick Allen (207 WSAB/342 WS): Dick Allen is the first person on this list who has been rejected by the Hall of Fame voters. In fact, Allen never received more than 19% of votes in any year. Although I believe Allen was often misunderstood—he was a highly emotional man during a highly charged racial and social period—he wasn’t exactly an ideal teammate. He was a divisive presence who would refuse to play, retire while the season was in progress, and generally hold contempt for any manager who actually tried to manage him.
I have also seen it said that Allen’s career wasn’t long enough for him to make it to the Hall, but that’s hogwash. He played parts of 15 seasons, one more than Vaughn (who also quit over a managerial dispute). And he was a fantastic hitter. In the graph on the right, you can see his batting average on balls in play was around .370 in six of his first seven seasons. That is an extraordinary performance for a slugger like Allen.
39. Al Simmons (207 WSAB/375 WS): Simmons may have been the greatest left fielder ever before Williams and Musial came along. He didn’t have the batting eye of those two, but he was their batting equal in virtually every other way.
40. Johnny Mize (206 WSAB/338 WS): Mize lost four years in the prime of his career to the war. If you were to add those years back, he’d probably be Jimmie Foxx’s equal. Win Share totals underestimate his true value.
That’s my list for now. Depending on feedback, I may delve into the next 30 or 40 players to uncover some of the most controversial Hall of Fame choices. And I do hope to run WSAB for pitchers, too.
References & Resources
Here’s the process for calculating WSAB:
1. Calculate the total number of batting, pitching and fielding Win Shares per total plate appearances, innings pitched and games played in the field (respectively). Do this for each league and year. This gives you the average rate of Win Shares accumulation.
2. For each player (not including pitchers), multiply his playing time (plate appearances and games in the field) by the appropriate league/year’s Win Shares average rate.
3. Total those up for the player’s career and multiply by 70% to calculate his “bench level” Win Shares.
4. Subtract that from his actual Win Shares to get Win Shares Above Bench.
The data source was Sean Lahman’s fabulous database. I limited my analysis to the years after 1900 for two reasons: the 1800’s underlying data is more scarce, and Win Shares have a completely different nature in the 19th century.