How Does Eye Color Affect Day/Night Splits?
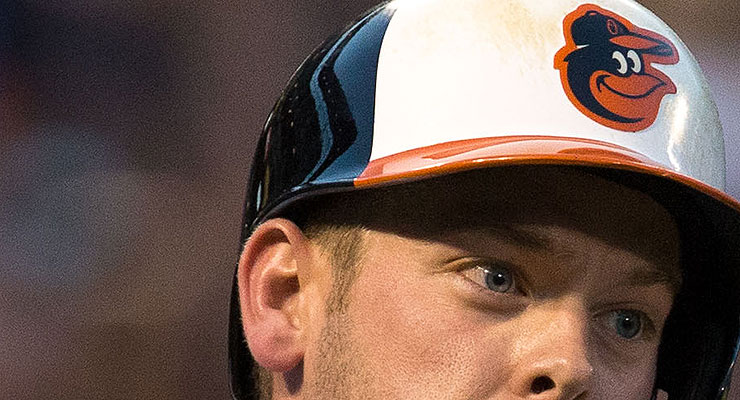
Matt Wieters has color one category eyes. (via Keith Allison)
Kris Bryant hasn’t disappointed in his first taste of the big leagues. Entering Tuesday, he had posted nearly 50 plate appearances and posted a 170 wRC+ to continue his domination of professional pitching. With the Cubs boasting a playoff probability greater than 50% and Bryant batting cleanup, the team is seemingly primed to break a streak of five straight losing seasons. Despite this, I have been skeptical of whether Bryant is all that good of a fit for the Cubs, given all the day games they play.
The Cubs led the majors in day games from 2006–2013, and were No. 2 in 2014. Certain obstacles come with the terrain of day games, such as the difficulty of playing one following a night game that ended about 15 hours earlier. Another less obvious challenge is that light-eyed players are said to struggle with sensitivity to bright sunlight. As sports optometrist Dr. Donald Teig explained to the New York Times in 2011, light-eyed people lack pigment in their macula, a pinhead-sized spot on the retina. The relationship of macular pigment (MP) density with one’s ability to withstand glare is strong and positive, so people with a less-dense MP are more overwhelmed by bright light and glare.
In turn, their contrast sensitivity (the ability to appreciate subtle differences in the foreground and background) is reduced. Sensitivity to contrast is vital in processing the spin of a pitched baseball’s red seams as it hurtles forth. Exacerbating the matter, light-eyed people are slower than dark-eyed people to recover from this “dazzled” state. For a batter, these two issues would compound the difficulty of taking 0.2 seconds to decide whether to swing, and then 0.2 seconds to actually swing.
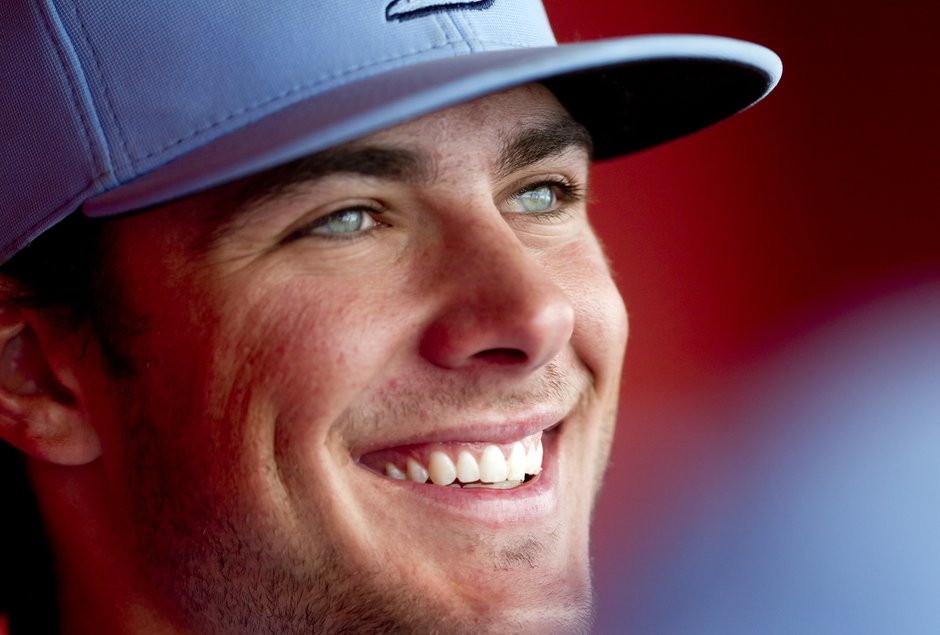
You can see this creating a disadvantage for light-eyed hitters in matinees, and well, Kris Bryant has very bright blue eyes. Cubs fans may find Bryant’s blues to be dreamy, but maybe they’ll leave him adversely affected, to a particularly large degree, as he plays more day games in Chicago. That gives rise to my question here—are players’ daytime numbers really impacted by whether they have light or dark eyes?
Bryant’s dominant four dozen spring training plate appearances, mostly taking place in the early afternoon in often-cloudless Arizona, don’t disprove that he and others are affected by bright conditions, nor does his initial stint in Wrigleyville. To see how eye color actually affects hitters’ performance in the daytime, we need to look at way more players and way more plate appearances.
In 2011, when eye color emerged as a reason for Josh Hamilton’s poor daytime numbers, Dave Cameron looked at a crowd-sourced group of 25 blue-eyed players and didn’t find any prevailing day/night split. I want to take the topic a step further: by looking at hitters’ stats in a specified period (2006-2014) and classifying almost every player’s eye color with more granular distinctions. That means including all players possible, green- and brown-eyed ones included, and identifying variations among standard colors. With this process, not only can we compare players to themselves (with their personal day/night splits), we can compare players to each other (across eye colors).
Classification Procedure
To assign players into buckets, I’m going to use the nine-category grouping system designed by four ophthalmologists in a paper that appeared in Clinical and Experimental Ophthalmology in 2011. There are two broad categories—blues, and then a continuum from green to hazel to brown—with subcategories that follow in the table below:
| Eye Color Categories |
|---|
| Blues | Green to Hazel to Brown |
| 1) Light Blue | 4) Fully Green |
| 2) Darker Blue | 5) Green with a brown iris ring |
| 3) Blue with a brown pupil ring | 6) Peripheral green/central brown |
| 7) Brown with some peripheral green | |
| 8) Fully brown | |
| 9) Very dark brown (appearing “black” in many cases) |
The categories were designed so that, while you and I may differ in classifying eye colors into one of the nine buckets, it will generally only be by one subcategory above or below (i.e., from a “6” to either a “5” or a “7”). Obviously there’s subjectivity to this exercise, but I was as objective as possible, going over each player twice to compare my identifications. You can look at the approximately 800 grades in the Google doc below.
I deliberately avoided a pixel-based classification method because player pictures weren’t taken with the idea that they’d be used for scientific study. The color examples in that 2011 Ophthalmology paper depict eyes open wide with just a tiny speck of glare. When it comes to player photos, variations in the openness of eyelids, the dilation of pupils, the amount of glare, and the position of glare could all cause issues with applying a pixel-based method. Even sampling a speck of color using something like Photoshop’s eyedropper tool will yield different results, depending on where exactly in the iris one obtains the information. With the nine categories, I’m optimistic that any overarching effects will shine through, if they do exist.
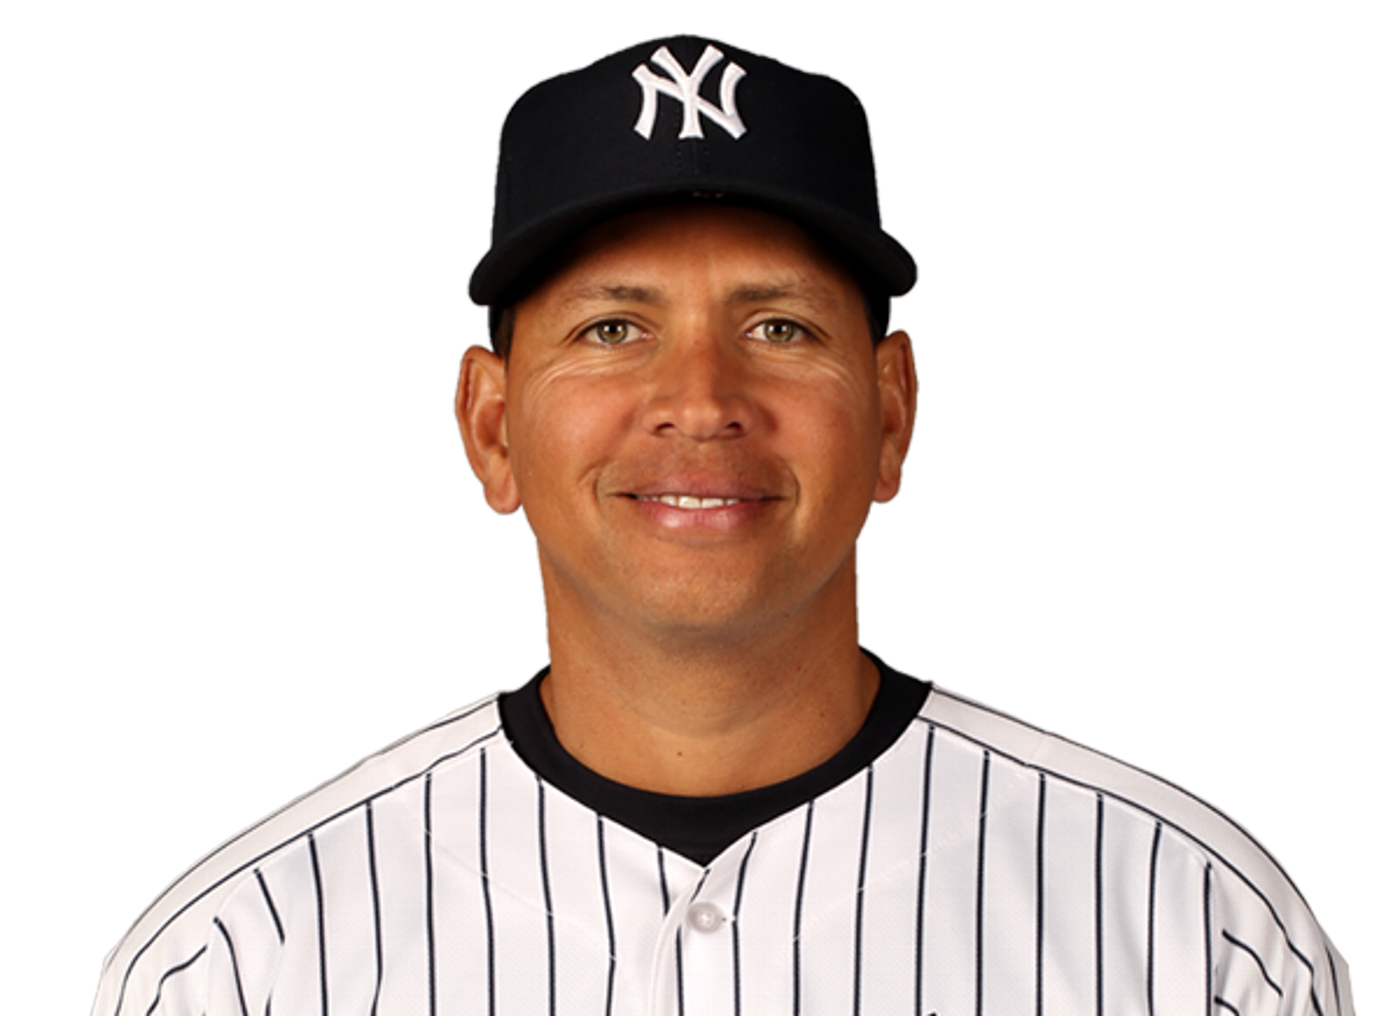
I principally looked at players’ head shots on their ESPN player profiles, using the height and width components of the image URLs to enhance each photo’s resolution. Not only is this good if you would like to closely admire A-Rod across a glass pane, but it also makes it pretty easy to put a “grade” on a player’s eye color. Alex Rodriguez has a green iris with a brown ring, which I think is a pretty clear “5.”
In addition to flexible sizing, the other nice thing about ESPN’s head shots is that they have as close to standardized lighting as we’ll find. Players will consistently be wearing their home white jerseys in lighting-controlled environments. Eye colors will otherwise look different as ambient lighting changes, heightening the likelihood that grades taken from action shots are inconsistent. Visual context matters! One’s surroundings, shirt color, and emotions can all influence the appearance of eye color. Due to glare and/or blurriness, I did at times consider separate high-quality photo-day images for clarity (usually captured by USA Today), but an ESPN photo was always the “baseline,” and thus was needed for a player to be included. ESPN has these freely scalable images for players who were in the majors from 2011 onward.
Sample and Set-up
Players’ eye color classifications were applied to all of their career statistics from 2006 onward. (Eye color can change with age, but it’s infrequent, and we’ll assume that this hasn’t happened for any player.) I cut player-seasons off at 2006 for several reasons: 1) from 2005 onward, there are steep drop-offs in the percentage of day games covered by my grades, 2) there has been a recent spike in the number of day games after night games around this time, as documented by Russell Carleton in a Baseball Prospectus article last October, and 3) amphetamine and stimulant testing was instituted in time for the 2006 season. While Carleton didn’t find any changes in day game-after-night game performance in the pre- and post-testing eras, I’ll go along with the conventional wisdom on this point that the “environment” of day games has changed.
To have plate appearances included in the sample, players needed to have totals of 10 daytime starts and 10 nighttime starts across the nine-year period. Any game beginning before 2:15 p.m. was considered a day game, and any game starting from 6 p.m. onward a night game. All other games were termed as late-afternoon games and left out so as not to create especially inconsistent differences in lighting and shadows in the day/night bins. I looked at only plate appearances taken by players who were in the starting lineup, and no pitchers were included. Plate appearances at domed stadiums and exhibition sites were tossed out, as were daytime plate appearances taken in retractable-roof stadiums in which the roof was closed.
And again, the players needed to have that scalable ESPN profile picture for me to derive the eye color. Here’s the percentage of daytime plate appearances, based on the above criteria, that I can account for with an eye color and incorporate into this study:
| Percent of Applicable Daytime PA Matched with Eye Colors |
|---|
| Year | Percent |
| 2006 | 61.2% |
| 2007 | 70.0% |
| 2008 | 78.9% |
| 2009 | 89.0% |
| 2010 | 95.4% |
| 2011 | 98.9% |
| 2012 | 99.6% |
| 2013 | 99.1% |
| 2014 | 98.0% |
Each player’s stats across the sample were bucketed by park (as Tom Tango did in this 2011 article), and then the delta method was applied. Here, the delta method dictates that we take the smaller total of either day or night games (almost always the former) so that player-park samples are equally represented in the daytime and night.
At first, I’m going to remove catcher seasons, as catchers are subject to much different usage patterns. We can see this in the charts below, which plot the percentage of daytime starts in a season as a function of that year’s PA with a LOESS smoother put through the points. Infielders/outfielders are on the left, and catchers are on the right.
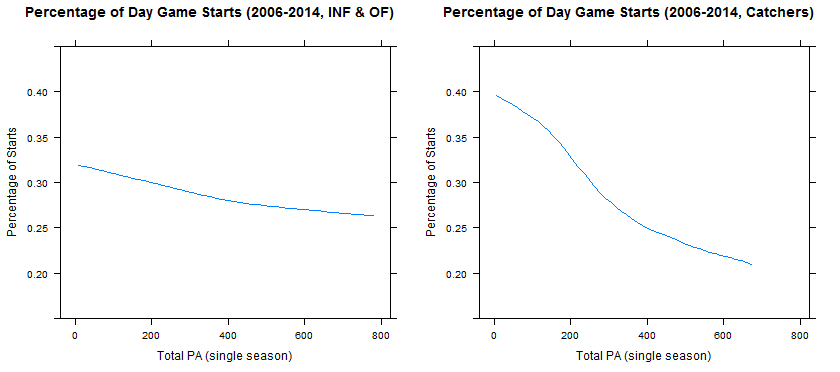
In spending time at baseball’s most grueling position, full-time catchers generally play far fewer day games than their backups. Chances are, your favorite team’s backup sees a healthy amount of playing time in matinees so the full-time backstop can avoid the day game-after-night game. Catchers can also bias the data when the full-timer is given the preceding night off to be rested for the upcoming day game. The general point is that the rest allotted to catchers could obscure day game effects. Meanwhile, other position players play right around 30 percent day games, a total that decreases at a far gentler rate with rising plate appearance totals.
Included in all wOBA figures presented are adjustments for the quality of opposing pitchers and the left/right platoon advantage.
Results
If we consider all included players (without taking eye color into account), there’s no prevailing day/night split. Infielders and outfielders registered a .3341 wOBA at night, and a .3345 wOBA during the day.
Now let’s split infielders and outfielders by eye color classification. The Difference column is key; this is where Day wOBA is subtracted from Night wOBA, meaning that negative differences will indicate that players do worse in day games. Also, pay close attention to the Standard Deviation column, which indicates the uncertainty level for each eye color subset. All differences, standard deviations, and confidence intervals are expressed as wOBA points.
| Infielder & Outfielder Day/Night wOBA Splits by Eye Category |
|---|
| Eye Color | PA | Day wOBA | Night wOBA | Difference (D-N) | Std. Dev. | 95% Confidence Interval |
| 1 | 16,229 | .3333 | .3305 | +2.8 | 5.6 | (-8.2, +13.7) |
| 2 | 23,560 | .3335 | .3329 | +0.5 | 4.7 | (-8.6, +9.7) |
| 3 | 13,011 | .3245 | .3258 | -1.2 | 6.2 | (-13.4, +11.0) |
| 4 | 14,488 | .3420 | .3445 | -2.5 | 6.0 | (-14.3, +9.2) |
| 5 | 24,909 | .3478 | .3416 | +6.3 | 4.6 | (-2.7, +15.2) |
| 6 | 14,453 | .3232 | .3200 | +3.2 | 5.9 | (-8.4, +14.7) |
| 7 | 31,009 | .3412 | .3374 | +3.8 | 4.1 | (-4.2, +11.8) |
| 8 | 56,881 | .3339 | .3320 | +1.9 | 3.0 | (-4.0, +7.8) |
| 9 | 81,979 | .3309 | .3351 | -4.2 | 2.5 | (-9.0, +0.7) |
We’re given results that run completely against our Bayesian prior. The lightest blue-eyed players hit better in the daytime, while grade 2s and 3s were basically equals in the day and night. The results are even more unexpected if we consider the green-to-brown continuum from buckets 5–9, as hitters’ daytime stats worsen as their eye color darkens. Hitters in bucket 5 hit +6.3 points better in the day, an effect that keeps shrinking until getting to the darkest brown-eyed players, who post the worst day split out of all groups at -4.2 points.
It’s important to point out that we’re dealing with pretty small samples throughout the bins. That may be surprising, given that the buckets are comprised of tens of thousands of plate appearances, but split effects such as these require greater amounts of PA. Here we’re taking a standard split (day/night) and breaking it up in nine ways. The corresponding uncertainties are reflected in standard deviations that are often larger than the effect sizes, culminating in confidence intervals that include 0 well within their range. Saying that the light green types hit 2.5 points worse in the day—leaving us 95 percent confident that the true estimate is between -14.3 points worse in the day and +9.2 points better—just doesn’t tell us much.
Only those with the grades 5 and 9 look the most “promising,” in that their confidence intervals are farthest from 0. But given that the signs are the opposite of the expectation, I’m more inclined to dismiss this near “significance” as noise. That could be random variation and/or other variables lurking in the background. For instance, there could be issues with varying temperature and differing concentrations of players entering games with a sleep deficit.
There are a couple of additional ways we can look at the data, so let’s not give up on this just yet. To expand our sample with the same players, let’s combine the eye color numbers across larger categories, binning the blues (buckets 1-3), light green to hazel (4-6), and hazel to dark brown (7-9).
| Infielder & Outfielder Day/Night wOBA Splits by Eye Category Range |
|---|
| Eye Color Range | PA | Day wOBA | Night wOBA | Difference (D-N) | Std. Dev. | 95% Confidence Interval |
| 1 – 3 | 52,800 | .3312 | .3304 | +0.8 | 3.1 | (-5.3, +6.9) |
| 4 – 6 | 53,850 | .3397 | .3366 | +3.1 | 3.1 | (-3.0, +9.1) |
| 7 – 9 | 169,869 | .3338 | .3345 | -0.7 | 1.7 | (-4.1, +2.7) |
The standard deviations and corresponding confidence intervals shrink, but the effect sizes do as well. Again, we’re given results that run against the prior scientific reasoning: not only are the differences the opposite of what we’d expect, but the point estimates and sample sizes are so small that we’re left with the strong possibility that eye color doesn’t have a hand in day/night performance variation.
Now let’s consider differences in walk rate (BB/PA) and strikeout rate (SO/PA) across the nine eye categories. It seems obvious that, if a batter is struggling to see the ball, he’ll strike out more and walk less. The same initial criteria were used, but no adjustments were made for opposing pitcher quality or platoon split, since strikeout and walk rates are quick to stabilize. The table shows the differences in walk percentage and strikeout percentage, where negative numbers indicate that players were worse in matinees.
| Walk and Strikeout Rate by Eye Color Category |
|---|
| Eye Color | PA | BB% Difference | SO% Difference |
| 1 | 16,229 | +0.25% | -0.26% |
| 2 | 23,560 | +0.47% | -0.23% |
| 3 | 13,011 | +0.76% | -0.40% |
| 4 | 14,488 | +0.30% | +0.47% |
| 5 | 24,909 | +0.52% | -0.24% |
| 6 | 14,453 | -0.07% | +0.13% |
| 7 | 31,009 | +0.28% | -0.54% |
| 8 | 56,881 | +0.21% | -0.01% |
| 9 | 81,979 | +0.33% | -0.47% |
Across nearly all eye colors, hitters walk more (and strike out more) in the day. In terms of walks, the lightest-eyed players perform a bit better in the daytime than at night, and in many cases top the darker-eyed players. Light-eyed players do strike out more in the daytime than at night, but the differences are comparable to those posted by their dark-eyed counterparts. More and more, it doesn’t look like eye color, in and of itself, is a prevailing factor for any differences in day/night performance in major league baseball.
Lastly, for completeness, the day/night splits with catchers included appear in the table below.
| All Position Players Day/Night wOBA Splits by Eye Category |
|---|
| Eye Color | PA | Day wOBA | Night wOBA | Difference (D-N) | Std. Dev. | 95% CL Low |
| 1 | 17,321 | .3327 | .3310 | +1.7 | 5.4 | (-9.0, +12.3) |
| 2 | 28,641 | .3362 | .3340 | +2.2 | 4.2 | (-6.1, +10.5) |
| 3 | 15,100 | .3286 | .3269 | +1.8 | 5.8 | (-9.6, +13.1) |
| 4 | 17,349 | .3420 | .3442 | -2.2 | 5.5 | (-13.0, +8.5) |
| 5 | 26,953 | .3445 | .3378 | +6.7 | 4.4 | (-1.9, +15.3) |
| 6 | 15,432 | .3246 | .3202 | +4.4 | 5.7 | (-6.7, +15.6) |
| 7 | 34,140 | .3388 | .3350 | +3.8 | 3.9 | (-3.8, +11.4) |
| 8 | 65,738 | .3331 | .3321 | +1.0 | 2.8 | (-4.4, +6.5) |
| 9 | 87,682 | .3317 | .3361 | -4.4 | 2.4 | (-9.1, +0.4) |
What changes? Well, including catchers adds in nearly 32,000 PA (+11.5 percent), and increases the size each of the nine bins. The standard deviations shrink by fractions of a point apiece. Category 1 blues get worse in matinees, but Category 2 and 3 blues get better, and Category 6 green/brown types get better. The point estimates are even more divergent from the Bayesian prior. And still, the estimates are small relative to the larger standard deviations. There just isn’t statistical significance here.
Concluding Remarks
Why might the results run contrary to what several optometrists have said in the media? I think it comes down to a few points. One is an incredibly weird, shocking trick (via ESPN Dallas):
[Dr. Ison’s] solution for [Josh] Hamilton: Find a pair of sunglasses that he’s completely comfortable wearing while batting.
Dr. Ison noticed that in one of the Rangers’ recent day games in Atlanta, Hamilton was adjusting the sunglasses he was wearing twice during one at-bat and then with two strikes, took them off completely.
“He has to find a pair that he likes and that will be the right tint for him,” Dr. Ison said. “He just has to try some different kinds and figure out the right light transmission factor for him.”
All those dozens of articles written about the burden imposed by light eye color, and sunglasses are the solution? Maybe for some, but sunglasses aren’t a universal fix. Some hitters aren’t comfortable hitting while wearing sunglasses, as the nose piece blocks part of the hitter’s line of vision, and the darker tint can make it tough for some to track the ball. The greater point here is that hitters have so many choices today that it’s easier to make necessary adjustments. There are wraparound sunglasses, refractors, some eye black, lots of eye black, and those devilish red-tinted contacts. Lacking information on who was using what in which plate appearances may seem like a source for bias in this study, but I don’t think so. It’s reasonable to assume that each player made corrective choices that maximized comfort/effectiveness. Maybe there are natural disadvantages of light eye color, but the use of modern equipment helps neutralize them.
I also think another key is that major league players likely have other exceptional, counteracting aspects of vision going for them. A 1996 study showed that the vast majority of the tested 387 Dodgers major and minor leaguers had 20/15 vision or better, with many registering at 20/12.5. In terms of stereoacuity (detecting differences in depth between two objects), 58 percent rated as “superior,” which was over three times the proportion exhibited by the general population. Their contrast sensitivity was better than the baseline, too. Major league players are starting from higher levels of vision than the public at large and minor leaguers as well. (And there are opportunities to improve through perceptual learning.)
A missing piece here is whether light-eyed players have vision characteristics that are superior to those of dark-eyed players—this could show whether the bar for performance is set higher for lighter-eyed players to be major league quality. But lacking this information doesn’t take away from the finding that eye color is a non-issue across the league. So those bright blue eyes shouldn’t present an obstacle for Kris Bryant.
References and Resources
- Eye color data is in this Google doc
- Retrosheet events and games files
- Ted Turocy’s Chadwick Register
- James M. Stringham and Billy R. Hammond, Vision Science Laboratory, University of Georgia, Optometry and Vision Science, “The Glare Hypothesis of Macular Pigment Function”
- Sam Borden, The New York Times, “Light-Eyed Players Deal With Glare, and Doubts”
- David Waldstein, The New York Times, “Hitters With Blue Eyes Are Wary About Glare”
- Dave Cameron, FanGraphs, “Blue-Eyed Players Hit Just Fine in Day Light”
- David A. Mackey, Colleen H. Wilkinson, Lisa S. Kearns, and Alex W. Hewitt, Clinical and Experimental Ophthalmology, “Classification of iris colour: review and refinement of a classification schema”
- Mitchel Lichtman, MGL on Baseball, “Pinch-hitter, DH, and Other “Penalties” (revisited)”
- Tom Tango, Inside the Book Blog, “Do hitters and pitchers perform better during the day or at night?”
Forget what he really said, Max Scherzer wants a DH in the NL just so he doesn’t throw a wrench in this analysis
That’s cute, I get it. What we REALLY need is a study of how players with two different eye colors are affected by the opposing team’s jersey color while batting both left-handed and right-handed.
So, the gist of this article, after going through all this rigamarole about eye color, is that it doesn’t matter? Wow. The next article will be whether jock strap size affects on-base percentage.
I’m guessing you aren’t much of a fan of myth busters.
Seriously, the author set out to test a clearly well advanced hypothesis. The fact that he did not confirm the hypothesis does not impact the value of the study.
It looks like he wanted him to make up stuff to prove the hypothesis.
Interesting article. This caught my eye:
“Across nearly all eye colors, hitters walk more (and strike out more) in the day.”
Leads to this question:
Are umps calling balls and strikes differently in day games?
Also, is the home plate ump’s eye color a factor?
Also, is the pitcher’s eye color a factor?
You raise two really good questions on umpires. As with hitters, we don’t have any data on each umps’ actual vision quality. But age could play an important role in the umpires’ ability to make accurate day/night calls. Based on Ben Lindbergh’s article on umpires from last October (http://es.pn/1yhPTsX), we do know that veteran umpires have a below-average rate of correct calls, while rookie umpires have an above-average rate, so an age effect may be appearing there. Perhaps there’s some sort of interaction between eye color and age, too.
Regarding the last question–given that pitching doesn’t require the split-second reaction required from batters and umpires, I’d guess that eye color is a non-issue for them.
The cynical interpretation is that many day games are on get-away days (for umps as well as teams) and they exhibit a bias towards quickly concluding plate appearances in order to get the game over faster. There’s a bias towards calling balls in 0-2 counts and strikes in 3-0 counts and maybe that disappears or even reverses on get-away days.
Excellent work Gerald. I love these projects that require a lot of manual data collection to get started.
Good work!
A few things:
1) It is VERY important to publish studies that do NOT show evidence of disproving the null hypothesis, otherwise you exacerbate the problem of publishing bias.
2) “Day wOBA is subtracted from Night wOBA..”
Typo. You mean the other way around.
3) You should mention that when you have several outputs, your significant testing is not done individually. You need to adjust for the number of outputs. The reason is that the more outputs there are, the more the chance of small p values by chance alone.
3) “The same initial criteria were used, but no adjustments were made for opposing pitcher quality or platoon split, since strikeout and walk rates are quick to stabilize. ”
This is completely wrong. In fact, the opposite is true. The “quick stabilization” has to do with the fact that the spread of talent in the pitcher population is LARGE, therefore it is even more important to adjust for pitcher quality. If the metric in question takes a long time to stabilize then it is likely that even in small samples, the pitcher quality will be the same. Another reason why I HATE that term (stabilization). Because it is often misunderstood and misused, as in this case. That being said, I don’t think it is an issue given the large sample sizes in each bucket (although, as you say, not large enough to keep the noise down relative to the small differences observed).
Good catches, MGL! I agree with all of these points.
Also, thanks for the clarification of “stabilization.”
There is some selection bias here. These guys wouldn’t make it to the major leagues if they didn’t succeed in minor league games during the day, or high school baseball games. So even the baseline of MLB guys is higher than the “Baseball” and minor league line too.
To follow up on that, I’m curious what the distribution of eye color is in MLB vs. the general population (weighted by race and country of origin).
Probably tough to control the demographic factors. Even for Americans, “people who play the sort of competitive baseball at a young age that can lead to an eventual major league career” is far from a random sample of the population. Might be better to compare the distribution of eye color among American-born Major Leaguers to eye color of kids in elite youth leagues.
The other issue is race/ethnicity. Obviously, Hispanic and black players will have darker eyes on average vs. white Americans. Unless I missed something, this was NOT controlled for. The proper test is to compare dark-eyed white Americans to light-eyed white Americans.
I didn’t include a unique control for race/ethnicity, but divvying players up by eye color does that pretty well by itself. Subcategories 1 – 4 will feature almost all white players, and so will groups 5, 6, and 7, but to decreasing degrees. It’s once you get to groups 8 and 9 that many Latin players, African-American players, etc., enter the samples (like you said), and I’d guess that they comprise the majority of the last two groups. Maybe it would be more correct to filter out the non-white players, but it wouldn’t change much about groups 1-7, and I wouldn’t expect it to drastically alter the overall results.
That should not matter as he is using the delta method which compares a player to himself during night and day. What is the difference whether a dark eyed player is white or black? In the blue eyed group, he’ll have almost all white players. The dark eyed group will be white and dark skinned players. That should not bias the results.
I was about to say the same thing.
“What is the difference whether a dark-eyed player is white or black?”
I believe there is considerable variation in the population as to when one’s peak performance is (crudely known as biorhythms)? I think for most people it’s late afternoon, but some will surely be in the evening (and others in the morning). I don’t know whether there are any racial/ethnic biasses in this regard, but I don’t think they could be ruled out a priori.
The larger point, of course, is that while someone may have a slightly different visual acuity during daylight than at night, it’s also possible that his skills at transforming that vision into production–batting stance, reaction time, muscular effort, etc.–also have a day/night difference. So maybe the reason the differences you see are so small is because these other factors obscure them. Obviously the fact that baseball is a zero-sum game, with both batters and pitchers potentially both improving under certain conditions, makes interpretation even more difficult, but some day/night differences may be more important to batters, and some more to pitchers. I would think that visual acuity would be more important to batters than to pitchers, which might explain the higher walk rate during the day. But perhaps the energy that a pitcher puts into his throwing motion, peaking for most in the afternoon, is more important than the energy the batter puts into his swing, and hence the higher K rate.
Just speculating, of course, but if you are going to be concerned with day/night differences, I think you do have to accept that there is more relevant to them than just visual acuity.
“What is the difference whether a dark eyed player is white or black? ”
The point we don’t know what difference it may or may not make. Basic science. When you are testing for causality of a certain variable and know that it is strongly (but but fully) correlated to another, easily accessible variable, you test that relationship.
Doubt it matters much, but would teams that play in domed stadiums skew the sample? Day night splits shouldn’t affect the Rays, for example, and other stadiums with retractable roofs probably play more than a few day games under artificial lights.
I account for these issues in the presented numbers. Games at domed stadiums (Tropicana Field and the Metrodome) and games in which retractable-roof ballparks kept the roof closed were removed from the sample. Exhibition sites that hosted regular season games (Tokyo, Sydney, Puerto Rico, and the ballpark at Disney in Florida) were dropped too.
I have fully green eyes and I can’t go out during the day without sunglasses, else my eyeballs get sunburned. I watch these guys with light blue and green eyes play day games and I wonder how they do it.
The answer, of course, is that the retina contains melanocytes, and actually gets a tan during spring training, with some sunburns along the way. It would be interesting to see if players’ eye color changes during the season.
Important findings in terms of our historical understanding of the game. Otherwise, we’d have to conclude that 19th-early 20th century players, heavily lighter-eyed (Irish, WASP, German descent) playing all day games, were actually much better than their stats indicate.
Interesting, but you kind have loss me a little, As a KRIS BRYANT FAN And fantasy owner, It makes me a touch
nervous. Because I also was a Josh Hamilton fan and owner until a few years ago…
It seems that this was not only a rigorously done study but also well written—for a highly technical research paper. Speaking as a trained scientist and long-time SABR member who is currently a writer (for lay folk), I wish you had included an abstract or distillation of some sort, so I didn’t have to wade through all the discussion to discover your main points. Also I’d like to have seen a list of definitions for the arcane terms—such as wOBA—so I don’t have to leave the site just to refresh my memory. Also I’m wondering what audience this paper was written for; it must be a vanishingly small number of people currently on the planet. I hope the gist of this gets out to the basic fan! My suggestion for another time is to write about visual acuity versus batting performance. Mark McGwire, before he became known for other things, allegedly had special contact lenses that “corrected” his vision to 20/10. Now that’s what I would call cheating!
Since you specifically mentioned the idea that players with lighter eye color may have difficulty with pitch recognition (caused by an inability to pick up on the spin / seams on the baseball), it would have been great to see some plate discipline stats. O-Swing% and SwStr% would be particularly interesting.
Also, I’m a bit confused by the signs on the BB/K table. You say that players walked more and struck out more in day games, but the BB% values are positive, while the K% are negative. Is there an error here, or is this because you said that negative means “worse” in matinees, and strikeouts are a negative outcome for hitters.
It isn’t an error–in the BB/K table, I assign +/- to indicate better/worse rather than more/less. The positive BB% figures indicate more walks in day games, while the negative SO% figures indicate more strikeouts.
Thanks. I will point to this in the future as the perfect example of baseball analysis having gone to terminally ridiculous lengths.