How Pitch Location Affects Caught Stealing Percentage
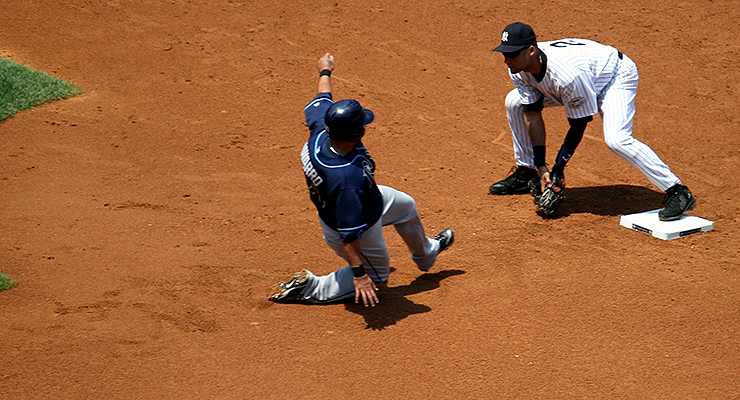
A lot goes into making a runner out by this much (via Tom Thai).
In previous studies we have explored the relationship between pitcher and catcher and which battery mate deserves credit for controlling or influencing the running game. One problem with any analysis of the battery is that there are (what feels like) a million variables at play. Lost in the translation of any event to the scoresheet (or in my case, a massive PITCHF/x .csv) is how many factors play in the culmination of a single data point. The caught stealing is no exception and, in my estimation, is the epitome of how nuanced a single outcome can be in the game of baseball.
Though my previous findings have indicated that a pitcher has more control over the caught stealing percentage of the battery and that perhaps a catcher’s pop-time is not a definitive estimator over a pitcher’s time to the plate, there are many more variables to look for in the myriad battery variables. These variables are what a statistician may call “lurking variables.” Today, we want to expose some of these pesky things so that we can move on with our lives. We will do our best to weed out an obvious one: How does pitch location type affect caught stealing rates?
The objective here is to pinpoint who deserves credit for the caught stealing. We are leaning toward the pitcher, but that could change. As Jason Parks put it in the book, Extra Innings: More Baseball Between the Numbers from the Team at Baseball Prospectus:
A catcher might possess an 80-grade arm with an ultra-fast release, but this elite skill-set will be rendered obsolete if a pitcher is leisurely to the plate. The running game is actually controlled by the men on the mound, not the men behind it. Catchers are the executioners, but pitchers have to create the environment for the execution.
Let’s further investigate how the pitcher affects the “environment” and, for better or worse, influences the “execution.”
NOTE: This article will delve into many variables and their relationships the caught stealing percentage. All data is from 2008 – 2013. We will start with broad strokes, then we will go granular in focus.
Pitch Location on Caught Stealing Percentage
Since we know that pitchers have a great deal of influence on the running game, let’s get down to business by examining the importance of pitch location. Location is key, intuitively, in many aspects of baseball. However, is the location of a pitch necessary in the scope of the battery? At first glance, I would have to say yes.
Look at it this way, if the ball is up, the catcher is in good position to make a nice transfer and throw. If the pitch is down, the catcher may have a harder time making a good and reliable transfer.
To test this point, I have pulled all pitch locations on a stolen base attempt since 2008 from baseballsavant.com. Below is the data in graphical form. On the right, we have the pitches on caught stealing, and on the left, stolen bases:

- A graph of every pitch on a stolen base attempt since 2008. “0” signifying a CS, “1” a SB.
For a moment forget the number of pitches in each zone—we are likely going to have more pitches on stolen bases based on the nature of their success. Also remember all graphs are from the catcher’s perspective (imagine you’re crouched down). So each representation seems similar in shape. If you look closely we have a oval-ish shape of lighter hex-bin’s on the stolen base graph that seems to be skewed downward. On the caught stealing graph there doesn’t seem to be much pattern other than that the highest frequency of pitches is in the zone.
Let’s think in narrower terms and ask if there is a perceived difference in balls and strikes when it comes to the chances of throwing out a would-be base-stealer.
| Stolen base attempts on a ball or strike | ||
|---|---|---|
| Call | CS% | Attempts |
| Ball | 22% | 8,765 |
| Strike | 31% | 6,921 |
The chart below suggests that strikes give a large nine percent advantage over a ball—as we would conventionally believe. But breaking this down further will require binning each pitch in zones. Below we have sample caught stealing percentage in each zone, from 2008-2013:
Breaking down CS% by Zone
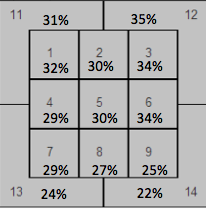
When we break the game down to zones the picture is much clearer. We have a natural progression; anything down is not favorable (20 percent and 22 percent caught stealing in zones 13 and 14). Following our intuition, any pitch relatively high is favorable for the catcher — with the highest caught stealing percentage coming in zone 12. But thinking in zones seems to be too specific as there really is no difference—as we assume— in a catcher receiving a pitch in the eighth, ninth or 14th zone.
Another of the problems here is that zones 11, 12, 13 and 14 include balls that could be classified as middle away—and do not isolate for up and down. So, to test whether there is a relationship to a ball’s orientation to the batter and the caught stealing percentage, we have binned each pitch location into “DOWN,” “MIDDLE” and “UP” using horizontal and vertical PITCHf/x components.
Up or down — Can you tell the difference?
| Stolen base attempts by vertical zone | ||
|---|---|---|
| Zone | CS% | Attempts |
| Down | 24% | 8,720 |
| Middle | 31% | 3,129 |
| Up | 33% | 4,915 |
There is an obvious distinction between a pitch down and up, with a nine percent greater likelihood of throwing the runner out. A ball up is where the catcher is going to be in position to make the throw, so it helps if the ball is up. This makes perfect sense if you consider that the catcher stands on pitchouts because being upright is the optimal position for a throw, not from his knees. Meanwhile, the difference between a ball up and down is statistically significant with a p-value around 0.0001. That is strong evidence to suggest that a pitch up is better than a pitch down in terms of catching the runner.
However, does it matter if the pitch is left, right or center in addition to north and south? Let’s take a look:
Left or Right — Does it Matter?
A quick glance at the difference between a ball left or right is far from conclusive:
| Stolen base attempts by horizontal zone | ||
|---|---|---|
| Zone | CS% | Attempts |
| Left | 28% | 7,039 |
| Middle | 27% | 3,644 |
| Right | 28% | 6,081 |
Though no distinction between the two zones can be procured from this table, let’s consider that there may be a selection bias here. If pitches down may tend toward the left or right—pitches down are inherently worse—the results may be skewing the true distinction between left and right. To investigate this claim further, let’s bin by left, middle, right and up, down and middle.
| Stolen base attempts by horizontal and vertical zone | |||
|---|---|---|---|
| Zone | CS% | Prob | Attempts |
| Right-Middle | 32% | 6% | 999 |
| Right-Up | 31% | 7% | 1,227 |
| Left-Up | 29% | 13% | 2,214 |
| Middle-Up | 29% | 6% | 941 |
| Left-Middle | 27% | 8% | 1,391 |
| Middle-Middle | 26% | 4% | 579 |
| Middle-Down | 24% | 12% | 1,924 |
| Left-Down | 23% | 18% | 3,025 |
| Right-Down | 22% | 20% | 3,386 |
As highlighted by the chart above, right of the plate and up (from the catcher’s perspective) is the optimal location for the catcher. Running a hypothesis test on the difference between a pitch right and up as opposed to left and up yields a p-value of 0.11. In other words, the outcome is not statistically significant. But keep in mind, “RIGHT-DOWN” is not only the most probable outcome, it also is the worst in terms of its respective caught stealing percentage. Thus it is likely a ball right—on the catcher’s arm side—may not be worse than a ball left, if we isolate for the adverse effects of a ball down.
For example, a pitch down may be too much for the advantage in a pitch left or right to overcome. For all pitches up, we may see the same effect. In other words, with a ball up or down, the battery may have reached the point of no return. So what if we remove all down and up samples, and focus on the differences between caught stealing percentages in the middle zone—will we see a more pronounced difference?
| CS% distribution with all “Down” and “Up” samples removed | |||
|---|---|---|---|
| Zone | CS% | Prob | Attempts |
| Left-Middle | 29% | 9% | 1,451 |
| Middle-Middle | 29% | 4% | 621 |
| Right-Middle | 34% | 6% | 1,057 |
Here the difference is more pronounced and statistically significant at a p-value of 0.0452 meaning there is evidence to suggest there is a significant difference between the right and left pitches in the middle of the plate. In other words, if we isolate all balls that were more or less neutral, the left and right distinction really does make a difference—with pitches to the catcher’s throwing arm more advantageous. This makes sense, of course, because most batters are right-handed, meaning a pitch in the right zone would be away from the batter and into the empty batting box. Also a catcher throws with his arm, not his glove — so a pitch to his arm side is advantageous.
Clearly, location is one of those “conditions” that a pitcher imposes on the catcher—further dampening or assisting the catcher’s cause. But how can we really quantify who is responsible for the caught stealing with all this new information? Yes, the pitcher is probably solely responsible for location of the pitch—maybe not the outcome (i.e., pitch framing) but the catcher still has to execute or compensate for the conditions he was given.
We are missing two things:
- How up is too up? How right is too right?
- How does handedness of the batter play in?
Let’s explore both.
How Does Caught Stealing Percentage Vary with Handedness of Batter?
On any stolen base attempt, a physical barrier stands in the catcher’s way: the batter in the box next to him. The pitcher is likely at fault for imposing this condition on the catcher, as well. For instance, pitchers who are righty may face a stacked lefty lineup making it harder for a catcher to throw a base runner out. However, that same pitch doesn’t look so bad when I have a righty in the box on a stolen base attempt. So let’s explore how far is too far (up, down, left, right), and group by batter handedness.
NOTE: Everything is from catcher’s perspective. For the following graphs, each bin is determined by two standard deviations from the edge of the zone. Important context: the vertical dimension of the zone is estimated to run from 1.6 to 3.5 feet above the ground while the horizontal dimension runs from -0.95 feet from the center of the plate to 0.95 feet from the center of the plate.
Pitches Above the Strike Zone, for Right-Handed Batters
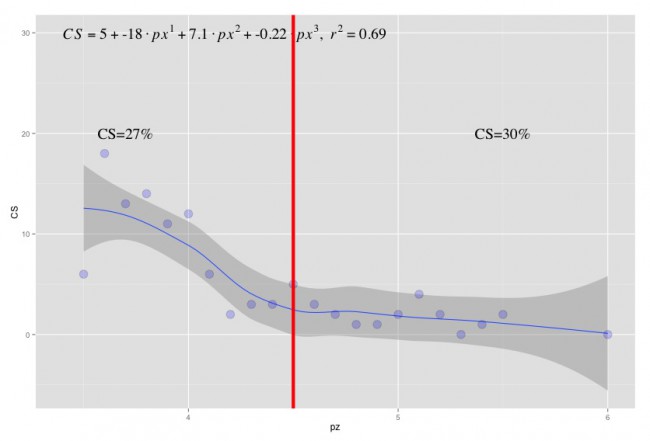
Below is a fancy polynomial regression of pz (vertical location, in feet from ground, of the pitch) against the number of caught-stealings for that location. However, we have isolated the sample to be all pitches just above the strike zone—a pz of around 3.5 feet, from the ground, and up— to infinity to isolate for the effects of a pitch left or right. The graph below is binned before by a line two standard deviations from the zone, with the respective caught stealing percentage for each bin placed on either side of the red divide. Here the red bin line sits at a pz of 5.5.
If I were a pitcher, I wouldn’t mind throwing more balls up above five feet from the ground, considering the gain in caught stealing percentage when facing a right-handed batter. With small sample sizes, thanks to PITCHf/x’s young age, I doubt this difference is statistically significant but it does captivate my interest nonetheless. Let’s move on to the same graph to see if handedness plays a role on pitches up.
Pitches Above the Strike Zone, for Left-Handed Batters
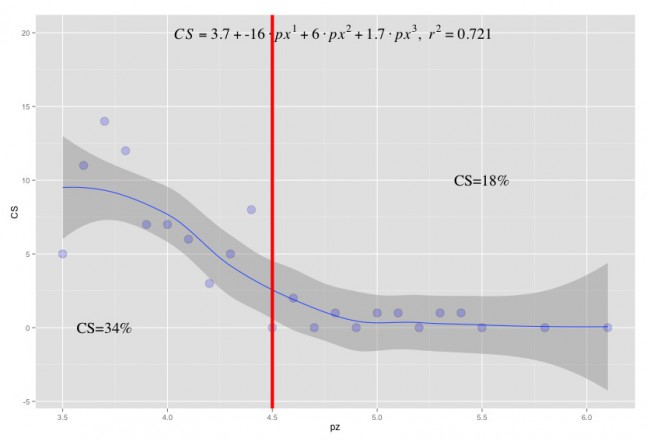
Now, we see the reverse with a lefty in the box. A pitch closer to the zone, within 4.5 feet from the ground in the vertical direction, is more advantageous than a pitch further than 4.5 (34 percent caught-stealing compared to 18 percent caught stealing). I have no way to explain this other than variation—but considering all attempts to steal second since 2008 is a rather large sample—it is something to keep our eyes on when more data become available. One possible explanation is that lefties interfere with the catcher’s throw more than righties, and a pitch higher up would increase the likelihood of the two colliding. This thought requires more fleshing out.
Pitches to the Right of the Zone, for Right-Handed Batters
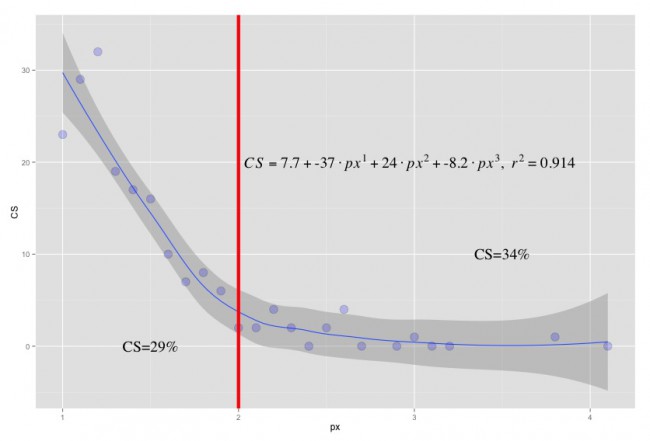
This graph uses px (horizontal location, in feet, from the center of the plate). We are looking from the right edge of the zone at around 0.95 feet, from the center of the plate, to infinity. Here, we would see a stolen base attempt with the ball being thrown away from a right handed batter. We isolated for anything directly right of the zone—from 1.6 feet from the ground to 3.5 feet above—so as to isolate for the effects of up and down.
Closer to the edge of the plate, the less likely a stolen base compared to something further than 2.2 feet from the center. Here, you would expect that the catcher has a ton of room with the lefty batter box being empty. Add in that any pitch farther right is on his arm side, we would expect farther not to be worse. But in the end it probably matters where he sets up behind the plate.
Pitches to the Right of the Zone, for Left-Handed Batters
Same graph as above, but the ball is thrown into a lefty:
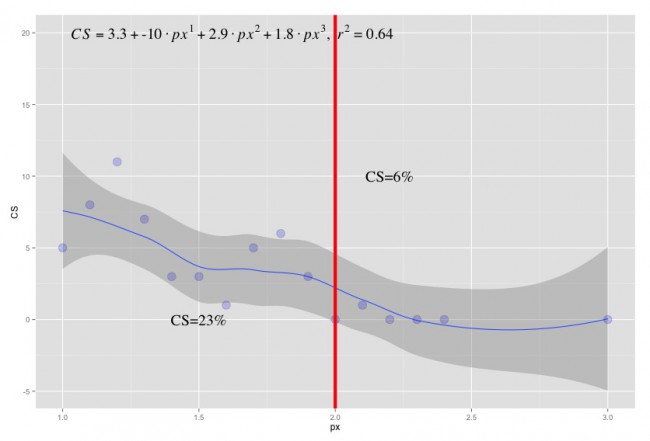
With a lefty in the box, it looks like throwing a runner out when the pitch is more than a foot outside the edge of the right side of the zone is a lost cause. You may be lucky if the play doesn’t turn into a hit batter at that point. In general, throwing inside with a lefty in the box produces a caught stealing percentage lower than the average.
Pitches Below the Zone, for Right-Handed Batters
We are back to the vertical plane. This time we are looking at anything directly below the zone, and grouping by handedness. The bottom of the zone starts at around 1.6 feet from the ground (pz). Bins are not 2 standard deviations here, due to nature of down zone.
Any pitch low, as we stated earlier, is not the best situation for the battery. Here of course, it is no different; anything closer to the zone than 0.5 feet from the ground is much better than less than half a foot from the ground (18 percent compared to six percent). Of course, relative to the average caught stealing percentage of the battery, those are terrible numbers to be banking on. A question to ask here is: Does this change when a lefty is in the box?
Pitches Below the Zone, for Left-Handed Batters
Once again, weird things happen when you look at lefties with anything to do with the vertical axis. Remember, the analysis is isolated so that the effects of left or right are removed (by taking pitches directly under the zone), so we should observe no difference between the graph when a righty is in the box from to when a lefty is at bat.
Pitches left of the zone, for right-handed batters
We are employing the same tactics that we did for the “right” charts, except we isolated for anything directly left of the zone—from 1.6 feet from the ground to 3.5 feet above—so as to isolate for the effects of up and down. The edge of the left of the zone starts at around -0.95 feet (px).
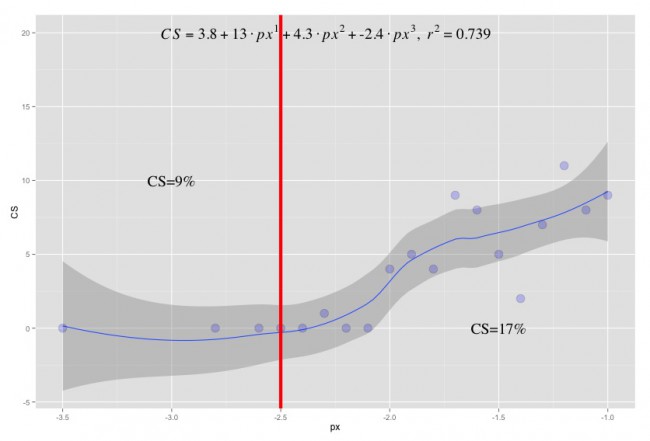
In this graph, the right handed batter has a ball thrown into him. For the catcher, the ball is thrown on his glove side—which is less advantageous. The mixture? Bad results. A measly 17 percent of steals are thwarted when the pitch is thrown within a foot and a half from the left of the zone and nine percent when more than 1.5 feet left of the zone.
Pitches left of the zone, for left-handed batters
What happens if the batter is lefty, and the ball is throw left of the zone?
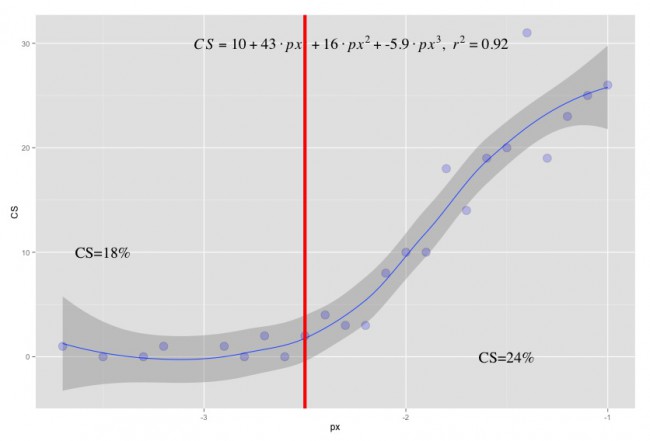
Things look better here, in a sense. Throwing left when the batter is on the other side of the plate does not mirror what happens when throwing right of the zone when a righty is at bat. This makes sense; however, given that anything too far away from the catcher’s arm (requiring him to reach further away from his body in the opposite direction of his throwing hand) would require more time to make the throw. Comparing a pitch in similar places symmetrically (right and left), a catcher’s pop-time was 1.9 seconds for the left zone and 1.7 seconds for the right zone, on average
Next Steps
Some next steps for future research, on the battery dynamic:
- Incorporate random sample of pop-times and pitcher-release times
- Model relationship between battery success and location of pitch
- Include pitch type, velocity and game state.
- Factor probability of batter outcomes into locations (foul, BIP, swing and miss, etc.)
References and Resources
- Baseballsavant.com and Daren Willman provided the awesome data
- Analyzing Baseball Data with R, for the graphing capabilities and providing the coordinates that define the strike zone
- Extra Innings: More Baseball Between the Numbers from the Team at Baseball Prospectus, for the Jason Parks quote
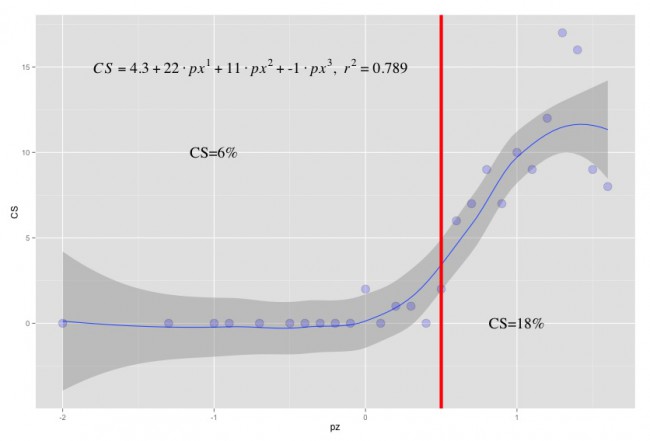
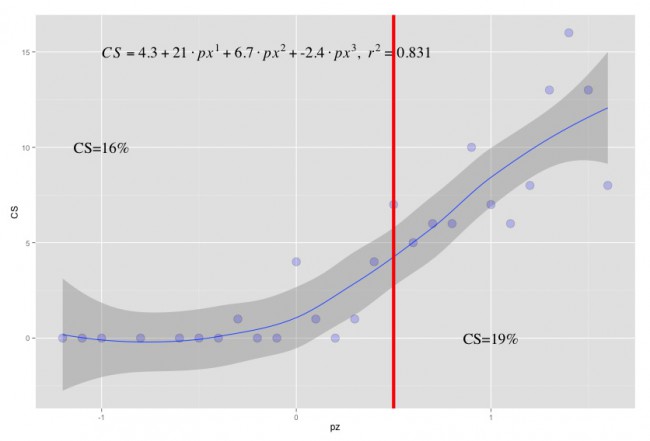
Max, in your last 4 charts, I am very confused by the text in each of them that says, for example (in the last one), “CS=18%” on the left side, and “CS=24%” in the right side, where “left side” and “right side” is pertaining to the chart itself.
Right, so I binned two standard deviations away from each zone of interest. On the last one 18% CS occurs when the pitch is ~-2.5 feet from the zone — or about 1.5 feet left of the edge of the left of the zone (located at -0.95 feet from center). Remember, these are in catcher’s perspective so that pitch would be landing above the right hand batter’s box. Anything closer to the zone than -2.5 feet is 24% CS. This differs from the “Pitches to the Right of the Zone, for Right-Handed Batters” where further (greater than 2 std’s from the right edge of the zone) is better.
Just a fascinating study. I was left wondering, with regard to pitcher control of events, if accuracy to the target as opposed to simply zone breakdown, would be of merit to evaluate?
I would have to say the target, because that will factor in accuracy and catcher influence with the true location of the pitch (intended) — I hope data like this is available in the near future.
Max – This is a terrible study. Go back and start over. First, separate SB attempts of 3B and Home from 2B. They are going to each have different factors on success rate. Second, separate left handed pitchers from right handed pitchers. Right handed pitchers allow many more stolen bases than left handers and you don’t want that factor affecting your conclusions. Third, eliminate pitchouts from the data. Pitchouts are always in the upper zones and have a very high rate of caught stealing because that is what they are designed to do and both pitcher and catcher are working together to optimize CS. Fourth, eliminate pitches that are in the dirt as they are a special case and have a very low percentage of caught stealing. Then you can rerun your study and perhaps get some meaningful results.
Peter I sent you a email in more detail. But for reference of readers, pitchouts were removed in all cases — and I primarily focused on 1st to second. Balls and dirt and pitcher handedness were not controlled for but batter handedness was — which has a higher effect on CS rate from what I found.
Geez, Peter. Constructive criticism is great, but so is humility — you know, just in case it turns out you’re the wrong one. Kinda like you are.
assuming that the data are accurately collected, a great article.
thanks for writing it.
this really brings home the idea that getting on base; not making outs; scoring runs, matters.
the minutia is just that.
assuming the data are accurate, thanks for a well researched article.
this brings home how most of baseball is getting on base & not making outs; the minutia is fun to analyze (i enjoy it all), but it is trumped by runs scored.
I agree Kevin, that’s what makes for the driving force of Sabermetrics — if identified, any small advantage should be exploited. Thanks for the read and the comment!
More great stuff, Max. Here’s a general question, prompted by your comment that “If I were a pitcher, I wouldn’t mind throwing more balls up above five feet from the ground, considering the gain in caught stealing percentage when facing a right-handed batter.”
You were talking about pitches out of the zone, but as there are clearly effects at different points in the zone, there’s going to be an inevitable tradeoff between throwing a pitch that is maximally effective at throwing out a baserunner vs. one that is least likely to be put in play by the batter. E.g., right up or right middle may maximize chances of throwing out the runner, but if the batter happens to be particularly good at hitting pitches in that general zone, it also might maximize a hit, or at least a ground ball that might advance a runner going on the pitch. Of course, one also has to take into account the probability that the runner will be going on that pitch, and the probability that the batter may have been instructed not to swing at the pitch regardless of where it locates.
It really seems to me we are heading for the day when managers are going to need computers during the game, to determine the best percentage play in a situation like this.
Some minor points:
1) You say in the text 20% and 22% for zone 13 and 14 (second figure), but the figure itself has 24% for zone 13.
2) “we are likely going to have more pitches on stolen bases”. IOW, > 50% of SB attempts are successful, and of course your data show that, as even the best pitch locations are successful at CS < 40%, let alone 50% of the time.
3) In the 3d table, I think by probability you mean % of total pitches analyzed. I wouldn’t call that probability (too easy to confuse with p-values). It is the probability of a pitch being analyzed being in that zone, but that is after the fact.
4) The top of the strike zone is only 3.5 ft. above the ground? I would have thought it was higher than that. Of course, it depends on the height of the batter, and how much he crouches, which might affect your analysis?
5) For the first handedness graph, you say in the text that pz = 5.5, but the red line in the graph is at 4.5. I don’t understand this and the following graphs. The vert. axis says CS 0, 10, 20, etc., but actual % CS rates are much higher, and clearly have nothing at all to do with the vert. axis numbers. I take it the SD for above the zone analysis is one foot, and you compare CS% for all pitches between 3.5 ft and 5.5 ft vs. about 5.5 ft. But I don’t understand why you chose this place to compare above and below, and how often would a pitcher throw a ball two feet high?
Another factor I think you’ll want to look at eventually is the pitches the runner doesn’t go on. I.e., a runner frequently does not go on the first pitch, but on some later pitch. What is it, if anything, about the pitches the runner does not go on vs. the one he does go on?
For point five — yes, it’s ~ 2 std’s for pitches located in that zone of interest. so it would be between 3.5 feet and 5.5 feet vs > 5.5 feet. It is raw CS because unfortunately CS% in small sample sizes has huge variability so the relationship would not be as easy to map — not that I am advocating one to use this polynomial model to predict CS rate, but rather to see the relationship with location.
I am interested in factoring in batter tendencies in relation to the pitch location. If I throw down the middle — is a CS unlikely because 1) he will make contact 2) he will swing and miss interfering with the CS 3) balls straight down the middle in counts where a SBA is unlikely? Your suggestion would factor in there. Thanks for the input.
Yeah, I eventually realized it was just absolute or raw numbers of CS. But it didn’t make sense to me to derive a polynomial for that, because there are two variables involved: the number of pitches at that location (the major contributor in most cases), and the % of CS. I don’t see how the polynomial can be interpreted meaningfully, given that those two variables aren’t dissociated.
And I see you have taken my point and gone even further with it. Yes, whether the batter swings at the pitch could affect the CS%. (I have never understood how catchers can catch the ball when the batter is swinging through it. No matter how times I see it, it appears miraculous to me). If the batter makes contact with it, of course, that pitch doesn’t make your database.
On that last comment, it of course wouldn’t be pitch location, as the runner has already committed himself, but something the pitcher does. Which of course is further support for the idea that the pitcher is more important than the catcher.
OK, I see now. The vert axis is just total CS, and the reason it approaches zero as the pitches go further outside the zone is because pitchers rarely throw the ball there.
Max,
You might want to look at 3 ball throwing because it is much different than throwing with less than 3 balls. In 3 ball situations the catcher is always caught in between getting the strike & throwing the runner out.
JW
Thanks for the suggestion Jerry, count is next area of focus.
During the next phase of the prediction I have looked into number of balls in the at bat or a pitcher’s likely hood to throw strikes.
As for count, game state, base state, that could be something to look at in the next article concerning the location of the pitch in the scope of a SBA.
For count, I would be interested in how the count relates to the likelihood of a negative batter outcome at the dish (for the battery on a SBA). In other words, if I throw a pitch down the middle on 3-1 with a runner on first, is a CS unlikely because the batter will likely 1) foul off 2) swing and miss 3) make contact 4) lay off on pitch forcing a walk and rendering SBA obsolete.
Batter interference is just another variable to explore in the battery dynamic that could have a large effect on any battery’s fate.
But options 1, 3 and 4 would not be in your database, would they? I thought you were analyzing only pitches on which there was an attempt to steal, resulting in either a SB or CS. If the batter makes contact, fair or foul, there is no official attempt to steal, and the same if the batter walks.
I guess you mean you are going to broaden the database of pitches examined.
Hasn’t it sort of been traditional, conventional, non-sabermetric wisdom that pitchers largely control the running game and that the type and location of the pitch affects the ability to throw out basestealers? In Ball Four, Jim Bouton noted that Yogi Berra always called fastballs with runners on base so he would have a better chance to throw out the runner. Baseball announcers constantly talk about pitchers time to the plate, etc. I don’t think this really says much that we didn’t already know.