How Much Is a Draft Pick Worth in 2014?
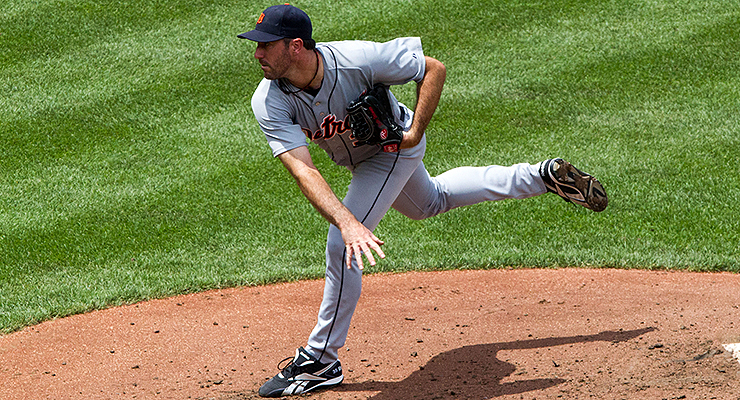
Justin Verlander was the only league-average player drafted in 2004’s top 10 picks (via Keith Allison).
Much was made during the past offseason about the value of draft picks. Under the new Collective Bargaining Agreement, a player who turns down a qualifying offer will cost the team that signs him a draft pick – its highest pick outside the top 10, which are protected. While a number of free agents seemed unaffected by this additional cost, three players ended up signing deals of equal or lesser value than the initial qualifying offer (and one of the three had to wait two months into the season to do so), and a fourth player remains unsigned.
This raises an important question – are major league teams and fans properly valuing draft picks? A number of factors make this a difficult question to answer.
What is the team’s financial situation? A small-market team that relies on homegrown talent might place a premium on draft picks, since it won’t be able to afford the high-priced free agents.
Is the team a contender or a rebuilder? A team that looks to be competitive in the present and immediate future may not worry as much about a value that won’t be felt for three or more years. Meanwhile, a rebuilding team might not mind having to wait a few years to get a return on their its investment, but may actually prefer it, as the cost-controlled player’s contributions will be more meaningful.
With these variables, it’s easy to see why such a wide range of values gets thrown around for draft picks. This past March on THT, Matt Swartz estimated that the 30th pick of the draft was worth about $6.7 million of present value. On the other hand, Dan Szymborski of ESPN wrote that the 26th pick that the Braves gave up to sign Ervin Santana was worth $19.6 million.
To better understand the true value of a draft pick and explain the differences between these projections, we need to do three things:
- Estimate the total value that each draft pick will produce, and how that value will be distributed
- Calculate the net value of each draft pick (which means estimating how players are compensated relative to their performance while they are under team control)
- Determine how value of the drafted players changes over time
Today, we’ll tackle the first question. We’ll tackle the second and third tomorrow, where we’ll fine-tune the model to project net value and tackle the issue of time, in addition to looking at how draft pick compensation affected free agents this past offseason. And on Friday, we’ll bring everything together.
How Much WAR Does Each Draft Pick Produce?
Luckily for us, this is a question that has been investigated by a number of baseball analysts. In 2009, Sky Andrecheck developed a model to estimate the average WAR that each draft pick produces, both in their career and their first six years of team control. If you’ve read anything about modeling player production by draft pick, you’ve probably seen this graph before:
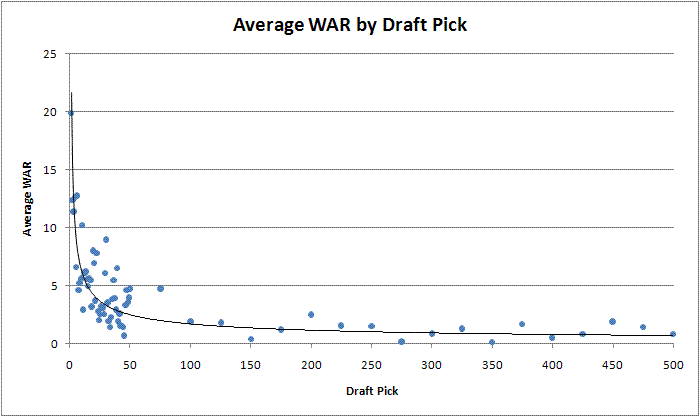
(The graph above is for Career WAR; the model for WAR under team control can be found here.)
The first thing you might notice is how quickly production drops off. On average, only the top few picks will average at least one WAR per year while they are under team control. In the compensation round and second round, the average draftee isn’t even cracking two total wins before hitting free agency.
When accounting for the recent adjustment of the WAR baseline by FanGraphs and Baseball-Reference, this model gives us an average of 7.65 WAR for a top-five draft pick during his team-controlled years, while a late first-rounder (picks 21-30) produces an average of just 2.24 WAR. Over the years, Andrecheck’s work has become the gold standard for modeling production of draft picks, but many others have performed similar work.
Erik Manning at Beyond the Box Score performed similar research in 2009, using the 1990-1999 draft classes. In that span, draft pick value doesn’t appear to decline quite as rapidly after the first 10 picks as Sky’s model would predict. I compiled my own data set (using Baseball-Reference’s draft pick search tool), looking at 15 years of drafts starting with the most recent year in which the vast majority of early picks have reached free agency (2005).
| Cumulative WAR, pre-Free Agency | |||
|---|---|---|---|
| Draft Pick | Sky Model | Manning, 1990-1999 | 1991-2005 |
| 1-5 | 7.7 | 8.3 | 8.5 |
| 6-10 | 4.1 | 5.9 | 6.1 |
| 11-15 | 3.2 | 4.6 | 5.6 |
| 16-20 | 2.7 | 5.0 | 4.3 |
| 21-30 | 2.2 | 1.7 | 2.6 |
| 31-40 | 1.9 | – | 1.8 |
| 41-50 | 1.6 | – | 1.9 |
It is important to remember that each year in the draft is extremely variable, even when looking at groups of picks. In 2002, the 21-30 draft picks matched their top-10 counterparts in production under team control. Meanwhile, only two players picked between 21st and 30th in 1999 produced any positive WAR for their team, and nobody surpassed four wins.
The same variation is seen in the upper end of the draft. The top 10 picks in the 2004 draft produced only one league-average player (Justin Verlander). By contrast, the 2005 draft was extremely deep, with seven of the first 12 picks producing at least 15 WAR while under team control.
This may not be news, but it’s something to keep in mind while evaluating draft picks and determining what the best model is to use moving forward. Sky’s model is based on decades of data, and given the extreme variability in the draft, it’s difficult to trust numbers from a five-, 10-, or even 15-year sample.
At the same time, baseball has changed dramatically in the past couple decades. Improved scouting, analytics, and player development may help teams get the most out of their draft picks. The fact that the data from the most recent drafts look very similar to the numbers from the 1990s hints at the possibility that this is in fact a trend, rather than being a blip on the radar.
Supporting this idea is the fact that evaluation of prospects is improving, as Chris Cwik investigated last week for Sports on Earth. While the article focuses primarily on the increased accuracy at ranking minor leaguers over the past 25 years, the same improvements in scouting and technology would likely apply to amateur players as well.
If we perform a nonlinear regression on the 1991-2005 sample, we see the same power relationship between WAR and draft pick (R2 = 0.57). Here’s how the more recent drafts compare to Sky’s model:
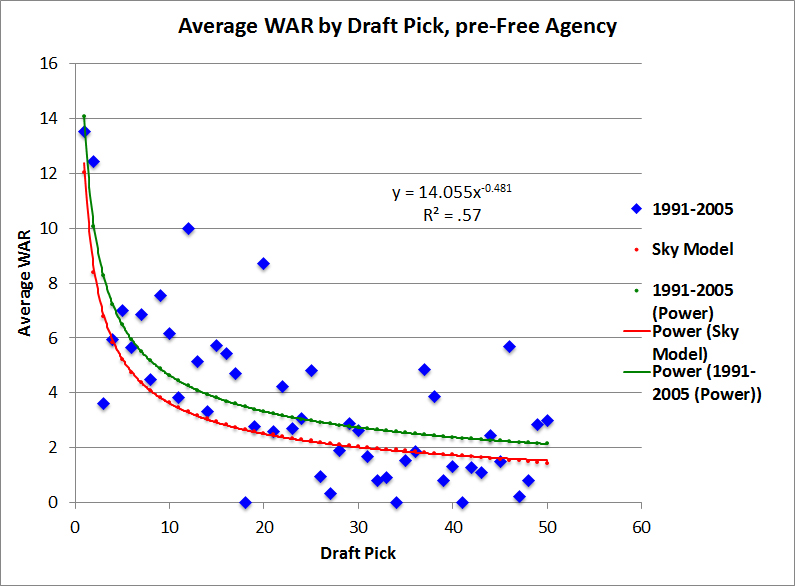
(For reference, the adjusted equation for Sky’s model is y = 12.03x-.52)
As we saw with the raw numbers, it looks like teams may be getting better at finding quality players in the middle of the first round. Nearly every pick in the top 25 has exceeded expectations based on Sky’s model. However, right around the 25th pick, there appears to be a pretty steep drop-off, and the majority of the picks fall below both models.
This actually makes some sense. Since the number of quality players in every draft is limited, an increase in average value at one point in the draft needs to be offset by a decrease elsewhere. This decrease may be seen in the later rounds, or there’s a chance that players who used to fall through the cracks to the end of the first round or the second round are now getting scooped in the top 25.
While both equations have the same R2 value, the updated model is much closer to the actual average WAR of 3.71 for the first 50 picks over the past 15 years (3.76 for the updated model, 2.90 for Sky’s model). However, this improvement is based almost entirely on changes in the first 25 picks, and the old model actually does a better job of estimating WAR for players picked in the late first and early second rounds.
| Distribution of WAR, by Model Type | |||
|---|---|---|---|
| Draft Pick | Actual WAR | Sky’s Model | 1991-2005 Model |
| 1-25 | 5.6 | 4.0 | 5.0 |
| 26-50 | 1.8 | 1.8 | 2.5 |
| Average | 3.7 | 2.9 | 3.8 |
You could make an argument for using the new model for the first 25 picks, then switch to Sky’s for the rest of the draft. While 15 years sounds like a lot of data, with the variability in the draft it’s always difficult to tell whether we’re seeing a true trend. For simplicity, I’ll use the new model (1991-2005) moving forward, but I will revisit this idea later.
References & Resources
- WAR figures for draft picks from 1991-2005 are from Baseball-Reference’s draft tool.
- WAR figures for recent arbitration-eligible players are from FanGraphs.
- Arbitration salaries are from Baseball-Reference and Cot’s Baseball Contracts.
Matthew,
If you are going to present value them, is the approach going to be to show spreads of WAR production by year and then discount those values back? If that is the case I am very interested in seeing the end result and methodology. Also, I wonder if Jeff Zimmerman’s work showing possibly declining age curves for the entirety of a career might help show why value is being pushed up as well.
I will end up distributing the total WAR across the team controlled years and then applying a discount for future WAR, check back tomorrow and Friday for more details.
As far as Zimmerman’s work, that’s one of the reasons that I chose to distribute WAR evenly (as you’ll see tomorrow), since he’s shown that at least on the hitting side of things, players enter the league around their peak and don’t decline significantly until their mid-to-late twenties. I hadn’t thought about whether changes in aging curves could be influencing the increased production by players under team control, but it doesn’t look like there is a big difference between the pre-1990 and 1990-2005 aging curves Jeff presents here: http://www.fangraphs.com/blogs/hitters-no-longer-peak-only-decline/
If anything, the more recent trend in players peaking earlier might end up meaning that draft picks are even more valuable, since those early years of team control give the highest return to the team.
Everybody loves themselves some upside, that’s what the draft is all about, the next big thing. But somewhere you have to address the crazy failure rates and the fact that a draft pick can be worth absolutely nothing, and in fact be a big fat negative on the balance sheet once you factor in the bonus paid and development attention lavished on the pick. In a best case scenario of drafting the Braves lost out on 19.6MM in value. In the worst case they saved themselves a couple MM and paid a big league pitcher with it.
Here’s a quote:
“Unfortunately, the attrition rate is gruesome. Out of the entire pool of drafted and signed players, only about 18% of them ever get even one day in the big leagues, and only about 7% of them actually accumulate three years in the Major Leagues. It’s even scarier if you examine the rounds – fewer than 50% of 1st round picks get three years in the big leagues, and from rounds two through five that number drops to about 15%. After that it plummets to the low single digits. In short, it’s very difficult to scout, draft, sign, and develop Major Leaguers, so having a plan to do so isn’t enough.”
–Paul DePodesta
Anyways, I enjoyed your article, but I think that is the big problem with all the draft studies – not enough attention paid to failing. I’d pull out the Theo Epstein line on best intentions, but that’d be one quote too many.
It is true that the majority of drafted players – even those early in the first round – will never contribute significantly at the major-league level. This is something that I’ll actually get into a bit tomorrow, but here’s a little teaser. From 1991-2005, only 30% of top-10 draft picks became roughly major-league average (or better) players, and that drops to 20% for the next ten picks.
However, when it comes to placing a number value on the draft pick, I believe that they should be treated as what they really are – a lottery ticket with a huge payout. The Braves’ 26th pick they gave up (which has a signing bonus of just under $2M) might only produce an everyday player 10% of the time, but when it does, the net value might be in the range of $50 million.
If you offered a team $1M for this draft pick, they could do one of two things. They could say, 90% of the time this is going to be worthless, so I’ll take the sure $1M. On the other hand, they could calculate that the pick will be worth an average of $5M and costs just $2M, for an average net value of $3M, and decide to play the lottery. If the prospect fails (which they likely will), it might look like a bad decision, but over the long haul, playing the odds should pay off.
Thanks for your response. One thing that gets mixed up is looking at average value of the pick instead of the specific pick itself. In the example of the Braves with the 26th pick, and lazy shorthanding 1 WAR = 5MM, for a six year controlled contract you’re looking at more than 10 WAR once arbitration cycles start for the 50MM lottery ticket to appear. Looking through history, only 3 of 49 picks have done that (gone over 10 WAR) – Alan Trammel takes up most of the average score hike with 70.4 WAR, Dave Henderson takes 27.6 WAR, and everybody’s favorite ex-ballplayer MLB analyst Dan Plesac has 17.6 WAR. That’s it. Each pick has slightly different historical results, but as you noted, the 21-30 picks in the draft aren’t exactly overflowing gardens.
But I’d also say the lottery ticket is the way to describe it. One Mike Trout appearing is enough to get a lot of attention on the draft. Like I said, everybody loves them some upside. Looking forward to your parts 2 & 3. I do think the calculation on the lottery ticket odds is off though, and there are variations year to year with draft talent that teams can adjust their willingness to part with picks and currently draft pool money under the new CBA.
It looks like the 26th pick has had pretty bad luck, and the 15-year sample I looked at is no exception. However, other picks in that general area have fared better. The 2005 draft alone featured three everyday players (10+ WAR under team control) selected in the 21-30 range (Ellsbury, Garza, and Rasmus), and the 2002 draft had four such players (Guthrie, Francouer, Blanton, Cain).
The odds of finding a major-league caliber player isn’t great (especially outside of the first ten or so picks), but it might not be quite as bad as you think. (I’ll have some numbers on this tomorrow.)
1990-2005 period I’m assuming. And I do think that period should be weighed more heavily for data than the 60s-80s.
20th pick: Mussina, Sabathia, Hunter, Adam Kennedy, Span, Milton (3 old timers)
21st pick: Varitek, Westbrook, Ian Kennedy (barely) (3 old timers)
22nd pick: Werth, Helling, Guthrie, Meche, Thornton (barely), Karsay (barely) (5 old timers)
23rd pick: Kendall, Ellsbury, Sele (2 old timers)
24th pick: White, Billingsly (3 old timers)
25th pick: Cain, *Trout*, Garza (2 old timers)
26th pick: nobody, (3 old timers)
27th pick: nobody, (4 old timers)
28th pick: Colby Rasmus (barely) (3 old timers)
29th pick: Wainright, Jay Payton, Carlos Quentin (barely) (6 old timers including George Brett 88.4 WAR)
30th pick: Noah Lowry (barely) (8 old timers including Mike Schmidt 106.5 WAR)
Brett and Schmidt back to back in 1971 is forever one of the coolest draft trivias.
31st pick: Jarrod Washburn (1 old timer – Greg Maddux 106.9 WAR)
32nd pick: Justin Thompson (barely) (4 old timers, only 2 at 20 WAR)
33rd pick: Brad Wilkerson (barely) (3 fringey old timers)
I got 29 names, might have missed 1-2, in 14 rounds of sort, in a 15 year draft period. Them odds ain’t great, and a lot of them had grinder careers. Looking forward to your data, color me skeptical on the odds.
1991-2005, players drafted in the 21-30 pick range who produced at least 10 WAR under team control:
2005: Jacoby Ellsbury, Matt Garza, Colby Rasmus
2004: None
2003: Chad Billingsly
2002: Jeremy Guthrie, Jeff Francoeur, Joe Blanton, Matt Cain
2001: Noah Lowrie
2000: Adam Wainwright
1999: None
1998: Matt Thornton
1997: Jayson Werth
1996: None
1995: None
1994: Jay Payton
1993: None
1992: Rick Helling, Jason Kendall, Charles Johnson
1991: Aaron Sele
That’s 16/150, or 10.7%. There are some years where there are none, but the years where there are three or four make up for it. And there were another six guys between 8 and 10 WAR.
A lot of these guys earned WAR later in their career, a lot of them with other teams. That is a different story and a different study, but when I say grinder profiles, a lot of time its because the drafting team sold off, but there is possible trade value in that. Just not a lot of front line that this sort kicks out. I’m looking at B/R btw, and Frenchie and Blanton aren’t quite making that 10 WAR cutoff.
For all of these players, I’m just looking at their career before they hit six years of service time. Frenchy and Blanton are two guys who actually cracked 10 WAR in their team control years, but crossed beneath the 10 WAR threshold with negative value later in their careers. I’m using baseball-reference as well.
Also, I don’t factor in whether a player stuck with the team that drafted with them or how many teams they got traded. Just first six (often 6.5) years of team control.
Thanks for taking the time to comment and to take a look at specific players. I come from more of a historical perspective rather than wanting to crunch numbers – looking at the players who made it and trying to figure out what they had to succeed, like much of the draft its a needle in the haystack. Here’s what I think about the name sort we get here and how a GM might interpret:
The following names are big, as in 30 WAR and up: Ellsbury, Cain, Wainwright, Werth, Kendall. That higher standard is somewhat of a factor to my eyes and here’s why: if you are giving up a lottery ticket draft pick under the new CBA, you are getting a useful player who has a good chance to be in that area of WAR score (valued at least at 14MM/year QO). Yes, you are paying full boat for the privilege. And there is always the chance of a bad contract, but you have proven MLB success on your side versus the go fishing in the draft odds, 10% of a 10 WAR “useful” player but a much lower 3.3% chance for a “star” player. (And there are other “star” players who have come along in the 31-40 we aren’t talking about here)
That might not be the purpose of the study, but that’s how I’m looking at it. At least in the arbitrary endpoint we set up in this chat of the 21-30 range. Most teams giving up picks will be there though, because they are already winning so they are stuck in that draft range. The Yanks, Braves, Rangers were in that range, the Orioles were a little higher up at 17. But I don’t know how much is valuing the slot itself versus having the overall pool money the pick provides, another wrinkle in the new CBA. The CBA provides almost all the “small market” and “lowest revenue” teams with a free crack at these odds as well.
Its more work, but I would think most GMs would want to know the difference in odds for a useful piece versus hitting big on a building piece for the franchise.
This is a great discussion!
I would emphasize two line of thoughts brought up here. First off, you need to have a higher standard of some sort for who you are looking for in terms of the draft. Your analysis here is great for finding someone worth 10+ WAR or more during their control years. I would note here that this means that you are including players who average less than 2 WAR per season, which is the defined average point of WAR rating systems, i.e. you included less than average players into your analysis.
I would argue that most people who argue about the draft here and at other watering holes are not really that interested in even average players when you are talking first round picks. I think at minimum you need to set the bar at 2.5 WAR per season or 15.0+ WAR. Personally, I like 18.0 WAR just for the draft in general, because that means roughly 6 seasons at 3.0 WAR. Then, when I compiled the Top 100 draft picks over the history of the draft, I sorted by WAR and looked down the list, I did a smell test on where I thought the dividing line was between useful players and good players and 18.0 worked for that too. But since you are focused only on the first 6 or so seasons of production, 15.0 WAR is probably the equivalent of what I like to use. That should bring down your success rate numbers significantly lower.
Second, while I agree that any team wanting to be competitive has to draft and sign prospects, because the odds of finding said players are so low, they can make the Sophie’s Choice decision to punt the pick in order to sign a player you need today. That is a valid business risk option that they can consider in their decision making. My draft study came up with 10% odds of finding a good player, and at those odds, 9 times out of 10, they will swing and miss (assuming such selections are mostly random; good assumption since there is no team that has picked a winner with their first pick every year, not even every other year).
So yeah, you don’t want to be punting those picks regularly, but doing it once to pick up a player necessary for competing today is valid, just pretend it is like trading your draft pick for a veteran player, which most leagues except for the MLB allows. Also remember, picks that far back in the draft typically take 4-6 years to develop anyway, if the team is trying to be competitive today, just pretend it is a known prospect that the team traded away mid-season in order to win this season. Those are acceptable moves to fans when viewed from that perspective, yet when viewed as “punting” the pick, fans’ hackles get raised.
From your great article, you noted how teams seem to be picking up good players in mid-first round, which raises the supposition that teams are getting better at identifying good players. Maybe it is, but here is a point to counter that and perhaps you can revisit your data to see how it falls out: during this period, there were more Top 10 picks falling to later in the draft but getting signed to overslot deals, generally with the big money teams. Like the Tigers picking up Porcello, or the Braves getting Heyward because he deked teams by telling them he was going to college because his two college professor parents want him to, in hopes that he would fall to the Braves pick (one of their scouts met him in Little League and probably helped him with that plan), or the D-backs picking up Justin Upton when his high price tag (and affiliation with Boras) made him fall in the draft. If you remove all these prospect signed to significantly overslot deals from your data, I wonder if that improvement still holds up, or if the curve is better still.
One additional wrinkle in trying to evaluate what a team is giving up as a result of signing a free agent is to account for the possibility of recouping that lost pick or one similar to it at a later date. For example, with a one year contract such as the one signed by Santana there is a good chance that the Braves will regain a similar pick next year when Santana becomes a free agent again.
This is a great point. It doesn’t affect the actual value of the draft pick that they did give up, but it almost certainly factored into their decision to sign Santana. Given his start to the season, it certainly looks like he’ll be in line for another Qualifying Offer this coming offseason.
Very interesting article! I’m not sure how valid the argument I’m about to make is, but here goes.
For the vast majority (if not all) teams, the goal is to make money. Winning is a means to that end. I’m not terribly familiar with whatever research exists linking on-field success to revenue, but I imagine that it varies quite a bit from team to team. Regardless, I’m confident that every ballclub has specific targets for on-field performance that are based on expected revenue generated by that level of success. I also suspect that the relationship between success and revenue is not considered to be linear. The difference between the one win that gets you over .500/in the playoffs/a divisional championship/a league championship/a world series win is likely to be markedly more valuable than any other particular win.
What this boils down to is the notion that adding WAR up to a certain threshold may have relatively little value to a team whereas adding enough WAR to cross that threshold may be perceived as likely to make a substantial difference in revenue. The reason why this matters is that it makes variability more attractive, particularly for teams that do not have the payroll to realistically emphasize free agency in their core strategy.
So for some teams the only realistic scenario for high level success is to develop significant talent internally, and it’s unsurprising that teams view the draft as the main way to accomplish this. Even though the chances of prospects flaming out is extremely high, the upside of developing franchise players is so much more relevant to teams than the actual average value of a given draft pick.
Free agents, particularly those that are drawing QOs, are much more clear cut. For the top tier talent the QO isn’t much of an obstruction as teams that can afford a game changer will pay for one. The players that are closer to the bubble aren’t likely seen by many teams as difference makers, and thus the amount of value they add to the team’s likely revenue is low. So in that sense unless a team is also right on the verge of crossing a particular threshold of success they are unlikely to see much potential value in such a free agent. The draft pick also won’t likely bring much value, but there are scenarios where it will bring huge value. There are few scenarios where the free agent will do so, at least if you subscribe to the outlook that I described above.
Thanks for the comments, I think your points are all valid. For the most part, wins matter because they increase revenue, and not all wins are equal. A win that is going to push a team into the playoffs is obviously more important than a win that pushes a losing team one game closer to .500.
This is what makes it difficult to place a good value on draft picks or decide whether a team made the “right decision” to give one up. We don’t have a lot of information about how wins and playoff appearances affect different teams’ revenue streams (at least I don’t).
Teams that have a large financial incentive to win now and have the money to make that happen probably won’t place as much of a value on their draft picks, as I’ll get to on Friday.
With Free Agents, you can look at what other teams spent on wins and judge whether or not a signing was smart. We can’t do this directly with draft picks, but what I’m trying to do here is get as close as possible to quantify how much each draft pick would be worth if there were an open market for it.
I have been working on something along these lines….as I am completing a larger project. Macrosabermetrics Section, Part 1
Part 2 is the Fan Model which I have to put more work into… Part 1, Financial Model – a bit more needed but closer??? While I don’t go into projections per say, I think I segregated the two different emphasis here.
Input, critiques, and actual insights are welcome.
I did a similar look at BA Prospect Rankings – Prospect WAR by BA Ranking piggybacking Sky’s model. It has some interesting parallels to Wang’s model of where the cutoffs are for value, when you look at the linear, power, or log portions of the curve. Not saying this is better, just different.
It’s really interesting to see the the different models next to each other. I stuck with the power model to be consistent with Sky’s work, which is based off of a much bigger sample (both in terms of years and picks). However, it looks like the log model might be a better fit for the upper end of the draft (and perhaps the prospect rankings as well).
Another thing to consider is that regardless of the dollar amount you come up with, the pick is always worth more to the team. If you’re the GM with the #10 pick in the draft, you might see that it’s worth, on average, $10MM in surplus value (I made that number up, for argument’s sake). You’ll see a list of #10 draft picks that became stars, and a bigger list of #10 draft picks that never panned out. As the GM, you’ve most likely hired an assistant GM that you trust, scouts that you trust, etc, so you’re not going into it thinking “there’s a 10% chance of surplus value, and a 90% chance of bust, based on prior history”. You’re going into it thinking “I’ve assembled a smart staff of scouts, analysts, etc. I know that 90% of prior picks are a bust, but OUR pick is much more likely to succeed!”. There’s a level of arrogance/confidence there, not unlike fans who think their top prospects will all be playing together at the big league level in 3 years, despite the reality that most of them will bust.
Short version: While GMs are aware of the attrition rate, they’ll have enough confidence in their staff to believe that it’s less likely to happen to a player that they draft and develop because they’re smarter than the people who drafted all of the busts in years past. That’s not to say they’re foolish enough to think their pick is a guarantee to be great – but they undoubtedly think there’s a higher likelihood of it.
A different version of this was written on these pages almost 9 years ago: http://www.hardballtimes.com/eenie-meenie-miney-mo/
But the writer turned it on its head, the quote from the article: “Contrary to what some might say, I don’t think there’s anything wrong with saying that you’re just really bad at picking from the most sought-after prospects. ”
Of course, it didn’t turn out to be the case. Sabean killed the draft for 4 straight years with his high probability picks. They paid off in spades.
A lot of this pick value and draft study has been gone over a lot with Giants fans, because the 2003-5 punt draft picks by signing arbitration FAs before the deadline to “lose” them was met with disdain. What has been revealed since is that it was ownership dictated, and it was also most likely done after a study of the probability of success with picks in the late 20s.
I think that teams can have a good thumb in air judgement as to the talent that should be available to the team when they make their first round pick. It is not just us nerdy baseball guys who do mocks, I’m sure the pros do something similar as well. And so they should have a good feel for who might be available, just like us, and then take that into account when deciding whether to punt/lose/track the pick or keep it.
I believe that some teams are capable of making a good enough call on the quality of any particular top prospect, then decide on how to proceed regarding losing draft picks. For example, right after drafting Bumgarner, Sabean went onto MLB.com for an interview and plainly put the challenge out there, he didn’t go the PC route of just extolling the prospect: he stated that the team expected Bumgarner to make the majors in two years, no buts. And he did, and he was in the majors for good the following season, and he has been great since, rising to become the ace of the Giants rotation. And teams get the first five picks of the draft right a lot more often than with later picks.
So teams have a good feel for the relative quality of prospects, and that makes sense from Matt Swartz’s studies of teams’ behavior with their own prospects and free agents, they knew more times than not which were the prospects and free agents to keep, and which to trade/let go, they can readily identify who are good and who are not. That shows that most teams have the skills to identify who is good and who is not, on an overall basis.
Fans forget that teams often do things in spite of what the scouting and development staff knows. For example, teams often sign free agents not because they are good, but because they need a particular player and he was the best available. And sometimes the move is precipitated by ownership, as in the reported owner meddling to sign Barry Zito, that was not driven by Sabean but he gets the blame for it. And, of course, all of King George’s meddling too.
So I think teams have a good feel for what is good is what isn’t, but can’t always divine whether the player have the mental cajones to make it to the majors. From reading players interviews over the years, often it seems that it isn’t their talent, but their minds that were not up to the job of making the majors. I’ve read many a comment about players who has the talent, but their minds get in the way once they get to a high enough level to screw with them, and then how some of them got over that by, basically, letting go of what happens and “letting their natural talents take over”.
I have great interest in draft studies, so first I have to say thanks for the great research and article. Very interesting.
Unfortunately, you continued the flawed analysis that BP introduced into the methodology of draft analysis by using average WAR values for players. As I did in my study that predated the BP study, I set a standard for what a good player produces then did a count of prospects falling into that bucket (as well as other buckets, but that’s another story). I discussed this above in my longer comment, but basically it comes to two basic problems with using averages in this case.
First off, look at that average number: it is very low, no? In fact, per the WAR definition, we are talking about drafting a below average ballplayer, on average, with any particular pick. As I pointed out in the BP study in a comment before, the average first pick overall does not come out that great. In that study, the average first pick overall was Marquis Grissom, a useful player but not a player one is hoping to get when you have the first pick overall. In the Sky chart, that first pick is just under 20 WAR. Here are some names of players just under 20 WAR:
* Shane Mack
* Shannon Stewart
* Mike Witt
* Zane Smith
* Aaron Rowand (had to throw that one in!)
Nice players but not really guys fans dream of getting with their first round draft pick.
Second, average is nice because it is easy to calculate and because many things in life have a normal distribution, but that is not true for draft picks. As anyone who has looked at the actual WAR production for any particular draft pick knows, that distribution is horribly skewed towards players who are career minor leaguers or marginal major leaguers, there are much fewer useful players, and even much less good players. This skewed distribution is why average is not a proper analysis tool to use in the case of draft picks. I still believe that categorical analysis is the best way to analyze draft picks.
I hope that you continue to do draft analysis, I think you did good work otherwise, but be cognizant of these limitations and flaws if you continue to use averages.
Thanks for the response, I’ll try to address some of your your questions as best I can:
The average is very low, look at my part two piece where I look at calculating net value of individual draft picks rather than calculating net value of average picks.
The 20 WAR from the first graph in the post is actually based on career WAR, the team-control WAR is actually closer to 10. And yes, that isn’t very good. I adressed this in part in the comments section of the second post – from 1991-2005, the first pick produced a 10+ WAR player 60% of the time (9/15), and those players averaged 22 WAR under team control. That’s a value in excess of $100 Million.
Even the players that only hit around 10 WAR under team control – guys like David Murphy and Jed Lowrie – still highly valuable when you’re paying around $1.5M per win.
Looking at categories of players would be very helpful to try to get a better sense of where draft pick value comes from. I’m not trying to convince anyone that every draft pick X will be worth Y dollars, but rather, given the probability of drafting a player who will produce a certain value, what’s the best estimate of a dollar value we can put on each draft pick? If teams were allowed to sell their draft picks to other teams, what prices would we expect them to go for?
Matthew actually answered me some questions that I missed because for some reason, my email put it in the spam folder, so I figured I’d direct the answers here (since he’s already written the article).
I generally use a 4% discount rate. I don’t think a high discount rate is appropriate, simply because I don’t think the opportunity cost of waiting for a minor leaguer is that high. Yeah, there’s nothing for the first year, but minor leaguers in themselves are assets in themselves that can be cashed in as well, if there’s an imbalance between future and current value.
The other ways I get my valuation are a little controversial –
– I utilize minor league translations. That doesn’t move the needle too much in and of itself, but if a team has a player of value in the minors, that value still exists, even if they don’t use it. It’s a small thing in and of itself, but you add a few runs here and there for players and it really adds up. Whether or not a team chooses to use all their assets doesn’t mean that it’s not there. Cecil Fielder had significant value to his drafting team, they just chose not to use it. At the price of a win, it doesn’t take a whole lot of extra runs for a lot of extra dough.
– I use the surplus value of the actual contracts signed over the period. Longoria’s draft worth isn’t just the surplus value, but also the ability to sign him to a long-term contract past that period. No other team had that opportunity. And it’s the product of a positive choice of the team, they can pick and choose to explore a signing or not.
– I also use the difference between projected contract value for players subject to draft pick compensation over the last 20 years. It’s rough, but it’s indirect information that in the aggregate is helpful. Players that received arbitration offers have gotten less, relative to their expected contract projections in ZiPS, than players that have not. You may not be able to take the eggs out of the challah, but a taste can give you an idea how many are in there.
– I am using slot values going forward rather than actual signings. The system’s changed and there’s more surplus value than there was before.
FIFA World Cup 2014 Opening Ceremony Live Stream, Any time FIFA in October 2011 given Brazil’s productive business center Sao Paulo as the Planet Cup’s cracking open match up location, these people did not that is amazing 11 times prior to kickoff this ground may……………………