In search of efficient pitchers
For the last few weeks, we’ve been looking at how many pitches a typical plate appearance lasts, broken down by result (walk, strikeout, hit, or out). The last article in this series looked at two different types of pitchers to understand how strike-throwing correlated with pitching efficiency. We left off by deciding to look at different classes of hitters. I still intend to do that, but I want to first wrap up some loose ends with pitchers.
Most of the feedback (on Ballhype and The Book Blog) pointed out that there were better ways to chop up the data. We were trying to isolate the effect of throwing strikes on the length of plate appearances and used strikeout-to-walk ratio and walks issued as proxies to that ability. But why use proxies when the pitch-by-pitch information is available from Baseball-Reference? The immortal Sean Forman was generous enough to provide me a spreadsheet with pitch data for all major league pitchers in 2006.
With that in hand—or in computer—we can characterize strike-throwing ability in a few new ways. For each measure we’ll split pitchers into the top 30 (or about the top 6%) and the bottom 30 (about the bottom 6%). For the rest of this article, we’ll restrict our data set to hurlers who threw more than 200 pitches in 2006, around 530 pitchers.
Three ways to look at strikes
The three measures we’ll look at are:
1) Percentage of pitches thrown for strikes (swinging, called, foul, or in play). This is a gross but direct measure of having thrown lots of strikes (suggested by reader Guy).
Group        Value     Guys like...
Top 30      >67.4%     Pat Neshek, Jon Papelbon, Justin Duchscherer, Mike Mussina, Brad Radke
Average      62.2%     Matt Cain, Rickey Nolasco, Juan Cruz, Zach Duke, Joe Blanton
Bottom 30   <57.4%     Russ Ortiz, Daniel Cabrera, Tanyon Sturtze, Dan Miceli, Carlos Marmol
2) Balls in play per batter faced (suggested by Tom Tango). This is a measure of "hittable" strikes and may be useful if we are trying to spot a class of pitchers who induce hitters into making contact—so we'll say that this is how "hittable" a guy's pitches are.
Group        Value     Guys like...
Top 30      >82.7%     Carlos Silva, Chien-Ming Wang, Paul Byrd, Todd Jones, Mike Timlin
Average      72.9%     Dontrelle Willis, Andy Pettite, Casey Fossum, Victor Zambrano, Jason Vargas
Bottom 30   <60.0%     J.J. Putz, Rich Harden, Joe Nathan, Joel Zumaya, Joey Eischen
3) Percentage of pitches thrown for strikes but not put into play. This is sort of the opposite measure of balls in play per batter faced, in that it tells us about pitchers whose strikes are not tempting to (or not amenable to being) put into play. We'll call this metric "non-hittable."
Group        Value     Guys like...
Top 30      >48.2%     Jon Papelbon, Johan Santana, Curt Schilling, Takashi Saito, Trevor Hoffman
Average      42.8%     Bob Wickman, Roy Halladay, Cory Lidle, Randy Wolf, David Wells
Bottom 30   <37.9%     Joe Mays, Horacio Ramirez, Lance Carter, Zach Day, Jeff Fassero
Let's see how they fared in terms of pitches per plate appearance. Remember, we're going to break it down by result, because the average length of a plate appearance is a strong function of a pitcher's walk, strikeout and in-play rates. What we're searching for here is whether different classes of pitchers can be more efficient than others regardless of these rates.
                 --Strike/Pitch--   ----hittable----   --non-hittable--
Result  Average  Top 30 Bottom 30   Top 30 Bottom 30   Top 30 Bottom 30
BB       5.67     5.95    5.46       5.83    5.59       5.91    5.49
K        4.81     4.73    4.82       4.75    4.78       4.73    4.70
Hit      3.34     3.33    3.39       3.22    3.49       3.41    3.21
Out      3.32     3.28    3.42       3.22    3.45       3.41    3.25
All      3.75     3.68    3.93       3.50    4.08       3.90    3.56
I won't spend time on the first category, Strike/Pitch. The most interesting results lie in the last two categories: BIP/PA, which we loosely interpret as "hittable pitchers" and (Strike-BIP)/Pitch, which we loosely interpret as "non-hittable pitchers." The former group is composed of pitchers who allow hitters to put the ball in play, and the latter group of pitchers who throw lots of strikes without the hitter putting the ball in play. It stands to reason that the top pitchers in "hittability" would have to throw fewer pitches than the pitchers at bottom, and vice-versa for "non-hittability". And indeed, this is exactly what we see!
How efficient is efficient?
While there is only a very small difference in the number of pitches per strikeout across all the categories—a difference of no more than a tenth of pitch—there are larger differences for walks and balls in play (both hits and outs). Unsurprisingly, walks eat up a greater number of pitches for the pitchers who throw a lot of strikes. That makes sense: pitchers who throw a lot of strikes are likely to throw at least a few strikes even while giving up a walk. This results in a difference of about half a pitch per walk between the top and the bottom in each category. Similarly for hits and outs, pitchers who throw lots of hittable pitches induce balls in play more quickly than those who throw non-hittable pitches. We can visualize these results by looking at the distribution of pitches per plate appearance:

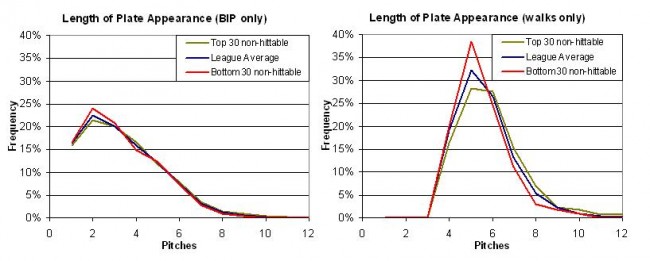
(click on the images for a larger view)
The curves for top hittable and bottom non-hittable are shifted up and to the left of league average; that is, they give up walks and induce balls in play using fewer pitches. On the other hand, the curves for bottom hittable and top non-hittable are shifted down and to the right. This is a visual confirmation of the results in the above table.
Thus, we conclude that the "hittable" pitchers are more efficient than the "non-hittable" pitchers by two different measures. What is the magnitude of this effect? One way to understand the magnitude of these differences is to pick a common pitching line and see how many pitches it would take for each of these classes of pitchers. Imagine a pitching line of 6 IP, 6 H, 2BB, 4 K. The next table shows how many pitches that would take for each of these types of pitchers:
                  --Strike/Pitch--   ----hittable----   --non-hittable--
         Average  Top 30 Bottom 30  Top 30 Bottom 30   Top 30 Bottom 30
Pitches   97.0     96.7    98.4      95.1    99.5       99.0    94.5
The magnitude of this difference is around 4.5 pitches for the standard pitching line quoted above. Over 30 starts, that difference is just over 130 pitches—around 10 additional innings over the course of a year.
Be like Mike (Timlin)?
Does that mean that these pitchers are to be held up as paragons of efficiency? Perhaps. But I wouldn't advise other pitchers to emulate these guys. The more efficient pitchers (top 30 in "hittability") had a collective 4.76 ERA and the less efficient pitchers (bottom 30 in "hittability") had a collective 3.68 ERA. Using (Strike-BIP)/Pitch as the measure, the difference is even more pronounced: the efficient pitchers (bottom 30 in "non-hittability") had a collective 6.52 ERA and the less efficient pitchers (top 30 in "non-hittability") had a collective 2.89 ERA! Whether this phenomenon is correlative or causative is unknown—I would guess correlative—but if there is a tradeoff between efficiency and effective, it is best to err on the side of effectiveness!
Perhaps, then, the best interpretation is that efficiency is a mirage. More likely, these are simply bad pitchers, and hitters don't waste time jumping on their bad pitches. Pitchers who routinely work deep into games with reasonable pitch counts don't do so because they induce hitters into making quick outs. They do so because they are good at retiring hitters, allowing them to accumulate a large number of innings without throwing a ton of pitches. There is no such creature as the efficient pitcher—only the effective one.

What about hitters? Do some hitters do their damage early or late in the plate appearance? Are differences between the hitters greater than for pitchers? Next week we'll take a crack at answering those questions.
References & Resources
Many thanks to Sean Forman not only for being the proprietor of Baseball Reference, but also for being kind enough to provide me with a data dump of the 2006 MLB pitch data. Per usual, much of the data used for this study comes from Retrosheet.