kwERA: The Starting Point for Pitcher Evaluations

Max Scherzer’s 2.26 kwERA ranked third during 2015, among qualified pitchers. (via Keith Allison)
Measuring a pitcher’s production and talent level is a problem analysts have been trying to solve for awhile. The main issue is how much credit for runs scored should be given to a pitcher, and how much should be given to other elements like defense or random variation/luck.
To help determine these values, ERA estimators have been created over the years to help give a better picture of the pitcher; they include FIP, xFIP and SIERA. All these start with strikeout and walk rates and then begin to add batted ball data. The basic strikeout and walk-based estimate has not been easily accessible until today at FanGraphs. Its acronym is kwERA, and for now it is available only as a stat on the custom pitcher leaderboards. But that is still pretty cool, and now that we have access to it, I want to look into why kwERA should be the starting point for any pitching evaluation.
While strikeouts and walks aren’t the only factors in estimating a pitcher’s talent level/ERA, they are the core attributes a pitcher has control over. A pitcher also has control over the direction a ball is hit (ground or air) and how hard the contact is (home run or routine pop-out). Other ERA estimators use these factors to for their calculations. Here is a look at the limitations for the estimators at FanGraphs.
One important thing to note is that when using the ERA estimators, it is important to note why they are being used. Some like FIP and kwERA show exactly what a pitcher did. They give the exact number of strikeouts, walks and home runs allowed by the pitcher. These are the reasons they are used in WAR formulas. SIERA and xFIP use batted ball data (and several other variables with SIERA) to estimate what would normally happen, not what did. I am looking only at the values as estimators for now.
FIP: FIP, which uses strikeouts, walks, and home runs, is the original ERA estimator. The problem with FIP is it takes a while for a pitcher’s home run rate to stabilize — normally, about 1,300 batters faced. Most starters face at most 900 hitters in a season. A person looking at single season FIP would be better off using the league average home run rate to predict the pitcher’s ERA the following season.
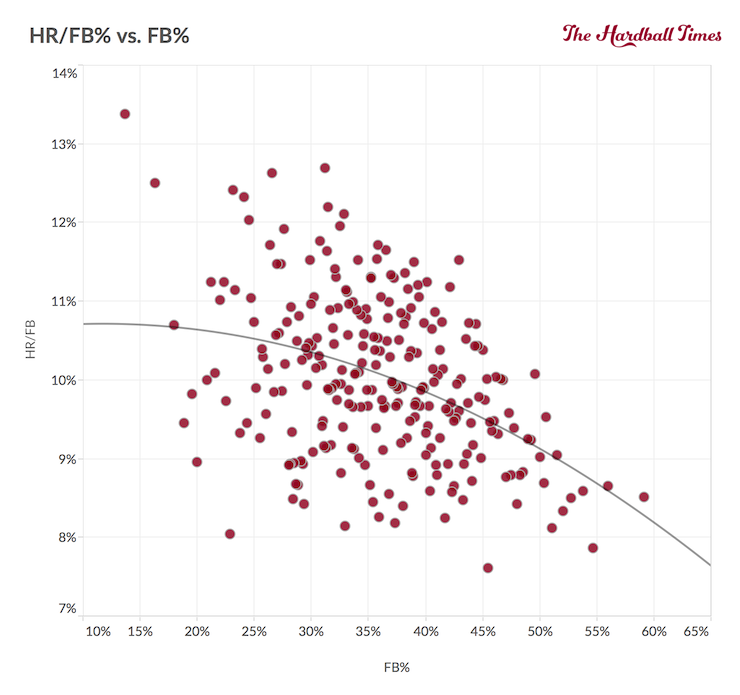
xFIP: xFIP was designed to help get to a stabilization point faster by using a pitcher’s flyball rate, which stabilizes in 70 batted balls — or about one-sixth of a season (600 batter balls is a normal season for a starter). The league average home run per flyball rate is assumed and this value is multiplied by a pitcher’s flyball rate. The problem is that pitchers with higher flyball rates have lower HR/FB rates and their HR/9 rates don’t increase linearly. Here are two graphs that show the HR/FB and HR/9 rates for pitchers with different flyball rates (minimum 40 innings pitched in a season). I grouped the pitchers in groups of 20 to help with the visualization.

To further prove the point, here a comparison of the season’s flyball percentage to ERA-xFIP and the next season’s ERA-xFIP (minimum 40 innings pitched in each season, with values again grouped by 20 for ease of viewing).
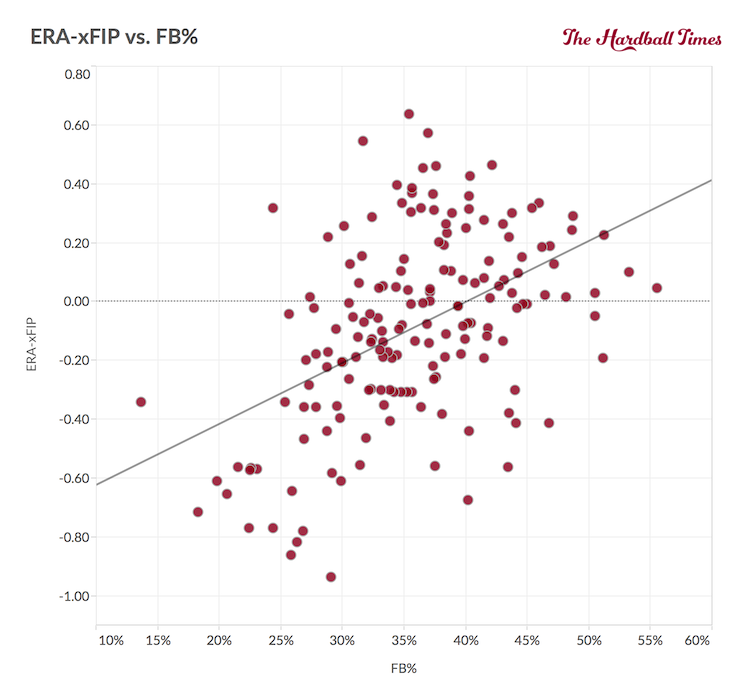
As can be seen from this graphs, it isn’t just the high flyball pitchers who are getting undervalued, it is the low flyball pitchers also. xFIP is not taking into account some of the advantages on the extreme ends of the batted ball spectrum. I will get back to xFIP later.
(Note: I will not use flyball rates again in this article. I find it is easier to learn what is considered to be a good and bad groundball rate and use those values. RIP flyball percentage.)
Average of xFIP and FIP: Each of the values has its limitations. Averaging the pair is kind of like comparing apples and oranges, as OPS does with on-base percentage and slugging average. The average works out to a fairly decent value, and better than some other estimators examined.
SIERA: SIERA should be considered just a projection/true talent measure. My main issue with SIERA by itself is knowing why it has a certain value such as 3.27. The reason is because these are all inputs to SIERA:
| Variable | bpSIERA coefficient | fgSIERA coefficient |
| (SO/PA) | -16.986 | -15.518 |
| (SO/PA)^2 | 7.653 | 9.146 |
| (BB/PA) | 11.434 | 8.648 |
| (BB/PA)^2 | – | 27.252 |
| (netGB/PA) | -1.858 | -2.298 |
| +/-(netGB/PA)^2 | -6.664 | -4.920 |
| (SO/PA)*(BB/PA) | – | -4.036 |
| (SO/PA)*(netGB/PA) | 10.130 | 5.155 |
| (BB/PA)*(netGB/PA) | -5.195 | 4.546 |
| Constant | 6.145 | 5.534 |
| Year coefficients (versus 2010) | – | From -0.020 to +0.289 |
| % innings as SP | – | 0.367 |
(where netGB=(GB-FB), and where +/-(netGB/PA)^2 is + when GB>FB and – when GB<FB.)
While SIERA addresses some of the issues I noted with xFIP above, we don’t have any context of the pitcher’s talent. It is just about impossible to find the exact contributions from strikeouts and walks with only xFIP and FIP available.
So for all three of the ERA estimators, the missing aspect is a reference point for the batted ball data (and the additional calculations in SIERA). kwERA provides that reference point. With kwERA as a starting point, I decided to create my own metrics, one of which may actually be useable. I looked at using wISO — which is ISO calculated with doubles, triples and homers weighted according to wOBA components — and GB% to adjust kwERA to get a better ERA estimators. I created an estimator with just each of the variables add and then one with both. (Note: Some of these values may need to be adjusted a small bit. I ran the analysis without the final kwERA numbers on FanGraphs.)

What I found was already known and stated in this article in that wISO, which is based on batted ball data, is not as predictive. I was hoping to tease a little more predictive value by looking at pitchers’ ability to limit hard contact. Some years those hard hit balls with become doubles and in others they will be home runs. In the end, it wasn’t a huge improvement.
wISO-adjusted ERA was a better predictor of next-season ERA and was closer to in-season ERA. If someone wanted to base a metric on what has actually happened (ERA, FIP or kwERA) using wISO, I would not have a problem with it, but it is not much of an improvement over FIP. Additionally, FIP doesn’t involve fielders, so it is a better measure of the pitcher for the factors involved.
The big improvement came when I compared the difference between ERA-kwERA and groundball percentage. Here is a graph of the two from 2002-2015, with each dot being 20 values averaged together for ease of view:
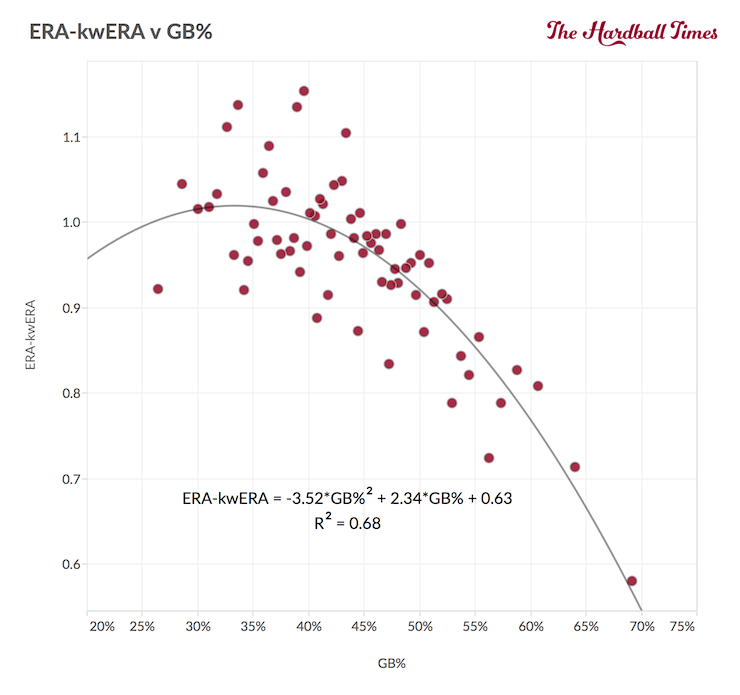
The key point from the graph is the peak at 34 percent, which is the least desirable rate for the pitcher. With ground ball rates less than 34 percent, the pitcher begins to see an advantage of a low groundball rate. Baking a groundball adjustment into kwERA creates one of the best ERA estimators (as seen later). Here is a basic formula, which I’m sure can be adjusted over time:
GBkwERA = kwERA*(-3.518 * GB^2+2.344*GB+.629)
We’ll see if GBkwERA gets housed at either my site, Baseball Heat Maps, or FanGraphs. Until then, xFIP can be a proxy for it — at least, until a pitcher gets down to 42 percent ground balls and the normal bad effects of a lowering groundball rate diminish until they turn positive. A person could use xFIP for 42 percent GB% and above, and kwERA for values under 42 percent.
Finally, I got the idea to combine both the ISO and GB% multipliers, but this led to horrible results. It performed worse than any of the other metrics as an ERA estimator outside of plain ole’ ERA.
Final comparison
The number of ERA estimators can be a little overwhelming, so I created one graph to compare the r-squared values from season 1 to the next season’s ERA for all of the ERA estimators I’ve examind in this piece, which again, is but a fraction of the ERA estimators out there these days.
| Metric | R-Squared |
| SIERA | 0.158 |
| GBkwERA | 0.154 |
| AVG of FIP & xFIP | 0.138 |
| kwERA | 0.136 |
| ISOkwERA | 0.133 |
| xFIP | 0.131 |
| FIP | 0.124 |
| GB&ISOkwERA | 0.124 |
| ERA | 0.089 |
As expected, SIERA reigns supreme, but GBkwERA comes in a close second. A surprising third place is the average of FIP and xFIP, which narrowly beats out the baseline value of kwERA. FIP and xFIP both have lower correlations on their own, but when combined, their weaknesses average out.
I am elated to have kwERA finally available at FanGraphs, as it gives a nice baseline for a pitcher’s talent level. With kwERA known, the effect of walks and strikeouts on a pitcher’s ERA is known and how much of the value is their batted ball data. I have taken the first stab at creating a simple yet effective estimator using kwERA and GB%, which I have titled GBkwERA. It doesn’t have the final 2015 values yet, and they weren’t corrected for park or league — so more work needs to be done there — but what I have come up with is a promising start. Using a simple best-fit line creates an ERA estimator with almost the same predictive accuracy as the more complex SIERA. In the meantime, enjoy the kwERA values and the additional perspective they bring to pitchers.
References & Resources
- Special thanks to Sean Dolinar for graphical assistance.
- Special thanks to Peter Melgren for statistical assistance.
- Mike Fast, The Hardball Times, “Leaders in kwERA”
- Dave Studeman, The Hardball Times, “I’m Batty for Baseball Stats”
Great job, Jeff. There must be a simpler formula for factoring GB rate into kwERA. I don’t see it replacing xFIP until the math is easier to understand.
As I stated in the article, I think xFIP is good as a predictor until a pitcher gets a GB% under 42%. Then, kwERA should probably be used. Also, a person needs to understand that extreme FB pitchers (~35% GB%), like Chris Young, really break xFIP and its assumptions.
Jeff – When you give statistics for FB what definition are you using: MLBAM (Retrosheet) FB, BIS total FB , BIS FB -IFFB, BIS FB + LD (All balls not hit on the ground)? Also, are the graphs that you show based on a single year, or are they yearly statistics for multiple years and what year or years are they from? Third, the title says “Why kwERA Should Be the Starting Point For Pitcher Evaluation”, but the body of your post shows only ERA in year 2 being predicted. Why is predicting ERA considered to be a worthy goal given the known problems of ERA as a measure of pitching performance?
FB is BIS, but as I stated, I don’t like FB as a measure. Too inconsistent. I wish everyone would move to GB.
Graphs and data are 2002 to 2014 (or 2015). I am not sure if I started the work before the season was over.
Whether we like it or not (I don’t), the key for a pitcher and defense is to prevent the offense from scoring. Looking for ways to prevent runs, like allowing a ton of weak flyballs, is a goal IMO.
By ‘simple best fit line’ do you mean a local regression or spline?
What is the significance of the R-squared values in the final table?
I’m not sure how the polynomial model for GBkwERA, an interpolation, creates a ‘predictor’ of anything. Your measure of linear fits in the last table (ignoring major violations of normality and autocorrelation), show how poorly interpolation performs in prediction.
Some credibility is lost in the article when he plops down a polynomial on a plot that clearly shouldn’t have one.
I was thinking the same thing when I was reading the article…
Jeff:
bbFIP might be of interest to you.
To the uninitiated saber newbie, can someone explain the ERA-xFIP to FB% graph above. Jeff mentions that “it isn’t just the high flyball pitchers who are getting undervalued, it is the low flyball pitchers also.” Wouldn’t the low flyball pitchers in this sense by overvalued as their ERA-xFIP value is negative? Help!
“FIP, which uses strikeouts, walks, and home runs, is the original ERA estimator”
Jeff, FIP isn’t the original ERA estimator. Or even close. If one were to research the history of ERA estimators, they would undoubtedly find many before the creation of FIP, probably going back decades. In particular, DICE (Defense Independent Component Era), developed by Clay Dreslough sometime in the 90’s, nearly identical to FIP and described on this webpage: http://www.sportsmogul.com/content/dice.htm. You will also see one of Bill James creations, CERA (Component ERA) described on the same page.
Good concept, interested to see the gb adjustment refined and if it changes by year/ run environment.
Now the most important question: Who of the “big 3” 2015 NL stars fared the best?
Jeff, are you looking at *all* pitchers or just a subset of them with enough IP / TBF? Also, are you doing weighted correlations? Thanks much.
In Jonathan Judge’s post that introduces cFIP, he included kwERA in his correlational studies. kwERA proved to be one of the best predictors of future performance (according to run expectancy values) for pitchers with at least 170 batters faced. However, when the condition of batters faced was removed to include all pitchers, it graded out even worse than ERA in terms of predictive power.
This is a great article. You may be able to improve the predictive power of GBkwERA by using GLS to estimate the parameters for the GB adjustment, since the residuals of that regression seem to be more volatile at lower levels of GB%. GLS would effectively weight the regression to give more influence to the observations with higher GB% where the fit is tighter. (This would also make it easier to drop the polynomial term which looks superfluous, as other commenters have suggested).
Just a small nitpick, comparing R2 from year 1 to 2 in the last table, is potentially misleading because R2 doesn’t distinguish between positive and negative correlation. A measure of correlation would be more appropriate for these kinds of analyses next time.
Thanks for the post.
I’m having a really hard time with the last scatterplot.
1) This is a linear trend, why are you squaring it? Any non-linearity is inperceptable, even if it fits better, suggesting there’s a “peak” in this data is a real stretch, seems like you’re just overfitting one outlier with a .91 ERA-kwERA and a 26% ground ball rate. Throw out the outlier and there’s nothing to suggest nonlinearity in here, although maybe something to suggest heteroskedasticity, which is what I suspect you’re actually seeing. The model just “fits” better at high ground ball rates than low ground ball rates, its not non-linear.
2) Why is ERA-kwERA always positive? Shouldn’t this value center somewhere close to 0?
imperceptable not inperceptable.