Luck In Baseball
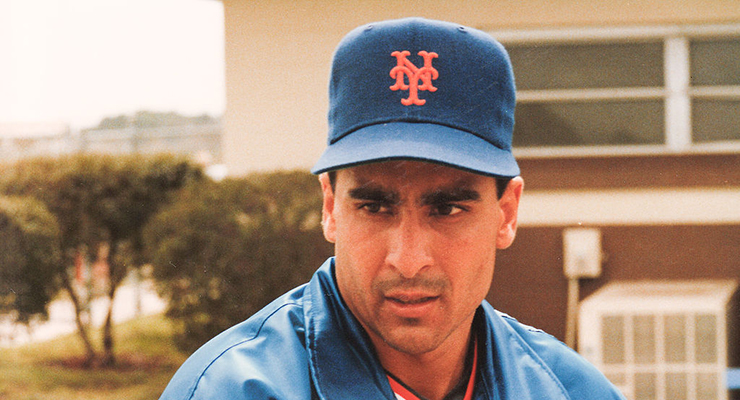
Despite expansion and a star-studded roster, 1993 was not a good year for the Mets. (via Jeff Marquis)
There are different ways of looking at luck in baseball. In the most common sense of the word, luck is undefinable. It’s whether that slicing line drive hooks to one side of the foul pole or the other; whether the batter hits that hanging slider over the center field fence or just misses it and pops it up for an easy out; whether the humidity and breeze that day make the knuckleball dive and shoot like a wiffle ball or drift lazily over the plate like a beach ball. Luck, in this sense, is unpredictable and ineffable. It’s the way the cookie crumbles.
Luck, in the statistical sense, is both more and less. There are times when a team wins a lot of one-run games and loses a lot of blowouts. A team like that seems to be getting by on luck, getting just enough offense to win in some tight spots, then completely flopping in others. The sort of disparity between run-differential and win-loss record led statisticians to create the concept of the Pythagorean win-loss record.
A team’s Pythagorean record (explained more fully here) measures the runs a team scores and the runs it surrenders and gives a rough tally of how many wins and losses the team should have expected to earn based on those figures. The difference between that total and the actual record is Pythagorean luck. The numbers fluctuate from year to year, but some team often will approach +10 or -10 in luck; that is to say, some team will win or lose 10 games the numbers say they shouldn’t have. This season, the Texas Rangers are currently baseball’s luckiest team, with a +nine margin, and the Los Angeles Angels are the unluckiest with -six. [Through Aug. 8]
Unlucky Losers
That’s hard luck for the Angels. But in the annals of baseball history, -six is not that bad. Baseball’s unluckiest team was more than twice as cursed by the baseball gods. As unlucky as the 2016 Mets have been with their recent epidemic of injuries, the 1993 Mets were even more star-crossed, by Pythagorean standards, racking up the all-time record in bad luck, -14.
At first glance, the Mets had good reason to be optimistic in 1993. After a mediocre 72-90 season in 1992, they started the 1993 season with a respectable lineup and one of the highest payrolls in baseball. Future Hall of Famer Eddie Murray was 37 years old but still capable of producing hits. Third baseman Howard Johnson was expecting to rebound from an injury-plagued season and hoping to return to the form that led the league in home runs in 1991. Vince Coleman and Bobby Bonilla made up two-thirds of an offensively potent outfield, and the pitching rotation included Doc Gooden, Bret Saberhagen, and Sid Fernandez. With the expansion Florida Marlins joining the National League East that year, Mets fans had good reason to believe they would avoid the cellar.
It was not to be. After sweeping a two-game series against Colorado, the other expansion team that year, the Mets were swept in turn by the Astros, losing the final game by one run. One-run losses are a theme with teams with bad Pythagorean luck, and the Mets were no exception. They would win 19 such games that year while losing 35. It wasn’t the worst record in one-run games—that would be the Boston Braves’ 7-31 record in their historically bad 1935 season—but it’s pretty bad, and the mark was the worst in the majors in 1993.
The Mets closed out April with a seven-game losing streak, with three of the seven being one-run losses. Even beyond Pythagorean stats, part of what makes a team feel unlucky is this sort of narrow loss, where the fan is left with the impression that if not for one of a hundred little things, the game might have been won. That feeling is never more pronounced than in the case of a walk-off loss. The Mets suffered their first of the year during that seven-game losing streak, when a Matt Williams single in the ninth inning lifted the Giants to victory. They would suffer ten walk-off losses that year in total against five walk-off wins.
That’s not the most walk-off losses ever–not even the most in Mets history–but remember, we’re not talking about the worst season ever, just the most unlucky. The 1962 Mets were expected to be terrible, and they were, finishing 40-120. The 1993 Mets, in contrast, performed, in the aggregate, like a halfway decent team; not playoff-bound, to be sure, but at least mediocre. Scoring 672 runs while giving up 744, they might be expected to hover a bit below .500, and their Pythagorean win-loss record reflects this, standing at 73-89. Their real win-loss record of 59-103 stands as a testament to how, in some seasons, all those little bounces and rolls go against you.
Unlucky Winners
There are other ways of being unlucky that do not involve losing, and the 1993 season holds an example of this, as well, in the case of the San Francisco Giants. The 1993 season was the last in which each league had only two divisions. While the Mets were languishing in an NL East led by the worst-to-first Philadelphia Phillies, the red-hot Giants were fighting for dominance of an NL West division that also included the Atlanta Braves.
The Giants started hot and stayed hot on the strength of a lineup that included Barry Bonds, Williams, Will Clark and Robby Thompson. They spent the first month of the season in or near first place, staying in the lead consistently for months after mid-May. By July 22, the Giants had built up a 10-game lead. As summer turned to fall, though, that lead slowly melted away as Atlanta climbed in the standings. The Braves, at the beginning of their decade-and-a-half tenure at the top of baseball, inexorably gained on the Giants, cutting their lead to five games over the next month and pulling into a tie for first on Sept. 10.
The last few weeks of the season saw the Giants fall to four games back before rekindling their winning ways and getting back to a tie for first in the last week of the season. With one game left to play, the Giants and Braves stood at the top of the division with identical records of 103-58. Had either team played in the NL East, it would have been in first by six games, but in the NL West they went down to a photo finish.
It’s hard to think of a team with 103 wins as unlucky—unless another team in its division has 104. That was the case for the 1993 Giants when Tom Glavine pitched the Braves to a win on the season’s last day, while seven Giants pitchers gave up twelve runs to the Dodgers, closing the year in a crushing loss. At 103-59, the Giants earned the dubious distinction of being the winningest team since the start of divisional play not to make the postseason.
End of an Era
With 103 wins, a truly optimistic wait-til-next-year attitude among Giants fans was not unreasonable. The 1994 season would see most of the 1993 Giants still on the team, and the still-dominant Braves moved to the NL East under the new three-division alignment. The new division structure also included a Wild Card playoff slot, which the Giants would have claimed easily had it existed the year before. Surely, San Francisco’s luck would change in 1994.
Of course, it was not to be. The Giants started hot but failed to sustain their success, falling into second place in mid-May and into third by June. But from a low point of 9½ games out, they climbed back to within a half game of first in late July on the strength of Williams’s major league-leading home run total. Then baseball went on strike, and the rug was pulled out from under the Giants again.

All of baseball could be fairly said to have been unlucky in 1994, but the Giants suffered a more particular harm. With Williams on pace for 62 home runs and Bonds not far behind him with a 54-home-run pace, Giants fans looked forward to a season unlike any since the 1961 Yankees saw Mickey Mantle and Roger Maris compete to chase Babe Ruth’s record. That chance vanished with the cancellation of the season.
For all of its statistical weirdness, the 1993 season stands out even more as the last year of a bygone era. With two divisions, no Wild Card, a 100-plus-win team missing the playoffs, and a home run record stuck stubbornly at 61, that season feels like a different era than the one that would emerge when players at last returned to the field in 1995. Juiced balls and juiced muscles left Maris’s home run record to gather dust in the record books, and the expanded playoffs nearly eliminated the chance for a 100-win team to miss the playoffs. The Giants and Mets both fell below .500 that year, neither especially lucky nor unlucky, just bad.
Changes in the game since 1993 seem to have been aimed at eliminating luck and randomness. Instant replay gives umpires another take on their split-second calls. Expanded playoffs help to ensure fewer winning teams are left out of the chance for a title. In some ways, the difference between which teams win and which are truly good has been narrowed. But, as this year’s Rangers and Angels could tell us, luck still has a role to play in the national pastime.
I would argue that poor Pythagorean “luck” (over the long haul) is in actuality poor managing, be it in lineup construction, bullpen usage, or in-game management. It seems that teams with “bad luck” tend to win big and lose close. This year’s Red Sox are a prime example. Last I checked they were -3 wins this year by the Pythagorean calculation. And close games are exactly the games where a manager has the most effect on the outcome. If I’m wrong, then why is it that the same managers’ teams outperform their Pythagorean records year after year? Buck Showalter, Mike Sciosia, Bruce Bochy, and Joe Girardi are some current examples. Want to go back a ways? Joe Torre, Sparky Anderson, Tony LaRussa, and Earl Weaver are all in the top ten career-wise. And why is it that the same managers fall short of their Pythagorean records year after year? Back to the Red Sox, John Farrell has consistently fallen short of his Pythagorean record, and is considered one of the worst managers in the game today. Like the players themselves, whose true skill-sets take years to stabilize, once a manager has been managing for 4-5 years, we know his abilities, at least relative to his peers.
This line of thinking has largely been debunked. Studies with decent sample size show that managers do not consistently outperform or underperform their team’s base runs or pythag.
a quick study of many out there.
http://www.beyondtheboxscore.com/2014/3/17/5504652/manager-pythagorean-wins
Al Lopez says otherwise
Al lopez had a grudge against Billy Pierce the Teams 20 game winner that pennant year 1959 His stubbornness caused him to SIT OUT Pierce and they got their asses handed to them in series
AL Lopez old school manager old thoughts NOT a good manager
Joe Madden excellent manager New thoughts plus experienced decisions will destroy old rusty dusty baker
Then please explain why Sparky Anderson, Tony LaRussa, and Earl Weaver, widely agreed upon as three of the best managers in history, are all in the top ten in career wins over Pythagorean projection. Just WATCH THE GAME! Over time, you’ll see that managers like those above are playing chess, while others are playing checkers.
You point to your study, so I’ll point to mine.
http://www.beyondtheboxscore.com/2012/3/28/2908044/manager-wins-above-expectancy
If you look at managerial WAR, the names I mentioned above are STILL all in the top 25 all-time. The only one who drops out is Joe Torre. By the way, Gene Mauch had the worst career managerial WAR, If you ever saw him manage, you’d understand that one completely too.
There is an effect. You just choose to ignore it.
These managerial comparisons versus Pythagorean record should be expressed on a percentage basis, not just in terms of raw number of wins. It’s hardly surprising that managers who manage for a long time end up on the top 25 list by raw difference in wins – the percent variance to be on that list is much lower than for managers who manage for just a few seasons.
Both of these studies are lacking. If something is a real skill, it should exhibit some degree of year-to-year correlation across the sample of all managers. We routinely see that sort of analysis at sites like Fangraphs to try to assess whether certain traits of player or team performance should be thought of as sustainable and predictive or random noise.
Neither of the linked studies really does that sort of analysis. The one that shows LaRussa’s teams year-by-year result vs. Pythagorean record starts down that path, but leaves it anecdotal without a robust statistical comparison from a broad sample of managers. And the study linked by Green Mountain Boy certainly doesn’t show enough to prove his point.
Your just invoking the chicken and the egg argument. The best managers manage long enough to accrue managerial WAR or Wins Above Pythagorean BECAUSE they’re good managers. The poor ones weed themselves out rather quickly, these days especially.
To the commenter who basically said that players are going to do what they’re going to do once the manager sets the lineup, that’s obviously not true. If that were the case, we’d be seeing pitchers bat first, power hitters at the bottom, and speedsters in the middle… all of which would make no difference to the team’s performance.
There will ALWAYS be what I call “luck of balls in play”… the liner just foul or the towering shot knocked down by the 40 MPH wind blowing in. No one is arguing that, but to look at it on a micro level is ridiculous. It happens to the best teams as much as it happens to the worst. That’s why the season is 162 games, to weed the great majority of that stuff (noise) out.
“Your [sic] just invoking the chicken and the egg argument. The best managers manage long enough to accrue managerial WAR or Wins Above Pythagorean BECAUSE they’re good managers. The poor ones weed themselves out rather quickly, these days especially.”
That’s not the case when we go through your list of the worst managers, however. Many of them were also long-time managers. The list of the worst managers according to the post that you linked includes: Tommy Lasorda (21 seasons), Chuck Tanner (19 seasons), Lou Piniella (over 20 seasons), Mike Hargrove (16 seasons), Tom Kelly (16 seasons), Gene Mauch (24 seasons), etc.
Your claim doesn’t stand up – both lists (supposed best and supposed worst) include lots of long-time managers.
Antone who disputes what the Green Mountain Boy says need only look to the 1970 Cubs (84-78), “led” by Leo Durocher, who finished five games behind the Pirates (89-73), managed by Danny Murtaugh. The Cubs pythag record was a league best 94-68, while the Pirates were only 88-74. Cincinnati, led by Sparky Anderson, went to the World Series that year after sweeping Pittsburgh 3-0. The Reds were 102-60; their Pythag was only 91-71, which was ELEVEN games better than their actual record!
Anyone who disputes Green Mountain Boy’s completely anecdotal comment need only look to a sample size of 1 to prove my confirmation bias
-BaconBall
up vote
Any discussion of the 1993 Braves catching the Giants that does not include one of the best deadline deals in history is somewhat deficient. While Fred McGriff’s 3.1 fWAR wasn’t the only thing that helped bring them back, it was certainly helpful and much more than you can normally expect out of a mid season addition.
Adding McGriff to that already immensely talented team was vital to their ability to win 104 games. So I blame the bad luck of having the Padres be terrible, as part of the reason the Giants lost.
Problem – the managers decisions on who to play and how to use them are already baked into the Pythag. It doesn’t say “hey if you used your roster ideally here is your w-l.” It calculates it based on the way the manager has already used his roster.
Are you seriously trying to argue that managers and managerial decisions have the same degree of effect in blowouts as they do in close games?
Enjoyed the article. Thanks for posting.
How about carrying this further, to individual players? I’ve listened to arguments before about pitchers being lucky or unlucky due to run support, and RBI leaders benefiting from strong lineups ahead of them….but how about something a little more involved like career BABIP variances or FIP variances?
Might be interesting and debunk a lot of myths.
Funny how you can buy something as seemingly ephemeral as “luck,” or is it coincidence that the teams with the higher payrolls seem to do better in actuality in most years than teams with lower payrolls.
Anyway, one problem I have with labeling a SABRmetric concept with a term like “luck” is that there is almost certainly a large number of the fanbase who think the term means we believe in faeries and demons and such. It’s a loaded word.
I also think fans who invoke “luck” usually use it in the bad sense, when something goes wrong for his/her team. What it really means is, “My team isn’t good enough to win usually, but I can’t admit that, so I need a word that means unseen/unknown outside forces have some influence on whether we win or not. Hence, bad luck.”
It’s funny … As you note, Kyle, “It’s whether … whether the batter hits that hanging slider over the center field fence or just misses it and pops it up for an easy out”
Now the difference between the popup and the 450-foot homer is probably a fraction of an inch on the bat. But for the 450-foot homer, nobody jumps up and shouts, “Wow, he really had some good luck on that ball.” Positive outcomes get attributed to talent; negative outcomes get attributed to “luck.”
Again, I don’t mean in the SABRmetric sense, I mean I think that’s what the average fan thinks “luck” is about. I’d rather we didn’t play into that, and found another word to mean what “luck” stands for in the SABR sense. Since where the ball goes is largely a matter of physics, maybe use “physics” or some other word not so loaded.
How about randomness. Many or most hanging sliders will be hit hard or out of the park, but a certain percentage won’t be and which ones are or aren’t is largely random. Each individual baseball game has numerous random factors; over the course of a season, the more skilled teams will win more often but in any individual game or a series, random factors (“luck”) may prevail.
I prefer the term “unpredictability” to “luck” for the reasons that you state, plus some others.
Sometimes a weak-hitting player hits a home run off a great pitcher, and sometimes a bad pitcher strikes out a great player. We can reasonably believe that statistics tell us that such outcomes aren’t likely to occur often over a large sample, but simply dismissing them as “luck” or “randomness” seems overly dismissive of the players involved. For that particular plate appearance (or even pitch), the players involved may have actually performed well above (or below) what we’d expect on average based on their talent levels. From the point of view of a GM or manager (or fan) that’s just good or bad luck, but I can understand why the player who hit the HR or threw the strikes wouldn’t like that characterization.
That sort of unpredictability is in contrast with events in a baseball game that can reasonably be characterized as good or bad “luck”. A well hit line drive is right at an infielder instead of a few feet to either side of him. A ball is fair or foul by a few inches. A 50-50 pitch on a 3-2 count is called a ball or a strike.
Green Mountain Boy said…
“Gene Mauch had the worst career managerial WAR, If you ever saw him manage, you’d understand…”
I saw Gene Mauch manage quite a bit in the 1970s and 1980s. And I’d strongly second what Bill James wrote in his 1983 Baseball Abstract.
“Records are only meaningful in the context in which they are complied, and that is no less true for Gene Mauch’s wins and losses that it is for Bob Horner’s home-run rates or Pete Vuckovich’s wins and losses. And in the context in which it has come, Gene Mauch’s record ain’t bad at all. The chart below gives his record in detail.
. . . . . . . . . . . . . . . . BEFORE Mauch . . . . . Mauch . . . . . AFTER Mauch
________________________________________________________________________________________
Philadelphia . . . . 134-176 .432 . . . . . 645-684 .485 . . . . . 113-148 .433
Montreal . . . . . . . 398-563 .398 . . . . . 499-627 .443 . . . . . 103-194 .401
Minnesota . . . . . . 158-163 .492 . . . . . 378-394 .490 . . . . . 124-183 .404
California . . . . . . . 175-194 .474 . . . . . 122-103 .542 . . . . . 151-173 .466
California . . . . . . . 151-173 .466 . . . . . 257-229 .529 . . . . . 166-158 .512
[*Per Bill James, column two is the club’s record in the two season’s before Mauch took over as manager. In Philadelphia that’s two years and two games as Mauch took over two games into the season. In in first stint as manager in California, it’s for two years and 47 games for the same reason. In the case of Montreal, Mauch managed an expansion club, so James substituted the average record of an expansion team over its first six seasons for use in the “before Mauch” column. James used a similar process for the “after Mauch” column. In Philadelphia, that meant one season plus 109 games. In Minnesota, it meant two years plus 37 games. Since Mauch initially retired as Angels manager after 1982, I’ve added in two years for that in the “after Mauch” column as James would have done, but did not include 47 games into 1985 because Mauch came back to manage in 1985. The second California row is post-James’ article. It includes 1983-84 in the “before Mauch” column and 1987-1988 in the “after Mauch” column.]
A bad manager? Not at all; a good judge of talent, an excellent psychologist and motivator, a fine handler of pitchers who built generally superb bullpens, an intense and capable in-game strategist who worked too hard on that phase of the job, and did not always respect tis limitations. A master of details, a master of small things. He may have analyzed ball games somewhat better than he analyzed pennant races.”
One run games are also more likely to be low scoring games, so dominant starting pitching could be involved (or a team could better suited to winning low scoring games for some reason) Ex: a game with 3 or less total runs will be a 1 run game whereas a high scoring game is unlikely to be decided by one run.
Secondly I have a pet peeve related to this topic. When people say Texas is lucky, they don’t quntify how lucky they are. Are we talking about an outcome we should expect once every 5 seasons or once every 500 seasons?
In their 27 one run wins, Texas starters have an ERA of 2.75 (according to my computations).
I’m not sure what this means, but I went over the Braves records in 1-run games from 1991-2005,which included their 14 division championships. I included 1994, the strike year, even though they were in second place because they were still a likely playoff team if the season hadn’t ended:
-in six of the years, they were at or below .500in one-run games.
-in five of the years, they were 10 or more games above .500 in one-run games (including 1995 when they won the World Series)
-in the other four years, they averaged less than 4 games above .500 in one-run games.
Basically, in 10 of the 15 years, they were either at or below or slightly over .500 in one-run games, substantially worse than their overall records. Of course, they played a lot of one-run games because their pitching kept the games close, but, in general, they weren’t particularly good at winning them even though they were obviously a superior team.