Master of fooling
I’m not here to tell you he’s a great pitcher—he has a bunch of Cy Young Awards and pitching Triple Crowns proving that.
And that he possesses one of the most devastating change-ups in baseball is old story.
What I’m trying to do in this article is give you a feeling of what happens to a batter when he is fooled by a change of pace.
To do that, I’ll use the help of a great book, the work of some fellow writers (here at THT and elsewhere) and the “Master of Foolers,” Mr. Johan Santana.
And, obviously, PITCHf/x data.
The fooling pitch
You can’t sneak a low-80s pitch without much movement past major league hitters unless you can make them believe something else is coming at them (although Mark DiFelice seems to be trying to disprove the previous sentence). Upsetting time is the whole philosophy behind the change-up; look at the next couple of tables and you will get a feel for what upsetting time is.
Scenario: Santana (data from the full 2008 season) is on the mound, a righty is at the plate (the change-up is usually employed against opposite-handed batters) and the at-bat already has gone on for at least three pitches…
Here comes the change-up…
Pitch run value by number of fastballs already thrown during the at-bat

#FB run value
 1   -0.031
 2   -0.035
 3   -0.040
Pitch run value by number of change-ups already thrown during the a- bat

#CH run value
 0   -0.047
 1   -0.045
 2   -0.012
The best fooler
When Santana throws a change-up to a righty after a fastball, the run value of the pitch is -0.024. He went to that sequence 434 times in 2008, making it the most used combo by him after the fastball-fastball. Multiply those two numbers and you get -10.570, the number of runs created by opponent righties on Santana’s change-ups following a fastball. As you can see from the next table, it has been by far the most lethal combination for him*.
*I’m sure this sentence is going to create confusion: I shouldn’t have written combination, because I’m actually calculating run values for just the second pitch in the sequence.
Santana's combinations: run value of the second pitch.

pitch      previous      times      pitch       cumulative
           pitch         used       run value   run value
Change-up  Fastball        434      -0.024        -10.57
Change-up  Change-up       198      -0.022         -4.26
Fastball   Fastball        638      -0.006         -3.55
Fastball   Slider           43      -0.066         -2.83
Change-up  Slider           38      -0.035         -1.33
Slider     Change-up        26      -0.019          -0.5
Slider     Fastball         43      -0.007         -0.28
Fastball   Change-up       385       0.009           3.3
And one of the most lethal in baseball.
Top MLB combinations: run value of the second pitch.

pitcher     batter   pitch     previous  times   pitch       cumulative
            hand               pitch     used    run value   run value
 M. Pelfrey R        Fastball  Fastball    721      -0.027      -19.22
     C. Lee R        Fastball  Fastball    931      -0.017      -15.59
J.C. Romero L        Fastball  Fastball    264      -0.053      -13.98
  R. Harden R        Fastball  Fastball    355      -0.033      -11.63
 G. Balfour L        Fastball  Fastball    324      -0.035      -11.32
 E. Santana R        Slider    Fastball    252      -0.044      -11.16
 J. Santana R        Change-up Fastball    434      -0.024      -10.57
J. Papelbon L        Fastball  Fastball    380      -0.028      -10.56
   D. Davis R        Cutter    Cutter      300      -0.035      -10.39
 J. Broxton R        Fastball  Fastball    244      -0.041      -10.03
In front of Santana’s change-up-following-fastball we have just back-to-back fastballs. Some of them are actually a mix of fastballs/sinkers combinations—and… another Santana.
Think time, swing time
The great book I alluded at at the beginning of this piece is Prof. Robert K. Adair’s The Physics of Baseball.
Here I’m going to take advantage of his work, particularly chapter 3 and the figure 3.3 (these are references for the third edition).
Adair shows us that the batter begins to think about swinging (or not swinging… or getting out of the way in case of a brushback) around 225 milliseconds before he actually makes contact; 150 milliseconds before contact he is completely committed and already in motion, and he has only a little margin for adjusting his swing according to subsequent visual information.
If a batter has timed Santana’s fastball, his thinking process gets under way when the ball is 28 feet from home plate, while he’ll commit to swinging when it’s 19 feet away. (These numbers are calculated on Santana’s average fastball).
But when he has timed the heater, that’s the right time to throw him the slow stuff! And where is the change-up at think time? fastball think time, I mean. And what about swing time?
Here’s a lateral view of Santana’s average fastball (blue circle) and average change-up (red).

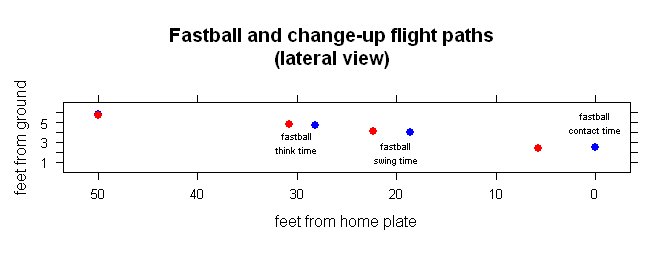
The change-up is already trailing the fastball by 2.6 feet at think time and by 3.7 feet at swing time.
Unfortunately, that’s not the angle the batter is seeing the pitch. Here is the flight from a catcher’s point of view, not exactly the same as the batter’s, but a lot closer.
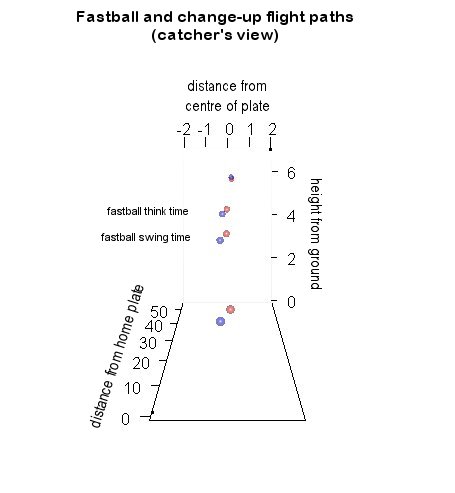
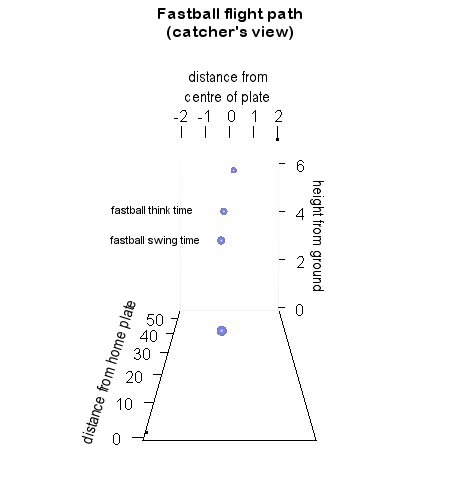
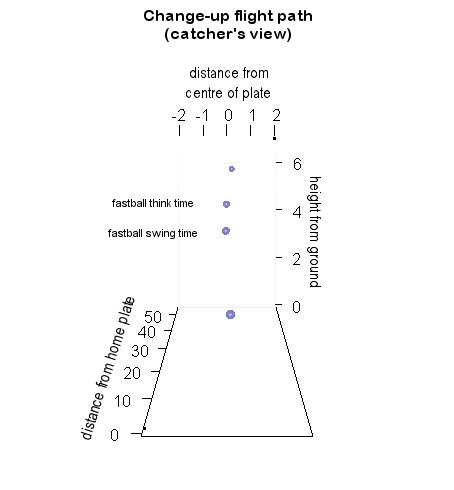
From this angle it’s a lot harder to distinguish the position of the change-up from that of the fastball, especially when you don’t have the luxury of watching them together and colored in a different way (see below).
And that’s just less than 250 milliseconds after the ball has left Santana’s hand!
Looking at these pictures one has to wonder why hitters aren’t even more helpless against Santana’s fastball/change-up combo. A couple of things give some margin to the men at the plate: pitching motion and spin rate. You shouldn’t have any trouble in distinguishing a sphere revolving at 2,500 rounds per minute from one at 2,000 in a quarter second span, right?
References & Resources
Robert K. Adair, The Physics of Baseball, third edition, Perennial 1990.
Standing on the shoulder of giants, Harry Pavlidis created this spreadsheet to plot pitch flights; standing on the shoulders of this Cub I drew the charts you see in this page.
Another great article Max.
I second Peter’s comment.
Wow, this post is amazing. It’s amazing the type of technology we have today. Pitch trackers can tell you exactly where the pitches are?
From the second chart, it looks like the deception is even better for RH batters.
This is awesome
is there anywhere I can find the matheamtical physics provving why a change up is slower than a fastball even though the arm action (velocity) is the same?
John,
here’s an excellent work by Matt Lentzner.
http://www.hardballtimes.com/main/article/a-mechanical-model-of-pitching/
Hope you’ll find what you’re looking for.