More on Pitch Sequences
“I find the great thing in this world is not so much where we stand, as in what direction we are moving.”
Justice Holmes was clearly a baseball fan. How else can you explain this quote, in which he very obviously addresses the issue of pitch sequences? Last month I took a look at pitch sequences and found that, as in this world, where you eventually end depends not only on where you currently stand but also the direction in which you are moving. In particular, what happens on a 1-1 pitch depends on whether the pitches arrived strike-ball or ball-strike. It also turned out that the type of strike—swinging, called, or foul—matters, although I did not verify whether that was due solely to the fact that better pitchers tend to induce more swinging strikes.
Nevertheless, that investigation showed that plate appearances are not state functions; as Tangotiger said at the time:
That is, is 1-1 itself a state, or do I now have to say the state was “0-1 to 1-1”, and “1-0 to 1-1”. What I would consider one state for Markov chain purposes is actually better described as two states. The interesting work is to see how far back the states need to go. That is, if you have a 3-2 state, how far back in the count do you have to go, in order to establish the state you are in.
The last bit about full counts piqued my interest, and today I want to take a stab at the problem. I’m not a databasing maven, so I’ll be approaching this as a toy problem rather than a hardcore statistical study. I’d like to do such a study in the future, but for now I am afraid you will have to deal with my primitive computer skills.
The Patient Type
The setup of today’s toy problem is the passive batter. There exist plate appearances that are one-sided affairs in which the batter watches pitch after pitch sail past the plate. Sometimes the batter is so passive that five pitches come and go with nary a swing in sight. On ocassion, two of those pitches will be called strikes and the other three will be called balls. And every so often, some of those pitch sequences will look like the following:
Sequence 1: ball – ball – ball – called strike – called strike
Sequence 2: called strike – called strike – ball – ball – ball
Does the performance of batters vary from sequence 1 to sequence 2?
During the 2005 NL season, sequence 1 ocurred 389 times and sequence 2 occurred 122 times. My guess as to why the former was far more common is that a plate appearance that starts with three straight balls likely engenders some amount of patience in even the most hack-happy hitter, whereas a plate appearance that starts with two called strikes will encourage the hitter to pull the trigger. Because these two pitch sequences are extreme examples, we should first check for a selection bias; that is, a comparison between the two would be worthless if sequence 1 occurred mostly with the Albert Pujols and sequence 2 occurred mostly with the Craig Counsells. To do this, I averaged the seasonal statistics of the hitters and pitchers who found themselves in these situations:
	|---Sequence 1---|	|---Sequence 2---|
	Hitters   Pitchers	Hitters   Pitchers
AVG	 .264	    .251	 .258	    .253
OBP	 .334	    .316	 .338	    .316
ISO	 .136	     --*	 .144	     --*
K%	 .158	    .169	 .169	    .165
BB%	 .086	    .087	 .098       .084
BABIP	 .322**	    .308**	 .317**	    .309**

* Not available
** BABIP here includes home runs
Notice how the quality of hitter who found himself in sequence 1 is essentially the same as the quality of hitter who found himself in sequence 2. The hitters of sequence 1 hit for slightly better average and the hitters in sequence 2 hit for slightly higher power while walking and striking out more often; in any event, none of those differences are statistically significant. This is even more true for the pitchers. To make a long story short, there is no need to worry about selection bias here. Let’s get to the meat of this study.
The Payoff Pitch
Let’s take a look at some graphics to see what happens when the payoff pitch is delivered. I should point out that I am looking at the outcome of the plate appearance, not of the 3-2 pitch. That means that if the batter fouls a few off and then draws a walk, it is included in the dataset.

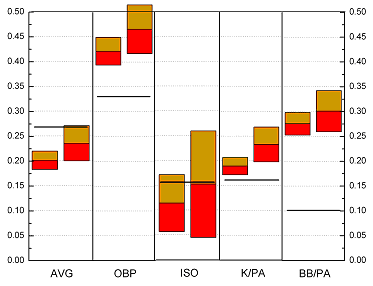
There’s a lot going on in the plot so let’s can take it one step at a time. Each column corresponds to a batting metric (AVG, OBP, and so on) and contains two floating bars. The middle of each bar shows the mean performance with the top and bottom sections extending for two standard deviations away from the mean. The first bar represents the mean performance of hitters in sequence 1, the second represents the performance of hitters in sequence 2, and the solid line is the overall league average (in all counts and sequences) as a point of reference.
So, to read the OBP section, in sequence 1 hitters reach base at a .458 clip and in sequence two at a .393 clip. These are significantly above the solid line, which is at the league average .330 OBP. However, due to the uncertainty in the measurement, we can’t say for certain whether there is a difference in OBP between the two sequences. Everybody with me? Good.
What the plot essentially tells us is that coming to a full count from sequence 1 versus sequence 2 has no effect on power, little or no effect on reaching base, but a large effect on hitting for average. The data show that strikeouts increase slightly when the pitches arrive in sequence 2 and that a batter hits for higher average when the when the pitches arrive in sequence 1. By and large, batting average appears to be the one metric of performance most affected by the pitch sequence.
But since batting average can be something of a fluky metric, it seems a little suspicious that it is the only one of the five that appeared to be affected by pitch sequence. So I took a look at another dataset, the 2005 AL, to see if the phenomenon would show up again.

Dang. Whatever effect we might have been seeing on batting average in the 2005 NL appears, if anything, to be reversed in the 2005 AL. I know the leagues are different, but I’d be hard-pressed to believe that the fundamental approach on a 3-2 pitch differs between the senior and junior circuits. It looks like we can’t make any hard conclusions about how these pitch sequences affect performance. The only thing that we might be able to say based on the two datasets is that sequence 2 results in slightly more strikeouts.
Why Bother?
You might be wondering why I even bothered writing about this if my conclusion is that there is no conclusion. Two reasons:
1) I’ve now looked at two counts (1-1 and 3-2), each approached by two different pitch sequences. For one (the 1-1 count), pitch sequence matters. If we wanted to model plate appearances, a Markov chain whose input was “1-1 pitch” would be insufficient. But for another count (3-2, no swings), pitch sequence doesn’t seem to be important, or at least not predictive of performance. So there is a long way to go to before we understand how or even if pitch sequences affect the outcome of a plate appearances, and I hope what I’ve shown today is that it is not quite as easy a problem as my previous article might have suggested.
2) Tangotiger’s question was, “If you have a 3-2 state, how far back in the count do you have to go, in order to establish the state you are in.” Well, it’s not even clear whether or not called strike – called strike – ball – ball – ball is a different state than ball – ball – ball – called strike – called strike are different states going all the way back to the first pitch. Perhaps we need only concern ourselves with the last few pitches to determine the state.
3) It’s February and you are so desperate for baseball content that you’ll read even this drivel.
Pitchers and catchers report in 10 days!
References & Resources
The data were culled from the incomparable Retrosheet. Here’s the necessary blurb: The information used here was obtained free of charge from and is copyrighted by Retrosheet. Interested parties may contact Retrosheet at “www.retrosheet.org”.
Tangotiger’s indispensable Book Blog had some interesting discussion on pitch sequences last month. He also has some information on hitting performance by count.
Detroit Tigers Weblog has some related articles on first pitch swinging and the depth of plate appearances.