Roster Movement Is Decreasing, and Teams Are Becoming More Homogeneous
Clayton Kershaw had a chance to leave via free agency this winter. Instead, he signed an extension with the Dodgers. (via Arturo Pardavila III)
Fans who wish to hearken back to a simpler time when players stayed in one place and never left may be getting their wish. Since 2004, the average number of teams a player plays for in his career has decreased by 14.5 percent, from 2.34 teams in 2004 to just two teams in 2018.
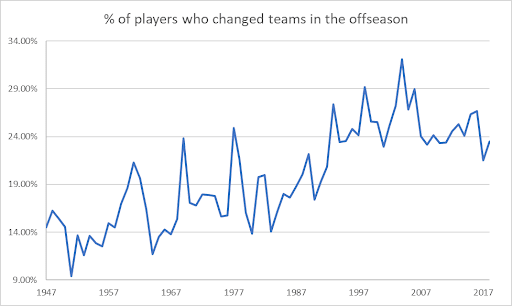
Below is a graph detailing how player movement has changed over time since 1947. Although still not at the levels we saw in the ’80s, the overall pattern of player movement across the major leagues has been trending downward since the mid-2000s.
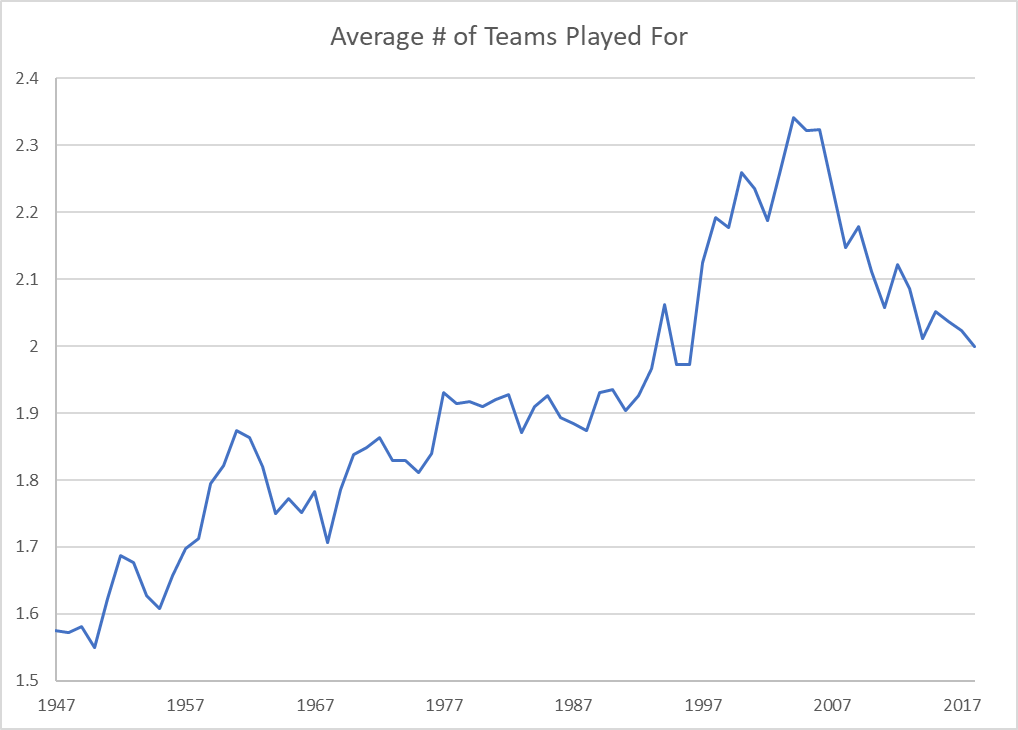
With all the talk of collusion, and the relative coldness of the hot stove this offseason, I find this fascinating and very relevant to the conversation. This article will seek to delve into the reasons for this change, which I believe is due to a litany of factors.
Rosters Are Getting Younger
2004 also coincides with the period where the average age of players across baseball peaked at around 28.6 years.
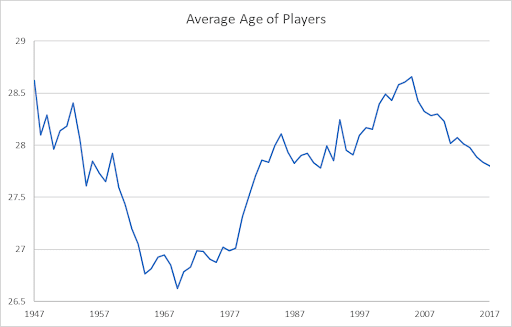
The average age of major league players and the average number of teams they have played for to that point in their career haven’t always related to each other, but since the late ’80s, the two have become almost directly correlated. Even slight changes in the average number of teams a player has played for is reflected in the average age of players across the league. Today, the average player is nearly a full year younger than a decade ago.
A look at the average number of seasons played in the majors yields an almost identical looking graph if we look at years after 1997.

Again, we see this rising, falling, rising, and then steadily falling trend beginning around 1991. The only logical conclusion for this is that there are just fewer veteran players in the major leagues. But what sort of “veteran” player is being phased out? Below is a look by years of playing experience.
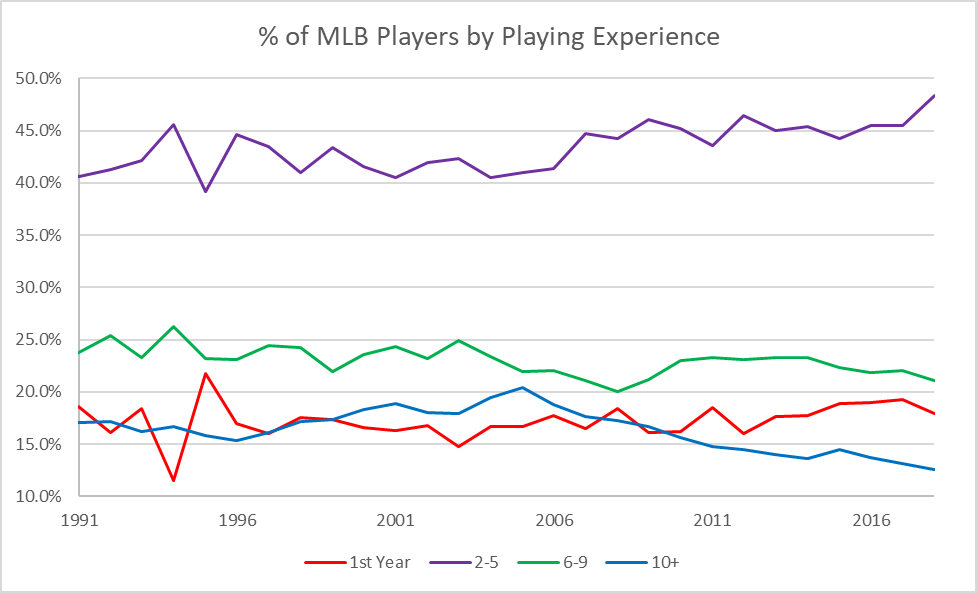
Aside from 1994 and 1995, when the strike skewed the number of first-year players, the percentage of first-year players has been relatively consistent over the previous 20-plus years, typically composing between 16 – 18 percent, with a slight increase in recent years.
The percentage of players with two to five years experience, on the other hand, has been steadily rising since 2004, going from 40.5 percent to 48.4 percent in 2018 — a substantial increase of 19.4 percent. Much like rookies, the number of six- to nine-year players has stayed relatively consistent throughout this period, although it is clear that some of the gains in the percentage of players with two to five years of playing experience are due to a slight drop in the six- to nine-year bucket. After these players made up 25 percent of the major leagues in 2003, they have yet to total more than 24 percent in any season since.
The most consistent drop has come in the number of players with 10 or more years of playing time. After peaking in 2004, when they composed 20.4 percent of all major leaguers, the percentage of players with 10 or more years of playing experience fell to just 12.6 percent in 2018. It was a near historic low not seen since 1955, a time when players’ World War II service diluted their years played.
What’s become clear over the last decade-plus is that not only are teams beginning to shy away from giving big contracts to long-time vets, they are shying away from signing them to any deals at all.
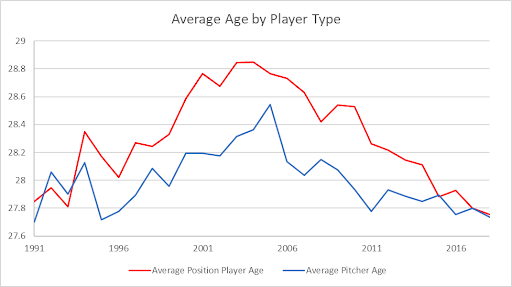
A look at the average age of both pitchers and position players reveals that both have been on a downward trajectory since the mid-2000s, with the percentage drop in age more significant among position players. Since 1995, the average position player has almost always been older than the average pitcher, but in 2015, this trend changed when the two became virtually equal and has remained this way ever since. So while an increase in the number of pitchers on the roster may have explained some of the trends at first, it is no longer the case.
The End of the Steroid Era
While the actual beginning and end of this era lacks precise years, it is possible that the extensive use of PEDs among veteran players had some impact on the increased presence of older players in the game throughout the 1990s and the mid to late 2000s.
The veteran peak of 2004 coincides with a 39-year-old Barry Bonds winning the National League MVP award, and a 41-year old Roger Clemens winning that league’s Cy Young Award. It is also just two years removed from the BALCO scandal coming to light, and coincided with baseball’s survey tests under the joint drug program.

How much of an effect this has had will never be known for sure, but the decrease of experienced veterans coupled with drug testings and the increased stigmatization associated with taking PEDs is likely not coincidental, though it certainly doesn’t explain the entirety of the decrease. Changes in how players are statistically evaluated, and an overall reluctance by front offices to sign players over 30, no doubt have their own part to play independent of any steroid effect.
Teams Are Using More Pitchers Than Ever Before
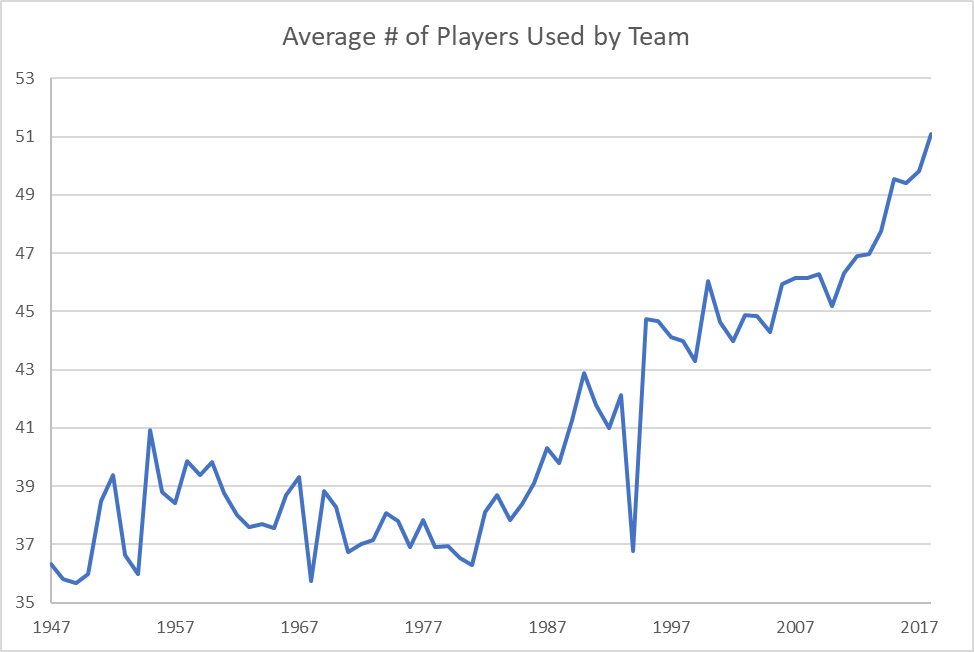
Aside from a dip in 1994 due to the players’ strike, the average number of players who appear on a major league roster throughout the season has been steadily on the rise since the early 1980s.
This trend is not surprising to anyone who has paid attention to the game in recent years, but what may be surprising is just how much of this trend has been driven by the increased number of pitchers in the majors.

While the number of position players has stayed relatively consistent over the previous 20 years, the number of pitchers typically used by a major league team has increased by 50 percent since 1991. However, as we mentioned earlier, the average ages of pitchers and position players are almost equal, so the switch from having to carry 10-11 pitchers to 12-13 on the 25-man roster is not what is driving age down.
That said, the forces behind the average age of pitchers decreasing seems to be different from the forces driving down the average age of batters. While position players appear to be merely getting younger, the number of innings being accounted for by full-time major league pitchers is going down relative to the number of innings pitched by minor league call-ups.
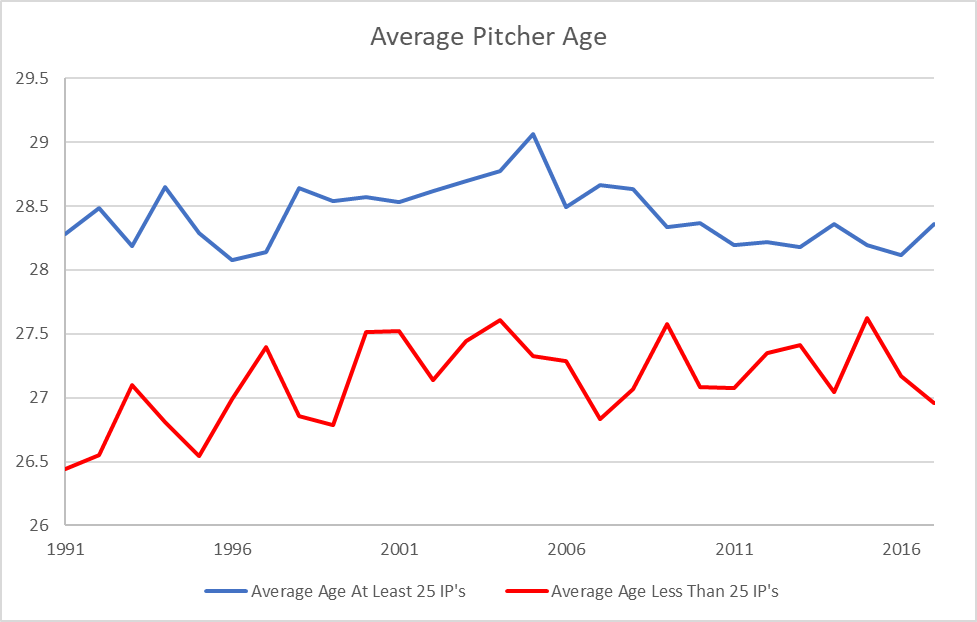
If we look at the graph showing the average age of pitchers who throw at least 25 innings in a season versus those who do not, we see that pitchers with fewer than 25 innings pitched in a season are always younger than those with 25 innings or more. It is worth noting that the difference in age between these two groups has steadily decreased over time, while the average age of pitchers with fewer than 25 innings pitched has remained about the same, meaning the average age of established pitchers has gone down. But this doesn’t explain everything.
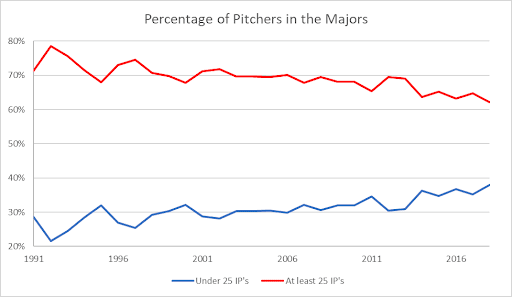
Unsurprisingly, the number of roster spots taken up by pitchers under the 25 inning plateau hasn’t just increased by sheer number, but as the overall percentage of the pitchers in baseball as well. This increase of minor league call-ups for pitchers is the other factor that is driving down average pitcher age , and is part of why using more pitchers than ever is contributing to the overall drop in average player age.
Free Agency Isn’t What It Used To Be
Last year 1,379 players took the field at some point during the regular season. Of these, 147 played for more than one team during the season, meaning roughly one out of every 10 players changed teams at some point last year. In 2004, 1,247 players were in major league baseball, and 94 players changed teams at some point during the season. That’s ab0ut 7.5 percent.
This increase in midseason trade activity would seem to run counter to the idea that the amount of overall roster movement is going down.
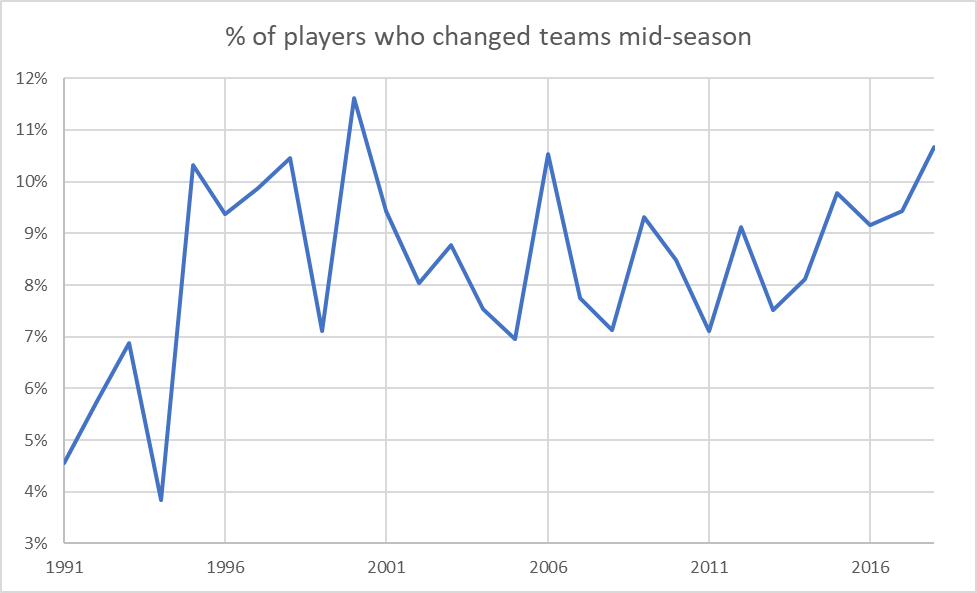
A look at a graph of players who changed teams midseason reveals an up and down pattern with little to no correlation to overall player movement.
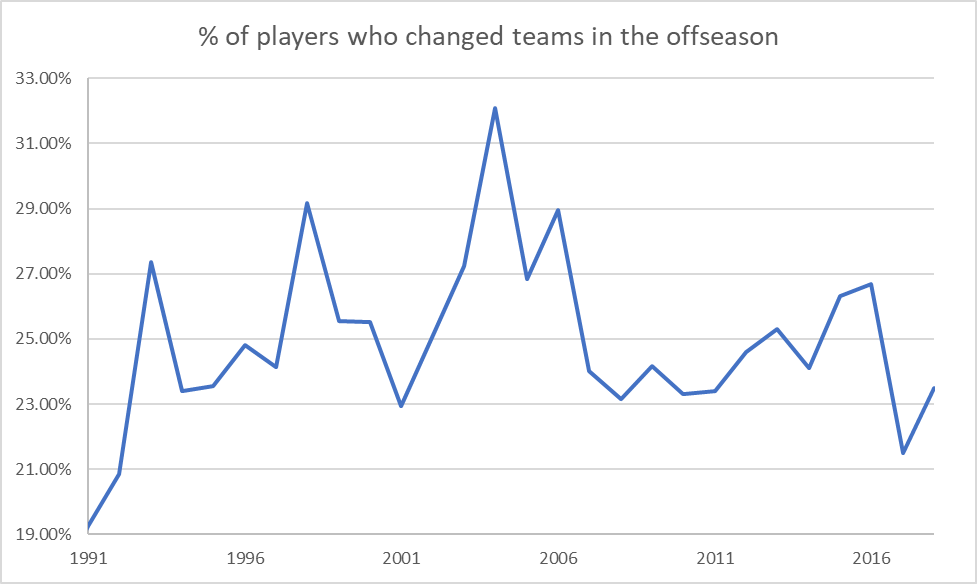
A look at the amount of offseason movement reveals that the free agent market and offseason trade market account for more than double the amount of player movement that midseason trades do. It also shows that the hot stove has been cold relative to where it was from the late 1990s to the early 2000s. 2017 produced the fewest offseason team changes by players in over 25 years, while 2018 had little more.
While movement is low compared to recent years, it’s worth pointing out that this is nowhere near as low as it was during the mid-1980s, which saw offseason player movement drop down to levels not seen since the mid-1960s.
Conclusions
To understand why the player movement is decreasing, I feel we also need to know why teams are moving to younger players and being less active on the free agent market, while still making as many trades as ever.
Ownership seems increasingly unwilling to spend in free agency, even for younger players. This, more than anything, appears to increasingly be the explanation. Teams are also reticent to enter into large contracts with players over 30, in part because of the realities of aging, and in part because of a seeming unwillingness to spend that transcends aging concerns and suggests troubling realities about what is driving team profit and how competitive many teams are trying to be at any given time.
What is clear to me is that if the goal is to make veteran players more valuable, than more may need to be done to reverse trends in game play that tend to favor the use of younger players, particularly when it comes to pitchers.
I believe the trend of younger position players could reverse itself in due time. But the pattern of younger pitchers being in the game isn’t likely to change if bullpenning is to become more prevalent. Teams are always going to be incentivized to carry more and more relief pitchers who can throw at a high velocity, not just on the 25-man roster, but the 40-man as well. These players will always skew younger than already established major league pitchers.
If the goal is merely to have players make more money, it will also require the MLBPA and the owners to take a different approach to how they structure salary than they have in years past. If the youth movement is here to stay, then both sides need to take a hard look at how the CBA should be restructured to account for it.
Thanks for the interesting article. Very informative. I think these numbers here are a little off, though, “going from 40.5 percent to 48.4 percent in 2018 — a substantial increase of 19.4 percent”. If I did my math right, that’s an increase of only 7.9%. Still significant, but nothing compared to 19.4%.
I’m calculating the percentage of change there rather than the absolute value. That’s where the difference is coming from.
Appreciate the kind words.
Eight is 20% of forty, so the 19.4% increase is accurate. The percent increase/decrease isn’t 48.4-40.5, it’s [(48.4-40.5)/40.5]*100. It’s just confusing because both figures are percentages, but they’re percentages of different things.
Technically the 7.9 figure isn’t a % it’s a percentage point. So it would be accurate, but not really helpful in this context to say “- a substantial increase of 7.9 percentage points.”
It’s pretty clear that older players were staying in the game longer by taking steriods, and also that testing has pretty much put an end to that. Couple that with analytics, where teams are now looking at a player’s wins above average (WAA) versus players already on their roster and discovering that most older, steroid-free players offer little in the way of added value compared to the ludicrous salaries agents like Boras are demanding for them and then throw in the growing awareness of how harmful long-term albatross contracts are and you have today’s free agent market.
The demands of today’s veteran free agents are far too high, both in money and years. The market is wising up, and they will have to lower their expectations.
I am having a hard time understanding why so many in the media keep painting these players as victims. The richest always dictate terms to the less wealthy. That will never change with humans in their present state. They will still be paid many times over what most professions would ever be able to pay. The game is already out of reach financially for a fairly large portion of the country. Why do they want to help accelerate the inability of middle-class/poor people to see a baseball game? Contracts increasing exponentially WILL do that.
I thought it was proven that player salaries and ticket prices have no correlation…
Like a bunch of Pujols-types deals shouldn’t make it cost more to go see the game?
Profits of owners increasing exponentially are what is doing it, not players’ salaries. It is time for a combination of letters to congressmen and senators and a fans’ boycott of MLB games and MLB-logo and MLB-endorsed products. How attached are we to the bread and circuses? Are we so addicted to MLB producing baseball games that we will chain-smoke through the off-season and totally go bananas when there is a strike? If that is the case, then the owners not only own the franchises, they own us as well. I hope not. Go out and watch the colleges, the indies, the high schools. It can be fun. You can watch baseball in Latin America and Australia in the winter for that matter. Broaden your horizons.
I think that what Johnston is saying is generally correct.
Reading some of Moehringer’s conclusions, he seems to be making an implicit claim that there is a substantial group of veteran position players in their 30’s who are still reasonably projected to play at an MLB-caliber level but simply aren’t finding contracts. Not “failing to find contracts that pay as much as they’d like”, but failing to find contracts, period.
Is there in fact evidence that there is a significant group of older players each year who project as at least bench caliber MLB players – say ~1 WAR or so – but don’t find contracts due to whatever combination of roster space limits for position players in this age of large bullpens and/or a general team preference for younger players (beyond simple projected performance)?
I can believe there’s a little bit of that trend at the margin because current roster construction makes it tough to roster non-catcher bench players unless they have positional flexibility, which might be a particular problem for aging corner outfielders and first basemen who are no longer good enough to start. The bigger issue, though, looks to be what Johnston is pointing out: in this post-PED testing era, aging curves are simply different. I’m not sure why Moehringer is so sure that “it certainly doesn’t explain the entirety of the decrease” (or at least the vast majority of it).
Hm, I feel it would make more sense to compute team changes per year played, or a similar mobility rate state. As you note, your career teams counting stat is largely seeing player age, but you could factor that out.
It’s so sad what the owners and Manfred are doing to the game. Look at the avg tenure of mlb player above….now tell me why you think control is 6 years before they have to pay anyone. So sad, their will be no fans left when it’s all said it done.
In MLB and other pro sports there are, as in every other economic system, three components: capital, labor and consumer. In the case of sports, the capital is the owners, the labor is the players, and the consumer is the fans. The owners are now making obscene amounts of money whether they produce a winning product on the field or not. The players are divided between the successful ones that make it to the Major League level and stay there for several years, some better than others, but they all make pretty good money. If you are getting paid millions, it’s not bad. The minor league players are not doing well and they have a beef. They may never make it to the majors or maybe a cup of coffee. The third group are the consumers, the fans. Big market fans get winning teams more often and get post-season games with more excitement etc. Small market fans get a winner much less often. The profits of the owners have gone way up and the price of going to a game has become extremely expensive, with large percentages of tickets being sold as corporate (tax-deductable) season tickets. Owners can make much more of a profit than they once did without giving the fans a better product on the field. Players are making more than they used to but not in proportion to what the owners have gained. Fans are getting a worse deal unless they are big-market corporate season ticket holders. And the guys who suffer the most, with nobody going to bat for them, are the minor league players who carry much of the development of players on their backs. They guys who serve as depth and never make it are paying. They guys who might make it and don’t are playing. They live on peanut butter sandwiches and sleep on mattresses in crash pads. The system keeps out minority players and other people without means to take a flyer of a few years to see if they make the Show. In an ideal world I would like to see living wages for MiLB players and community ownership to equalize markets more.