Thanks for the memories
We all know that how a batter performs depends on the count. Even novices know that a 3-1 count is good for the hitter and an 0-2 count is good for the pitcher. A few months ago, I showed that the outcome of a plate appearance depends not only on the count, but also on the pitch sequence used to arrive at that count. Specifically, I found this to be true on the 1-1 pitch: it really does matter whether the pitch sequence was ball-strike or strike-ball.
Since then, I’ve tried to find a similar effect in 3-0 and 3-2 counts, without success. The outcome of a 3-1 count that is the result of ball-ball-ball-strike is not different from any other 3-1 count. For full counts, batter performance in ball-ball-ball-strike-strike situations are not that different than strike-strike-ball-ball-ball situations.
It may be that pitch sequence really only matters toward the beginning of a plate appearance, as in the case of the 1-1 pitch. So today, we’re going to revisit that 1-1 pitch and slowly work our way into the future to see if pitch sequence becomes less important as we move further into the plate appearance. In other words, we’re going to try to find out how long a batter’s memory lasts.
Memory, all alone in my spreadsheet
Luckily for us, the good folks at Retrosheet record the pitch sequences of almost every plate appearance logged over the last several years. This study uses data from all major league games in 2006. First, we’ll take a look at the outcome of 1-1 pitches put into play, and then we’ll step forward a pitch to see how the outcome changes, controlling for whether the next pitch is a ball or strike. For this study, we’ll only step forward two pitches, and we’ll limit ourselves to 1-1, 1-2, 2-1, and 2-2 counts. Graphically, we can describe this as:
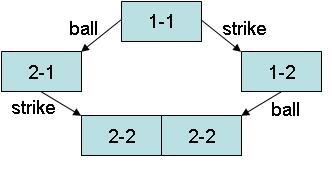
Each box shows a count, and the arrows show how we can get from one count to another, depending on whether the subsequent pitch is a ball or a strike. You can think of the arrows as describing a path, and this diagram shows four different paths: one from 1-1 to 2-1, one from 1-1 to 1-2, and two from 1-1 to 2-2. If we count the 1-1 pitch as a path itself and recognize that a 1-1 count can be brought about by ball-strike or strike-ball, we have ten possible paths (five pairs) to examine! Those paths are:
1. BSX
2. SBX
3. BSBX
4. SBBX
5. BSSX
6. SBSX
7. BSBSX
8. SBBSX
9. BSSBX
10. SBSBX
(B = ball, S = strike, X = ball in play)
For each path, we’ll look at the result of the balls in play on that path in terms of batting average and isolated slugging. (Note that by the nature of this exercise, there will be no walks to consider and therefore batting average and on-base percentage are essentially the same.) We can compare paths, particularly the “matched pairs”—i.e., those paths that are exactly the same in all respects except for the sequence of the first two pitches. In the list above, 1 and 2 are matched pairs, 3 and 4 are matched pairs, etc.
For those concerned about selection bias, I checked the AVG/OBP/SLG for hitters for each of these paths as well as the K%, BB%, and ERA for the pitchers. While these changed (slightly) from path to path, within each matched pair (e.g., BSX-SBX, BSBX-SBBX, etc.) there was a negligible difference between the quality of batters/hitters.
The best way to display the results is graphically:
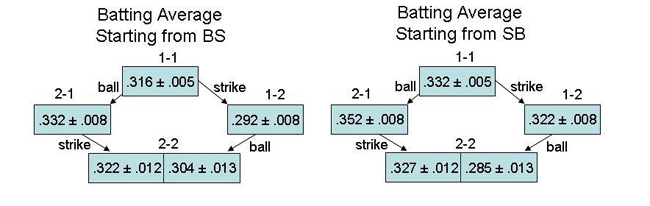
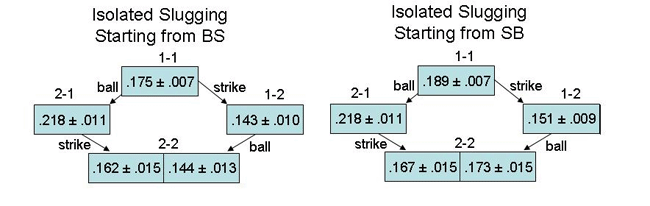
Each position on the diagram is the result of a path starting from a 1-1 count. The diagrams on the left are for the five paths starting from ball-strike on those on the right are for the five paths starting from strike-ball. Each box shows the AVG or ISO (as labeled) for balls in play in that particular path, as well as the uncertainty expressed as +/- one standard deviation. For example, batters hit .292/.142 (AVG/ISO) on 1-2 counts resulting from a pitch sequence of ball-strike-strike and .322/.151 (AVG/ISO) on 1-2 counts resulting from strike-ball-strike.
Because of the way the diagrams are arranged, any box in the lefthand picture corresponds exactly with the box in the same place in the righthand picture – same count and same pitch sequence – except for one important difference: the sequence of the first two pitches. This allows us to make controlled, direct comparisons to see if the sequence of first two pitches has a persistent effect as the plate appearance wears on.
Short-term and long-term memory
We’ll start with the 1-1 pitch being put into play. Batters hit for higher average and more power when the pitch sequence is strike-ball rather than ball-strike, which is exactly what we saw several months ago when we first looked at pitch sequences. This difference persists as we move forward one pitch; the batter hits better on both 2-1 and 1-2 counts when the the first two pitches arrive strike-ball. Our first observation is thus that the strike-ball sequence is more advantageous to hitters than ball-strike, and that this advantage persists for at least one pitch.
Less clear is what happens on the 2-2 pitch. Performance is almost exactly the same for ball-strike-ball-strike as for strike-ball-ball-strike. However, for the ball-strike-strike-ball sequence the hitter seems to do worse than for the strike-ball-strike-ball, which is a reversal of the first observation that hitters do better after strike-ball than ball-strike. Given the uncertainty in the numbers, it is difficult to say what this means—both AVG and ISO the difference is within one standard deviation. One interpretation—and our second observation—is that after two pitches, the memory of the sequence of the first two pitches has faded.
Indeed, if we take a look into the future and look at all the plate appearances that end three pitches or more after the 1-1 count, those that start strike-ball result in a .212/.342/.132 (AVG/OBP/ISO) line and those that start ball-strike result in .214/.348/.130—practically no difference at all. The memory of the first two pitches has completely evaporated after three additional pitches. This is our third observation.

As in life, it appears time heals all wounds, at least in the specific circumstances studied here. The sequence of balls and strikes does matter, and its effect persists for one or two pitches. More than just a few pitches later, however, the difference becomes small to the point of negligible, indicating that the effect does not persist as the plate appearances stretches longer. It would dishonest to generalize to all counts and paths based only this study, but consider this at least a hint that plate appearances, like the human beings who play baseball, have memory.
References & Resources
Per usual, I am obliged to thank Retrosheet for making all of this information available.
Also, I’m really, really sorry about the Andrew Lloyd Webber reference. That will never happen again.