The Effects of Pitch Sequencing
Trevor Bauer was one of the most “in the band” pitchers in 2013-14. (via Erik Daniel Drost)
Hitting a baseball — I’ve said it a thousand times — is the single most difficult thing to do in sport. – Ted Williams
Certainly if one of the best pure hitters in baseball history finds hitting a baseball the hardest athletic feat that he’s ever encountered, the rest of the world faces an even greater challenge when stepping into the batter’s box. Since the era where Williams was setting batting records, changes to the game may have even increased this level of difficulty. Specialized pitchers entering the game for shorter and shorter stretches of time along with training developments have led to higher pitch velocities across the league. MLBAM now classifies each pitch thrown into one of 13 different types, demonstrating the variety of looks that hitters in today’s game are required to negotiate.
The Wall Street Journal recently published an intriguing article describing a relatively new way that some teams have approached the task of improving pitch recognition for their hitters. The article describes a set of online interactive games developed by a Massachusetts-based company called NeuroScouting that are being used by at least three major league organizations as a tool to develop the connection within their batters’ brains between the visual inputs from a pitch en route and the decision-making process as to whether to attempt to swing.
One could certainly believe that accurately identifying a pitch on the way to plate plays a large role in how well hitters fare at restricting their swings to pitches inside the strike zone and how solid the contact is that they are able to make. The fact that the three organizations mentioned in the article (Red Sox, Cubs, Rays) are all well-regarded as far as sabermetric creativity and analysis go lends more credence to the potential of this technology to bear fruit in my mind.
You might even think that all exceptional hitters would carry the trait of being skilled observers of pitch spins. In fact we know that this is not the case from this interview with former major league pitcher Dave Baldwin:
I surveyed 15 former major-league position players and found that only eight could recall seeing the spin pattern. This could be due to visual differences or to differences in pattern processing in the brain. Coaches generally assume that the ability to see the spin pattern will make for a better hitter, but the success of a batter doesn’t seem to be related to his ability to recall seeing this pattern. For example, Frank Robinson has reported he was able to see the seam, but another Hall of Famer, Mike Schmidt, has said he was never able to see it (see Schmidt & Ellis, The Mike Schmidt Study: Hitting Theory, Skills and Technique. McGriff and Bell, Atlanta, 1994).
On the whole, there is some evidence that this type of skill development could be beneficial to hitters, along with evidence that this ability is not mandatory to hit at an elite level. Thanks to the availability of PITCHf/x data, we can dive in start to explore this concept.
Anatomy of a Pitch
A number of articles describe the timeline of a major league pitch from a hitter’s perspective, with the aforementioned Wall Street Journal piece being one of them. A 90 mph fastball takes roughly 400 milliseconds to travel between the pitcher’s release point and the front of home plate. Estimates of the point where a batter must commit to start swinging range from 150-225 milliseconds before the time the pitch crosses the plate. Once a swing has started, only elite hitters are able to make further swing adjustments to the path initially started at the go/no-go decision point.
For the purposes of this experiment, we can focus on the distance from home plate at which a hitter must commit to swinging. By this point in the pitch, the batter will have to have identified any spin, movement and velocity characteristics of the pitch that he can to make a decision on whether to take a cut. The distance from the plate where the decision point arises is also somewhat debatable, based on the source. The most comprehensive diagram of the anatomy of a pitch suggests the hitter must start to decide whether to swing, and what sort of swing path to take, when the pitch is around 21 feet from the pitcher’s release point.
This topic in general, I would suggest, is a subset of a larger interest of mine, something that Perry Husband has coined “pitch tunnels.” (The idea behind pitch tunnels is to “hide” different pitch types by having them share the same trajectory — or tunnel — for the first 20 feet out of the hand.) Trevor Bauer set up drills to work on the consistent look of his pitches at 20 feet from a pitcher’s release, for largely the same reasons that I’m hoping to investigate here.
In this study I will use 21 feet from a pitcher’s release as the point of interest for batter swing decisions. With the average pitcher having a 6 foot pitch extension, it leaves a point 33 feet from home plate that will be used for this study. Given that pitch velocities are climbing every year, it would follow that this decision point would be sliding out further away from hitters each season. I suspect whatever results I find would be pretty consistent regardless of the specific number chosen within the reasonable band of distances identified above.
With the help of Dr. Alan Nathan’s pitch trajectory calculator, we can estimate the position of all pitches at this defined decision point and begin to examine how pitch characteristics at this crucial time in the trajectory may affect batter performance.
Consecutive Pitches
An area of interest here for me is to consider the effect of back-to-back pitches from a pitcher to a hitter where each pitch is in a similar location at the swing decision point, but where the two pitches end up crossing the plane of home plate in quite different spots. In these cases, the batter would be required to gauge the speed and spin on the pitch by the point where his swing commences to distinguish the different swing paths that will be required to make contact with each pitch, if he should even attempt a swing at all.
To measure the impact of such a pitch sequence, I will look at swinging strike percentage (SwStr%). This metric indicates how often the second pitch in a two-pitch sequence is both swung on and missed as a percentage of all such pitches.

The first thing that I wanted to do was to get a feel for whether SwStr% appeared to be impacted by the relative position of the two pitches at the decision point. To do so, I constructed a simple matrix with the distance between the two pitches at the swing/no swing point down the side as rows, and the distance between the two pitches as they cross home plate across the top as columns. I’ve colored the cells using a heat map, and show the results from all such sequences in the regular season of both 2013 and 2014.
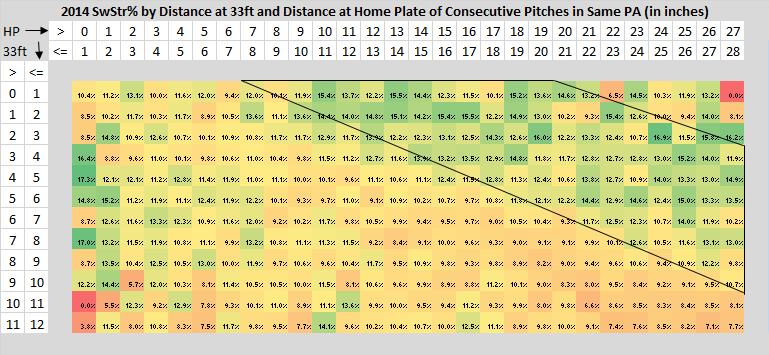
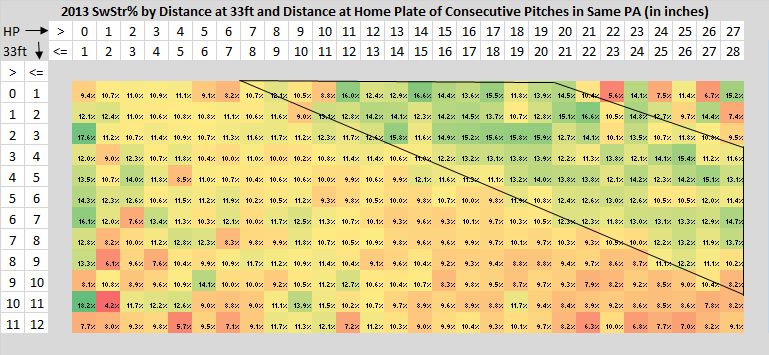
As an example of the way to interpret these images, consider the top row of either image. For a given season, this represents the SwStr% on the second of consecutive pitches where at the swing decision point the two pitches in the sequence were between zero and one 1 inch apart. As you move across the top row, it indicates an increasing distance between the two pitches when they arrived at home plate.
In both seasons I investigated, I identified a common band where SwStr% is notably high. I enclosed this band in black lines in the images. There is also a smattering of green cells down the left hand side of the images, showing that consecutive pitches that start out looking quite different but end up crossing home plate in the same location can also be quite effective. However the consistency of the band inside the black lines demonstrates the most reliable source of swings and misses.
The marked band describes consecutive pitches that are relatively close to one another when they reach the point in their trajectories where the hitter must decide whether to swing, but end up reaching home plate at quite different locations. It is valuable to note that the slopes of the two diagonal lines making up this band are not one. What this means is that the closer consecutive pitches are to one another at the swing decision point, the less distance apart they need to arrive at home plate to generate higher than normal swing and miss rates. This observation offers some support that there is value in making back-to-back pitches “look” the same as far as trajectory goes during the time the batter has to make a decision about whether to swing.
As you might imagine, for two pitches to overlap that far into a trajectory but end up crossing the plate in quite different locations, most of the pitch sequences that are captured within the marked band involve two different pitch types. In 2014, 87.7 percent of such sequences involved different pitch types, leaving just 12.3 percent for back-to-back pitches of the same type (as classified by MLBAM). The 10 most common of such sequences were in fact:
| Most Common In Band Pitch Sequences |
|---|
| First Pitch | Second Pitch |
| Four-seam Fastball | Slider |
| Slider | Four-seam Fastball |
| Two-seam Fastball | Slider |
| Slider | Two-seam Fastball |
| Four-seam Fastball | Curveball |
| Four-seam Fastball | Changeup |
| Changeup | Four-seam Fastball |
| Curveball | Four-seam Fastball |
| Sinker | Slider |
| Slider | Sinker |
However, by breaking down the data by pitch type, it is clear that all pitch types play up when they form the latter half of this type of pitch sequence.
| 2014 SwStr% on Second of Two Pitch Sequence Within Same PA |
|---|
| Pitch Type | In Band | Not In Band | Delta |
| KC | 14.30% | 10.50% | 3.80% |
| CU | 13.10% | 10.10% | 3.10% |
| SL | 16.50% | 13.80% | 2.70% |
| FS | 17.40% | 14.70% | 2.60% |
| FT | 8.50% | 6.00% | 2.50% |
| CH | 16.90% | 14.70% | 2.20% |
| SI | 8.00% | 6.00% | 2.00% |
| FC | 11.00% | 9.80% | 1.20% |
| FF | 9.20% | 8.00% | 1.20% |
| KN | 13.10% | 12.50% | 0.70% |
| FA | 11.60% | 11.30% | 0.30% |
Pitchers
In 2014, pitchers threw consecutive pitches that fell into the marked band 15.1 percent of the time. A relevant question here is how much of a skill this is for pitchers. To answer this I performed a linear regression for all pitchers who threw at least 150 of such sequences in each of 2013 and 2014.

So there is quite a strong relationship from year-to-year with respect to how often pitchers are able to throw two-pitch sequences that match the pattern described by the marked band in the earlier images.
Here are the qualified pitchers who have orchestrated such a pitch sequence the most frequently over the past two seasons combined.
| 2013 and 2014 Combined In Band% Pitching Leaders |
|---|
| Pitcher | In Band % | In Band SwStr% | Not In Band SwStr% | SwStr% Delta |
| R.A. Dickey | 24.40% | 12.70% | 10.50% | 2.20% |
| Jerome Williams | 21.20% | 12.20% | 8.00% | 4.10% |
| Hisashi Iwakuma | 21.20% | 14.10% | 9.60% | 4.50% |
| Ervin Santana | 20.60% | 13.90% | 10.60% | 3.30% |
| Johnny Cueto | 20.60% | 15.10% | 9.90% | 5.30% |
| Jose Quintana | 20.50% | 9.80% | 8.30% | 1.50% |
| Cole Hamels | 20.20% | 17.30% | 11.30% | 6.00% |
| Erasmo Ramirez | 20.20% | 14.30% | 10.40% | 3.90% |
| Jon Lester | 19.30% | 13.00% | 8.70% | 4.30% |
| Mark Buehrle | 19.20% | 7.80% | 7.20% | 0.60% |
Once again the knuckleball shows how much of an outlier it is, with R.A. Dickey amazingly the overall leader by a wide margin despite mostly throwing a single pitch type. Most of the others on the list are known for a knockout secondary pitch, and here we can see how those pitches play up when used in this type of sequence with the previous pitch in the plate appearance.
While he didn’t qualify due to a lack of pitches thrown in 2013, Trevor Bauer hit the band a solid 18.6 percent % of the time in 2014, a full standard deviation above the mean across all pitchers. This is the sort of result I had expected given the reports of his training using pitch tunnels.
Using the same set of qualified pitchers, I ran linear regressions to see how repeatable SwStr% was year-over-year both in general and within this defined band. The results are not overwhelming, with an R-squared of 0.38 for all non-first pitches of plate appearances in general, and just 0.24 for second pitches in sequences in the band.
Checking in on which pitchers gained the most in generating swings and misses by producing these types of pitch sequences, we get the following leaderboard for 2013 and 2014 combined.
| 2013 and 2014 Combined In Band SwStr% Delta Pitching Leaders |
|---|
| Pitcher | In Band % | In Band SwStr% | Not In Band SwStr% | SwStr% Delta |
| Justin Masterson | 13.9% | 17.7% | 9.5% | 8.2% |
| Tom Koehler | 11.3% | 15.3% | 7.8% | 7.6% |
| Alex Cobb | 15.2% | 16.6% | 9.2% | 7.4% |
| Dillon Gee | 17.9% | 15.1% | 8.6% | 6.5% |
| Gerrit Cole | 13.3% | 15.5% | 9.3% | 6.2% |
| Cole Hamels | 20.2% | 17.3% | 11.3% | 6.0% |
| Matt Garza | 16.4% | 13.9% | 8.1% | 5.8% |
| Homer Bailey | 16.9% | 16.7% | 11.0% | 5.8% |
| Johnny Cueto | 20.6% | 15.1% | 9.9% | 5.3% |
| David Price | 11.7% | 14.9% | 9.8% | 5.2% |
Elite starters Cole Hamels and Johnny Cueto beautifully combine a high percentage of pitch sequences of this kind with an elevated swinging strike rate bump when doing so. Teams considering signing free agent Justin Masterson may wish to work on some pitch tunnel exercises with him to push more of his sinker-slider sequences into this band. When he has done so his SwStr% has jumped dramatically.
Batters
For hitters, SwStr% performance looks to be much more of a repeatable skill than for pitchers. Taking all batters who saw at least 150 pitch sequences captured in the band in both 2013 and 2014, a linear regression showed an R-squared of 0.80 for all non-first pitches of plate appearances in general and 0.48 for second pitches of sequences in this band.
Here are the qualified hitters who have faced the most two-pitch sequences as described by the band marked in black over the past two seasons.
| 2013 and 2014 Combined In Band% Batting Leaders |
|---|
| Batter | In Band % | In Band SwStr% | Not In Band SwStr% | SwStr% Delta |
| Raul Ibanez | 16.60% | 13.30% | 12.40% | 0.90% |
| Josh Donaldson | 16.60% | 9.70% | 9.70% | 0.10% |
| Matt Joyce | 16.60% | 11.70% | 10.60% | 1.20% |
| Billy Butler | 16.50% | 10.20% | 7.50% | 2.70% |
| Aaron Hill | 16.50% | 8.90% | 7.50% | 1.40% |
| Chris Carter | 16.50% | 19.10% | 16.40% | 2.70% |
| Alex Rios | 16.40% | 10.00% | 7.60% | 2.40% |
| Yoenis Cespedes | 16.30% | 12.30% | 12.80% | -0.40% |
| Alexei Ramirez | 16.30% | 10.70% | 6.80% | 3.80% |
| Evan Longoria | 16.20% | 12.70% | 10.40% | 2.30% |
The spread among In Band% among hitters is much tighter than for pitchers. The players on this leaderboard all saw these sequences about two standard deviations above the mean of the population. We can see some of these hitters, like Josh Donaldson and Yoenis Cespedes, have been able to handle this type of pitch sequence as well as any others that they have faced. At the other extreme of In Band% we find free agent Pablo Sandoval at just 12.4 percent of sequences. It seems Sandoval and his unusual hitting approach is always at the top or bottom of every list related to swinging percentages.
To complete the picture, here are the qualified batters who have experienced the most difficulty making contact when consecutive pitches form our identified pattern.
| 2013 and 2014 Combined In Band SwStr% Delta Batting Leaders |
|---|
| Batter | In Band % | In Band SwStr% | Not In Band SwStr% | SwStr% Delta |
| Adam Jones | 15.60% | 19.30% | 13.00% | 6.30% |
| Alex Avila | 13.80% | 18.90% | 12.60% | 6.20% |
| Brandon Crawford | 13.10% | 16.70% | 10.60% | 6.10% |
| Omar Infante | 14.50% | 12.10% | 6.40% | 5.70% |
| Jason Castro | 15.10% | 17.30% | 11.90% | 5.40% |
| Ichiro Suzuki | 14.70% | 11.60% | 6.70% | 4.90% |
| Torii Hunter | 15.50% | 16.90% | 11.90% | 4.90% |
| Mike Moustakas | 14.10% | 12.30% | 7.50% | 4.80% |
| Chris Davis | 13.80% | 18.80% | 14.10% | 4.70% |
| Austin Jackson | 15.40% | 13.00% | 8.30% | 4.70% |
| Matt Dominguez | 14.10% | 12.80% | 8.10% | 4.70% |
| Zack Cozart | 13.60% | 12.20% | 7.50% | 4.60% |
| Giancarlo Stanton | 15.00% | 17.90% | 13.30% | 4.60% |
| Martin Prado | 15.80% | 8.30% | 3.70% | 4.60% |
| Daniel Murphy | 13.90% | 9.80% | 5.20% | 4.60% |
While making contact on the second of two pitches in our marked sequence is not incredibly consistent year-to-year, our linear regression told us that about half of the variation of a player’s In Band SwStr% in 2014 could be explained by his In Band SwStr% in 2013. I would suggest that this is not an insignificant amount, and that these players would be good candidates to assess as to whether one or more of the interactive simulation games described in the introduction of this article could be used to improve pitch recognition performance. I would find it fascinating to ask these players whether, like Mike Schmidt, they admit to not picking up much spin on incoming pitches.
There are some interesting names on this list, from high swing-and-miss power hitters like Adam Jones, Chris Davis and Giancarlo Stanton to contact specialist Martin Prado, whose SwStr% more than doubles when facing this kind of pitch sequence.
At the other extreme, Carlos Beltran is one of just 4 percent of qualified hitters to actually improve his SwStr% on In Band sequences, with a SwStr% Delta of -1.4%.
Conclusions
Through this study I’ve convinced myself that there is value for pitchers in being able to throw back-to-back pitches of different types that have almost identical trajectories during the initial stage of flight up to the point where the batter must make a decision of whether to commit to a swing. In both seasons studied, consecutive pitches that were close to overlapping at the swing commit point but that crossed the plate in relatively different spots generated consistently higher rates of swings and misses. In addition, the closer consecutive pitches in a plate appearance are to overlapping at the swing commit point of the trajectory, the closer they can be as they arrive to home plate and still generate these additional swings and misses.
Pitchers appear to have a significant amount of control over how often they throw two-pitch sequences that meet these criteria. Unfortunately, they do not appear to wield much control over the SwStr% achieved when doing so. Nevertheless as a general practice it would appear to lead to better SwStr% results than other two-pitch strategies when viewed from this perspective.
Hitters appear to demonstrate a moderate amount of control over their ability to make contact on the second pitch of two-pitch sequences that meet the criteria. Nearly all hitters perform worse on these pitch sequences than the mutually exclusive set of two-pitch sequences.
I’m curious about exploring this topic further, beyond two-pitch sequences within the same plate appearance. For example, I would be interested in knowing if pitchers with tighter pitch clustering across their entire arsenals at the swing commit point achieve higher strikeout rates and/or lower BABIP against.
If you have thoughts about the work presented here or ideas about directions to take this line of research, please leave them in the comments below.
References & Resources
- Alan Nathan’s Trajectory Calculator
- Baseball Heat Maps PITCHf/x Database
- Brian Costa, Wall St. Journal, “Baseball’s Science Experiment”
- David Laurila, Baseball Prospectus, “Prospectus Q&A: Dave Baldwin”
- Jay Kolster, EricKressey.com, “Troubleshooting Baseball Hitting: Timing is Not Always the Problem”
- Brian Oates, Oates Specialties, “Trevor Bauer and Pitch Trajectory Drills: Select Conditioning Accessories”
- Clint Longenecker, Baseball America, “Giles, Bryant Top AFL TrackMan Leaderboards”
Very compelling results. I suspect you may strengthen your findings if you control for other pitch characteristics. Not all pitches of the same type yield the same results, even from the same pitcher. My linked work ws utilizes some of the control techniques I’d recommend.
http://www.fangraphs.com/community/babipfx-a-predictive-pitch-based-model/
Great work!
Bit convoluted, but in reference to this comment (http://www.fangraphs.com/community/babipfx-a-predictive-pitch-based-model/#comment-308040), I am happy to put a set of eyes on your work. Will help me learn more about statistical research (basic regression is about as far as I go now). If you’re interested, send me an email.
And Jon, always enjoy your work — used your called strike zone article just last month to good effect, I think, in looking at what the Nats did in 2014.
Thanks for the comment. I remember your article, that’s some fantastic work.
You’re right there is definitely much more that can be done here, and controlling for pitch characteristics would certainly be a good start in one direction. For example I only looked at relative positioning of back-to-back pitches here, I did not even consider absolute location, let alone velocity, pitch type, etc.
Just waived Bauer off my fantasy team. As far as those “tunnels” go, it’s like crossing yourself at the plate. It helps, as long as you can hit.
Nice work.
In regards to tight pitch clustering, it would be great if you could analyze Petit’s pitching performance from this year. I think he’d make a very interesting subject since he does appear to “cluster” his whole arsenal, which might partially explain how his pitches have played up despite having a low-velocity fastball.
On a side note, Petit does seem to effectively mix his pitches well (FB% right around 50% versus his breaking and offspeed offerings); perhaps there is some correlation between tight pitch clustering + effective pitch mixing that helps to indicate talent/performance.
Great observation. I’ve been looking at pitch clustering in a few different ways since writing this article, and Petit is always near the top. Dallas Keuchel is another guy who was elite in this regard in 2014 and had a breakout season.
I think you’re right though that there is more to the equation than simply achieving tight clustering across pitch types to be successful. Some elite pitchers do not cluster well at all, at least from the perspectives that I’ve taken to date.
Interesting stuff.
This is a general note not specific to this article, but articles like this always send me running to the pitch-type abbreviations page (http://www.fangraphs.com/library/pitch-type-abbreviations-classifications/). Maybe it’s just me, but I can never remember the various fastball combinations and it’d be handy to have a link when they’re referenced.
Really awesome work. Other effects I’d like to see – what is the take rate and strike% on pitches way outside of band/tunnel? Are pitches that are close in tunnel on subsequent trials see higher swing rates than ones that do not?
Hope to work together. Have some really cool in vivo data using VR technology and actual studies of hitters.
Excellent Jon – im working on “clustering”/Release Point Consistency if you have something in mind. I read this and thought about reaching out to you. I have a RP Consistency Leaderboard. Petit for example does wind up in the top 30 for average within-game release consistency; top 70 game-to-game consistency. I have most pitchers in my leaderboard as well as the effect on their overall outcomes, but would love to get at the effect on your SwStr% differential outcome!
…Makes me interested in your SwStr% differential within the leaderboard “bands” to see what effect their Release Consistency has between the two pitches (but then we need to drag out the velocity and movement differential somehow).
Let’s connect? rotobanter at gmail: @Rotobanter. Include Eno as i’d like to keep him in the loop.
I’d be very interested in research being one to find out if a catcher can get credit for pitch sequence. It coul make a big difference if one catcher is better at calling a pitch than another. This is a very hard thing to measure, particularly because the pitcher has a say too. But if we can calculate it to some extent, Catchers can have even more value than we think today. An entire pitching staff can become better (slightly).
I feel that this is a very important part of baseball that, while extremely hard to measure, may be worth it.
Keep in mind, pitch calls can also come from the bench.
Great stuff. I see everyone wants to work with you to further explore these findings. I’m interested in the fantasy baseball side of things. How can I build a data set for in-band, out-of-band? My thought is that it could help identify which relative unknowns have a better chance at sticking. As an example, if I’m trying to decide between Chase Anderson and Nick Tropeano, it would be nice to know if one of them has a much higher in-band rate. It seems that would be a point in their favor.
Presumably batters have a longer time to decide against Dickey. It does seem to matter quite a bit whether Dickey is throwing his knuckler at 74mph or 78mph.
When we talk about swings & misses, there are numerous factors.Certainly overlapping ball flight is one very important factor. However, overall “stuff”(velocity/movement), speed spreads, & delivery deception also need to be factored in. When hitters swing & miss, they are either early or late. It would be interesting if you could quantify the most significant factors for those swings & misses.
JW
Great analysis that ties directly to the Occlusion method sport scientists have developed to test and train Pitch Recognition, as shown in my talk at 2012 MIT/Sloan Sports Analytics Conference titled The Sixth Tool: Training Baseball Pitch Recognition. My eBook of the same name includes Combo Pitch charts matching your analysis. The book also has video of a Net Occlusion Drill with a coach throwing pitches into a net 10 feet away and batter judging pitch type/location. Coach Weintsein has a similar drill Jerry Drill on his site.
Your article shows the potential in combining analytics and occlusion methods for talent ID and development. Good work.
Great analysis that ties directly to the Occlusion method sport scientists have developed to test and train Pitch Recognition, as shown in my talk at 2012 MIT/Sloan Sports Analytics Conference titled The Sixth Tool: Training Baseball Pitch Recognition. My eBook of the same name includes Combo Pitch charts matching your analysis. The book also has video of a Net Occlusion Drill with a coach throwing pitches into a net 10 feet away and the batter judging pitch type. Coach Weintsein has a similar Jerry Drill on his YouTube site.
Your analysis is the first I’ve seen to show potential in combine analytics and occlusion methods for talent ID and development.
I’m curious about the interactions between this research and scouting reports. For example, can we identify a correlation between repetition of delivery/release point and some of the pitchers taking advantage of this pitch-tunnel consistency. Can we, through scouting, identify pitchers who might have a better chance at success based on such a correlation? This might match up with a more nuanced dissection of pitch characteristics within a certain pitch type, helping us see if we can predict a pitcher’s ability to take advantage of pitch-tunnel consistency. Since you’ve provided tables looking at some of the most frequent and most benefitting pitchers this could also be easily done, at least on a basic level.
An interesting approach, but I think flawed because the pitch calling is actually a function of the catcher.
It would be more instructive to further refine data with respect to catchers – since it is far more likely pitch sequencing is performed by catchers (with their own preferences) rather than the throwers who actually release the pitches. The catchers also control – to significant extent – the path of the pitch by their positioning of desired pitch location.
Combo pitches don’t need to be back-to-back to be effective. Barry Zito succeeded for years throwing a first pitch curveball or high fastball, neither of which was particularly hittable, and then getting the batter out on a 2-strike combo pitch. If the batter had swung at, or taken, the high fastball earlier then he’d be likely to take the two-strike curve that starts in a similar tunnel (or plane, or slot). Conversely, if he either took or swung at a first-pitch curve then he’s particularly susceptible to the opposite combo pitch — whether it is the next pitch or later in the sequence. RE Bono comment, I agree on value for scouting of upcoming opponent or prospects.
As a hitting coach, this data and the data in Jon’s article on the expanding strike zone (sz) begs the question, what was the result of the “at bat” of the pitch or pitches involved.
For ex., How many of the out of sz pitches resulted in a strike out (so), or was part of a so; or an out or a hit, ie batting ave. (ba) of these pitches that were out of the sz and were hit; conversely, number of outs and type of out fly out, ground put or line drive out, etc. Also how many pitches in the sz that were taken resulted in a so or hit; the ba of the ab pitches taken in the sz; or still resulted in a hit or walk, etc.