The ‘Little Things’

Michael Cuddyer and the Rockies outhit the Dodgers on Sept. 27, but they didn’t do the little things as well. (via Keith Allison)
In 1991, I was fortunate enough to be part of a very special college baseball team. We were the Cal State Northridge (aka “Cal State Nowhere”) Matadors. The previous year, we were a Division II team, but by the end of the ’91 season we were (maybe still are) the only team in NCAA history in any sport to finish ranked in the top 10 of Division I schools the first year playing at that level.
In May of that year, we were in Fresno for the NCAA Division I Western Regionals. There was no Super Regional back then. You played a double-elimination tournament with six teams, and whoever came out of that alive was going to Omaha for the College World Series.
As you might have guessed, we were not a typical club. Our entire roster was 19 guys. We had a three-man starting rotation, and we led the country in complete games. You started the game, you finished it. So, in a double-elimination tournament that lasted four days, we knew we were going to have to do some pitching on short rest.
After losing our first game, the road map to Omaha looked like this:
- Beat Miami (led by Charles Johnson, Jorge Fabregas, and company)
- Beat Portland University
- Win two games on Sunday against either Stanford or Fresno State (whoever came out of the winner’s bracket).
I got to pitch the game against Miami on a Friday. Fortunately, we scored 13 runs that day and were able to keep going. We then defeated Portland on Saturday, and the stage was set – a Sunday doubleheader against Fresno State for a chance to play in Omaha. Our Game One starter, Craig Clayton, pitched a complete game on two days’ rest and we defeated Fresno in Game One. I would pitch Game Two on a single day of rest, and if you’re still reading this (thank you), this is where The Little Things come in.
It’s the bottom of the ninth inning of Game Two and somehow, by the grace of God, we’re ahead 5-4, and I am still pitching. Three outs to go. The sun is starting to set just over the first base side of the Fresno State grandstands. That was actually significant because Little Thing No. 1 that inning was when Fresno’s first batter hit a high one-hop ground ball to third base. Easy play. We were about to begin this inning with a leadoff out, and that was huge. I looked back to our third baseman, who was shielding his eyes as best he could, but was absolutely blinded by the sun. He fell to a knee and dropped the ball. It was a sun-aided base hit.
Runner on first, no outs. I am still kicking myself over Little Thing No. 2 to this day. It was a walk to a hitter trying to bunt.
First and second, no outs. The Bulldogs’ next hitter is bunting. Our first baseman charged hard and had a play on the lead runner at third base, but the throw was wide and we couldn’t get the force out. Little Thing No. 3 is an “E-3.”
Bases loaded, no outs. We have allowed three baserunners without a base hit. I don’t remember much about the pitch that ended the game, but I do remember coming inches shy of fielding it as it was grounded just past me and into center field. Two runs scored, and our dream was crushed.
My Northridge teammates, coaches and I were trying to find some meaning in all of this. I left out many of the details surrounding how hard we had worked, how well we were coached, and so on — that’s another story in itself. There must have been a reason for it to end with the complete heartache we all had that day in Fresno. We all would have preferred the Cinderella story, but none of us would trade the experience of being on that team for anything in the world. So, that is probably the biggest life lesson we learned from it – a championship is not required to prove greatness.
But there was a baseball lesson in it, too. Everything matters. The game is not just hits and outs. There are many other factors involved in who wins and who loses – most within your control, and some not within your control at all.
At Inside Edge, we track every nuance of the game, and we do so very meticulously. The experience I just mentioned helped us develop a new report – one that would measure the fundamental soundness of a club by summing and organizing “The Little Things” — which, when combined with each other, sometimes become very big things.
Box scores help us recall who went 2-for-4 and who struck out 10 batters. But what about that great diving play by the third baseman in the fifth inning? What about that terrible call on the bases that wasn’t overturned? Or, how about the wild pitches, passed balls, balks, fielding errors, lucky hops, bad baserunning plays, good baserunning plays and everything else that contributed to the game’s outcome that wasn’t a base hit or routine out?
Let’s take a closer look at how all of those “Little Things” affect the game using an actual game from Sept. 27 to illustrate. This is what the scoreboard tells us:

| Rockies vs. Dodgers, 9/27/14 |
|---|
| Team | R | H | E |
| COL | 5 | 12 | 1 |
| LAD | 6 | 11 | 0 |
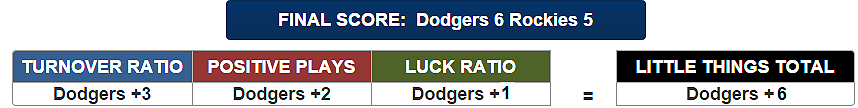
In this game, the Rockies out-hit the Dodgers 12 to 11, and they had 21 total bases from hits compared to the Dodgers’ 17. But, the Rockies did not win the game. In terms of Little Things, the Dodgers won that battle 14 to 8. This is the high-level summary of the game from our LT Report:
You may be thinking: “Turnover ratio? Positive plays? Luck? What are these new metrics? You’re really attempting to measure these things?” Well, why not? Let’s unfold a few layers here and see what you think.
Turnover Ratio
In sports like football and basketball, turnover ratio is a common statistic. It’s easy to calculate because there are very few ways to give something away to your opponent – basically fumbles, interceptions, and penalties in football; steals, defensive rebounds, and fouls in basketball. It’s a pretty important number, though. In football, the team that wins the turnover battle wins the game 79 percent of the time.
In baseball, there are 11 ways to give something away. Before we discuss them, we should clarify that the term “turnover ratio” isn’t literally applicable to baseball in the way that it applies to other sports, where a giveaway means you turned the ball over. We’re using turnover ratio simply because it sounds better than “mistakes/giveaways ratio.” Here are the 11 giveaways we mentioned:
- Walk
- Wild pitch
- Hit by pitch
- Balk
- Error
- Fielders choice without an out
- Passed ball
- Poor play (not an error)
- Caught stealing (offense)
- Runner picked off (offense)
- Baserunning mistake (not pickoff or caught stealing)
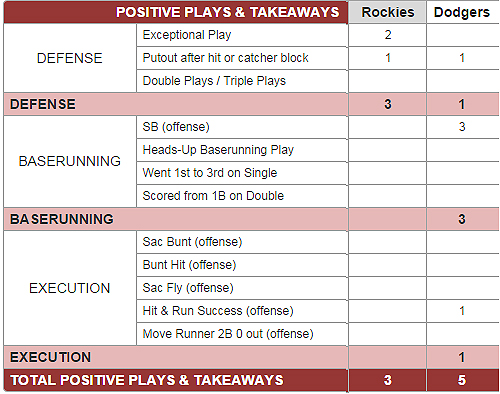
All of these things result in a free base, a free out or both (in the case of reach on error). Notice the ordering of these plays. You can put the first four in the pitching category, the next four fall under defense and the last three are in the baserunning category. Here is that Rockies-Dodgers game again to illustrate how the turnover ratio worked out to Dodgers +3:

Positive plays
Teams also have many ways to gain an extra base on offense, and they can take away a base or earn an extra out on defense. Here are 12 of them:
- Exceptional play
- Putout after hit or catcher block
- Double- and triple plays
- Stolen base (offense)
- Heads-up baserunning play
- Went first-to-third on single
- Scored from first on double
- Sacrifice bunt (offense)
- Bunt hit (offense)
- Sacrifice fly (offense)
- Hit and run success (offense)
- Move runner two bases without an out (offense)
In our sample game, the Dodgers had five positive plays, while the Rockies had two, resulting in a +2 for the Dodgers.
Luck
Luck is an uncontrollable element that impacts one team inversely from its opponent. Good luck for one team is bad luck for the other. The following six events fall into the luck category:
- Hard-hit out
- Cheap hit
- Called strike three out of zone
- Called ball four in zone
- Bad base ump call favoring
- Other intangibles favoring
Where “other” includes the following:
- Ball hit someone or something,, affecting result of the play
- Broken bat interfered with fielder’s ability to make play
- Extreme wind or other elements affected the play
- Fan interference took away or added a base
- Fielder fell down or was injured allowing runner advance
- Fielder lost ball in sun, lights or stadium background
- Missed sign by hitter or runner caused out
In our sample game, the Dodgers had a hard-hit out (Andre Ethier scorched a ball to the first baseman for a 3-6 fielder’s choice). That was the only luck event in the Rockies’ favor that day. The Dodgers had a weakly hit (cheap) single by A.J. Ellis, and Dodgers starting pitcher Dan Haren received a generous strike three call on a pitch off the outside part of the plate. The net result is Dodgers +1 in the luck category.

Note: It may look like a calculation error, but the totals are calculated in terms of luck in the team’s favor. The hard-out by the Dodgers benefited the Rockies. So, what looks like it should be a total of zero on the left and three on the right, is really one on the left and two on the right. The graphic is correct.
When you put it all together, the Little Things ratio ended up Dodgers +6, calculated simply this way:
Now that we’ve explained the report on a single-game basis, let’s look at some full-season data from 2014. We’re going to do this in a question/answer format, starting with five questions we had (and that we’re guessing you might have as well). Please use the comments section to suggest more studies you’d like to see, and we’ll do our best to post the results either on our metrics site or our Twitter page.
Question No. 1
How often does the team win when it has have more Little Things in its favor than the opponent?
| Answer to Question 1: 70 percent of the time |
|---|
| LT Ratio | W | L | Win Pct |
| +1 | 191 | 157 | 54.9% |
| +2 | 218 | 132 | 62.3% |
| +3 | 190 | 111 | 63.1% |
| +4 or more | 965 | 270 | 78.1% |
| Total | 1564 | 670 | 70.0% |
Note: There were 196 games in which the Little Things ratio was a tie. Those games are excluded.
Question No. 2
What about each component of the Little Things broken down that same way?
| Answer 2A: Turnover Ratio Winner wins game 65% of time |
|---|
| Turnover Ratio | W | L | Win Pct |
| +1 | 303 | 261 | 53.7% |
| +2 | 273 | 195 | 58.3% |
| +3 | 261 | 124 | 67.8% |
| +4 or more | 571 | 180 | 76.0% |
| Total | 1407 | 761 | 64.9% |
Note: There were 262 games in which the turnover ratio was a tie. Those games are excluded.
| Answer 2B: Positive Play Ratio Winner wins game 66% of time |
|---|
| Positive Play Ratio | W | L | Win Pct |
| +1 | 405 | 274 | 59.6% |
| +2 | 338 | 214 | 61.2% |
| +3 | 278 | 126 | 68.8% |
| +4 or more | 357 | 99 | 78.3% |
| Total | 1,378 | 713 | 65.9% |
Note: There were 339 games in which the positive play ratio was a tie. Those games are excluded.
| Answer 2C: Luck Ratio Winner wins game 55% of time |
|---|
| Luck Ratio | W | L | Win Pct |
| +1 | 474 | 401 | 54.2% |
| +2 | 291 | 262 | 52.6% |
| +3 | 148 | 125 | 54.2% |
| +4 or more | 141 | 59 | 70.5% |
| Total | 1,054 | 847 | 55.4% |
Note: There were 529 games in which the luck ratio was a tie. Those games are excluded.
Question No. 3
How often does the team with the higher net total bases from hits win the game? For example, if Team A has 15 total bases from its hits, and allows 12 total bases from its hits, how often does Team A win?
| Answer 3: 82% |
|---|
| TB from Hits Ratio | W | L | Win Pct |
| +1 | 135 | 114 | 54.2% |
| +2 | 150 | 84 | 64.1% |
| +3 | 168 | 63 | 72.7% |
| +4 or more | 1426 | 149 | 90.5% |
| Total | 1879 | 410 | 82.1% |
Note: There were 141 games in which the total bases from hits ratio was a tie. Those games are excluded.
Question No. 4
If a team wins all three elements of the Little Things (turnover ratio, positive play ratio and luck ratio), how often does it win the game?
Answer: 81 percent. This happened 367 times in 2014.
Question No. 5
Who led the league in the Little Things ratio this season?
Answer: The Washington Nationals. Despite being one of the unluckiest clubs, the Nationals led the league with 1.6 Little Things in their favor per game. All numbers are on a per game basis.
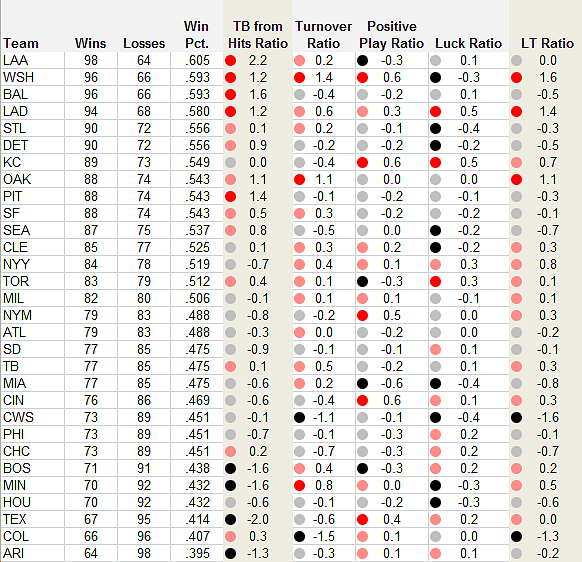
2014 Game Averages (Sorted by winning percentage)
Other observations from the above graphic:
- A team’s ability to hit and prevent hits (in tandem) is the most important component to winning. The better teams in the league get it done at the plate and on the mound. The Angels, Orioles, Pirates and Tigers are examples of clubs whose deficiencies in the Little Things department were overcome by their ability to hit and not allow hits.
- However, you can’t always get by on hitting and pitching alone. The Mariners are an example of this. They posted +8 total bases from hits, yet fell short of the playoffs, perhaps due to their fifth-worst ranking in the Little Things (-0.7 per game). The Cubs and Rockies both posted positive total bases from hits ratios, but were near the bottom of the league in Little Things.
- The Royals are the Little Things poster team. They broke even on the total bases gained and allowed from hits. They ranked fifth in the league in LITTLE Things ratio with +0.7 per game. They were also tied for the luckiest team this season.
For more information, please visit our website and/or follow us on Twitter. We have been posting the results from every 2014 postseason game, and will continue to do so through the end of the World Series.
How about instead of counting these as 1 each, use the change in run expectancy from the event?
Should you be including the unintentional walks that are really “pitching around the hitter”?
Counting sacrifice bunts as positive plays seems to counter the argument that you shouldn’t bunt.
Can we get these totals by individual player? That would be really cool.
Overall, I think this has potential to be a useful addition to the boxscore.
This is a really interesting concept Kenny, and to see it quantified is great. It’s nice to have a metric that might explain why a team outperforms/underperforms expectations without a clear solution (injuries, breakout performances, sharp declines…). In that sense, Little Things are good for looking at full-season samples. But it also gives potential for great narratives for single games, even if it isn’t statistically viable.
That being said, the AL Wild Card game looks even more interesting now. Oakland won the Total Bases from hits, but only by 1. KC won the Little Things by 13! So with the TB’s being a near wash and the Little Things being a huge advantage for KC – what explanation should we give to why the game was so close? I would think that sequencing would be the answer. Do you agree or are there other factors still? Thanks.
Thank you, Slavin33. Really glad you see the value in the Little Things on a single-game and season-long basis. We agree wholeheartedly, of course. And, yes, I think knowing the TB from Hits difference and Little Things difference gets us 2/3’s of the way to explaining why a team won or lost. The third ingredient is the timeliness of the events. We’ll be incorporating RE and WPA as mentioned in the other comments.
Thank you for your feedback, David. We are doing the research using RE and WPA for these events as we speak. Should have something to share very soon. Certain plays require dividing the RE/WPA up (i.e. Single+Error or a BB+WP, etc.), which complicates things a bit, but we’re close to nailing that stuff down.
We’re including walks that may be “pitch around” walks because they still fall into the category of a give-away. Probably should even count the IBB’s, too, I suppose. Curious what you and others here think about that.
I expected we’d hear something about the bunts counting as positive plays since the RE and WPA can decrease on those events, but two reasons we stuck them in there: 1) frankly, we weren’t sure where else to put them — they do gain a base, albeit at the expense of an out. 2) we feel like managers will utilize this report, and most of them will consider the bunts as positive plays (since they’re the ones putting the bunt on).
Individual player totals is definitely on our list of offseason projects.
Thanks again!
Great story and very well depicted. I remember catching you and Clayton up in the bull pen that day in Fresno. Your guys stuff was electric and the amount of energy we all had was fantastic. We had that game and that tourney, and I still believe to this day we were indeed the better team, however it was the “little things” that got us. Now as a coach, I really appreciate the thought process and extreme amount of research for these stats. It is unbelievable on how true these studies are. Positive plays, the luck factor and all the ratios are simply incredible to analyze and understand how right you are. Thanks for sharing this with me and I look forward to seeing you soon.
Thanks a lot, Tony!
Very interesting article. My only concern is that a stolen base gets the same point than a good play and a wild pitch, etc. Could this same research be done using a run expectancy model with each outcome? This could become a major breakthrough in baseball!
Thank you, Tess. Yes, we are working on incorporating RE and WPA for each event.
Interesting new metrics, Kenny. Your work is impressive. And I would be remiss if I didn’t also comment on that 1991 Cal State Northridge baseball team, the toughest group of competitors I’ve ever been around. Just covering that team as a reporter, I learned a tremendous amount that helped me in coaching my sons — who turned out to be a couple of tough competitors in their own right. Only a combination of negative metrics could sink that CSUN team. I remember watching the warm-ups before that Miami game. The Hurricanes had a tremendous collection of talent and were very impressive. Then the game started and the hard-nosed baseball players took over. You guys were a pleasure to watch.
Thank you very much for the kind words, Mike. You’ve been around many teams over the years with the Times, so that is saying a lot. It was quite a group, made many times stronger by Coach Kernen. Amazing how many of us later went on to become coaches, or at least coach sons and daughters as in your case.
There still is no metric for what that team had — determination and guts are intangibles that can’t really be measured.
Kenny,
Very nice…wish you, Steve, etal had been ready to do this back when we were doing BBBA.
A couple of thoughts:
1) Could you look at the “ties” in the LT score and see what results you get when there are differences in the subcomponent areas? Are there any of those three areas that seem to have a greater correlation vis-a-vis winning?
2) Can you also isolate these plays/occurrences by base-out situation or by conventional “clutch” situations? It would be useful to see a distribution chart of when plays related to “little things” occur, if only to help corroborate (and possibly refine) the overall score you’re attempting to quantify.
3) Do you have plans to mine all of the existing PBP data from the past and make it available?
All best,
DM
Thank you for the suggested future studies here, Don. Hoping we can research those during the offseason and post results either here in the comments or in a future article if THT allows.
Thanks again!
Kenny
Little Things should include an exact count of Batter’s ability to move the Runners on Base as a Run.
Watching Jose Altuve’s stats, he had so many doubles and steals yet his Total Runs and RBI’s suffered with batters before and after him not able to “get a hit”.
Compare Altuve’s run production with Ichiro Suzuki’s career numbers of over 200 hits with LOW rbi production –
Both should have increased their WAR with better hitters and their team’s wins.
Specifically, How a Batter moves the runner “ahead” with “1 out” and with “2 outs” in the At Bat.
This would add to the “Adam Dunn” effect of THT previous article.
All those strikeouts that the Astros’ suffered clearly cost them 10 more wins in this surprising rebuilding year.
And those next batters more money in their pockets, for rbi’s.
Sure, there was Chris Carter with 37 HRs, yet his doubles’ production was sub par compared to the other top 12 HR AL leaders. Carter gave up 20 or rbi’s by swinging for the fence every swing. Maybe worth $5 mill per year.
Fascinating article Kenny. Thanks for posting.
Just watching the Royals – Giants WS games gives you an appreciation for this stuff, which is typically lacking in a midseason game of oh…. say the Cubs vs Marlins.
I notice that some of your “Little Things” variables are objective and measurable from scoresheets, and some are judgment calls (e.g. Cheap Hit). The former lends itself well to large data dumps and analysis, whereas the latter does not.
As some of the other posters above have suggested, it might be nice to strip out the subjective elements, and subject the remainder to run expectancy measures (as opposed to 1 point each) and see how this type of approach correlates to team success over many years.
Thank you, Mr. Putin. We can try stripping out the subjective and see what happens. The subjective info does give us a more complete picture, but it will still be interesting to analyze each team from an objective-data-only perspective with RE. We’ll look into it.
The problem with your criteria under “luck” is that, if you stop to think about it long enough, EVERYTHING in baseball probably happens due to luck. Luck or physics.*
Nobody ever says of a player who just hit a 500-foot home run, “He just got lucky.” But we all know the difference between a 500-foot homer and a mile-high popup, the difference between a screamer in the gap and a grounder to short, the difference between ticking a ball foul to stay alive and swinging through strike three is mere fractions of an inch, a hair one way or the other.
Or let’s take “hard-hit out,” to use one from your list. Batter hits a screamer right at the left fielder, who is, as they say, playing perfectly. “Ooo, bad luck!” you say, if you’re a fan of the batter’s team. But what you don’t know is whether the defense had the batter scouted perfectly, knew his tendencies re: the pitch, the count, etc., and played him right where he should have been played. Where’s the luck in that, if a guy hits a ball right where the defense believes he will, and turns it into an out?
You open the hatch on that dark hole, you’d better be prepared to climb in all the way.
*–Me, I believe in physics. I don’t much believe in luck, good or bad.**
**–Except Steve Bartman.
Thank you for your comment.
I don’t think anyone would suggest that a hitter lucked his way into squaring up a baseball. We’re simply categorizing plays here. Generally (aside from bunts and a few other situations), the hitter is trying to make hard contact, and the pitcher is trying to prevent hard contact. When either one accomplishes his objective, but the result of the play works in favor of the opposition, well, that’s not very lucky.
I’m glad you brought up the point about defensive positioning. We track where fielders are located on the field, and we track whether that positioning impacted the play. So, one of the things we are considering adding to the Little Things report is just that — hits prevented by shifts and outs lost due to shifts. We currently provide this information in data feeds to our MLB clients. That dark hole isn’t so dark. We can go there, and probably will in the next iteration.
Out of curiousity – what were the “little things” scores in the playoffs this year?
Hi Calvin — the Little Things +/- per game table for the 2014 postseason is below. Four teams had positive values — the Giants and Royals were two of those. The Dodgers topped the list because they did the Little Things well in their four-game playoff stint, but obviously the key hits they allowed were their downfall.
LAD +4.5
SF +2.1
KC +1.2
BAL +0.6
WSH -2.0
DET -2.3
PIT -3.0
STL -3.3
LAA -5.3
OAK -13.0