
The Young and the Restless
Kolten Wong is one of many 25 and under players contributing to the Cardinals. (via Arturo Pardavila III)
Much has been made of the youth revolution in major league baseball this season. In July’s All-Star game, 19 of the 77 players on the rosters were 25 and under. Extend that figure a year to 26 and under and it becomes 24 out of 77. Kids are making an impact all over the game in 2015.
Four of the top 10 in position player WAR — Bryce Harper, Mike Trout, Manny Machado and Anthony Rizzo — are in the 25 and under club.
The glut of pitchers at the top of the wins leaderboard includes National League Central wunderkinds Michael Wacha and Gerrit Cole, as well as reigning World Series MVP Madison Bumgarner.
There are more young players contributing than just the stars, of course. On the whole, players 25 and under have contributed 29.06 percent of all WAR in MLB this season (through Aug. 24). If that figure stands through the end of the season, it would represent the second-highest percentage in the game since 1989. But how does it look historically? Which individual teams have benefited the most from 25 and under players, and how much success did they see in the five-year window beginning with the arrival of their bounty?
This infographic puts that information on display (click to embiggen):
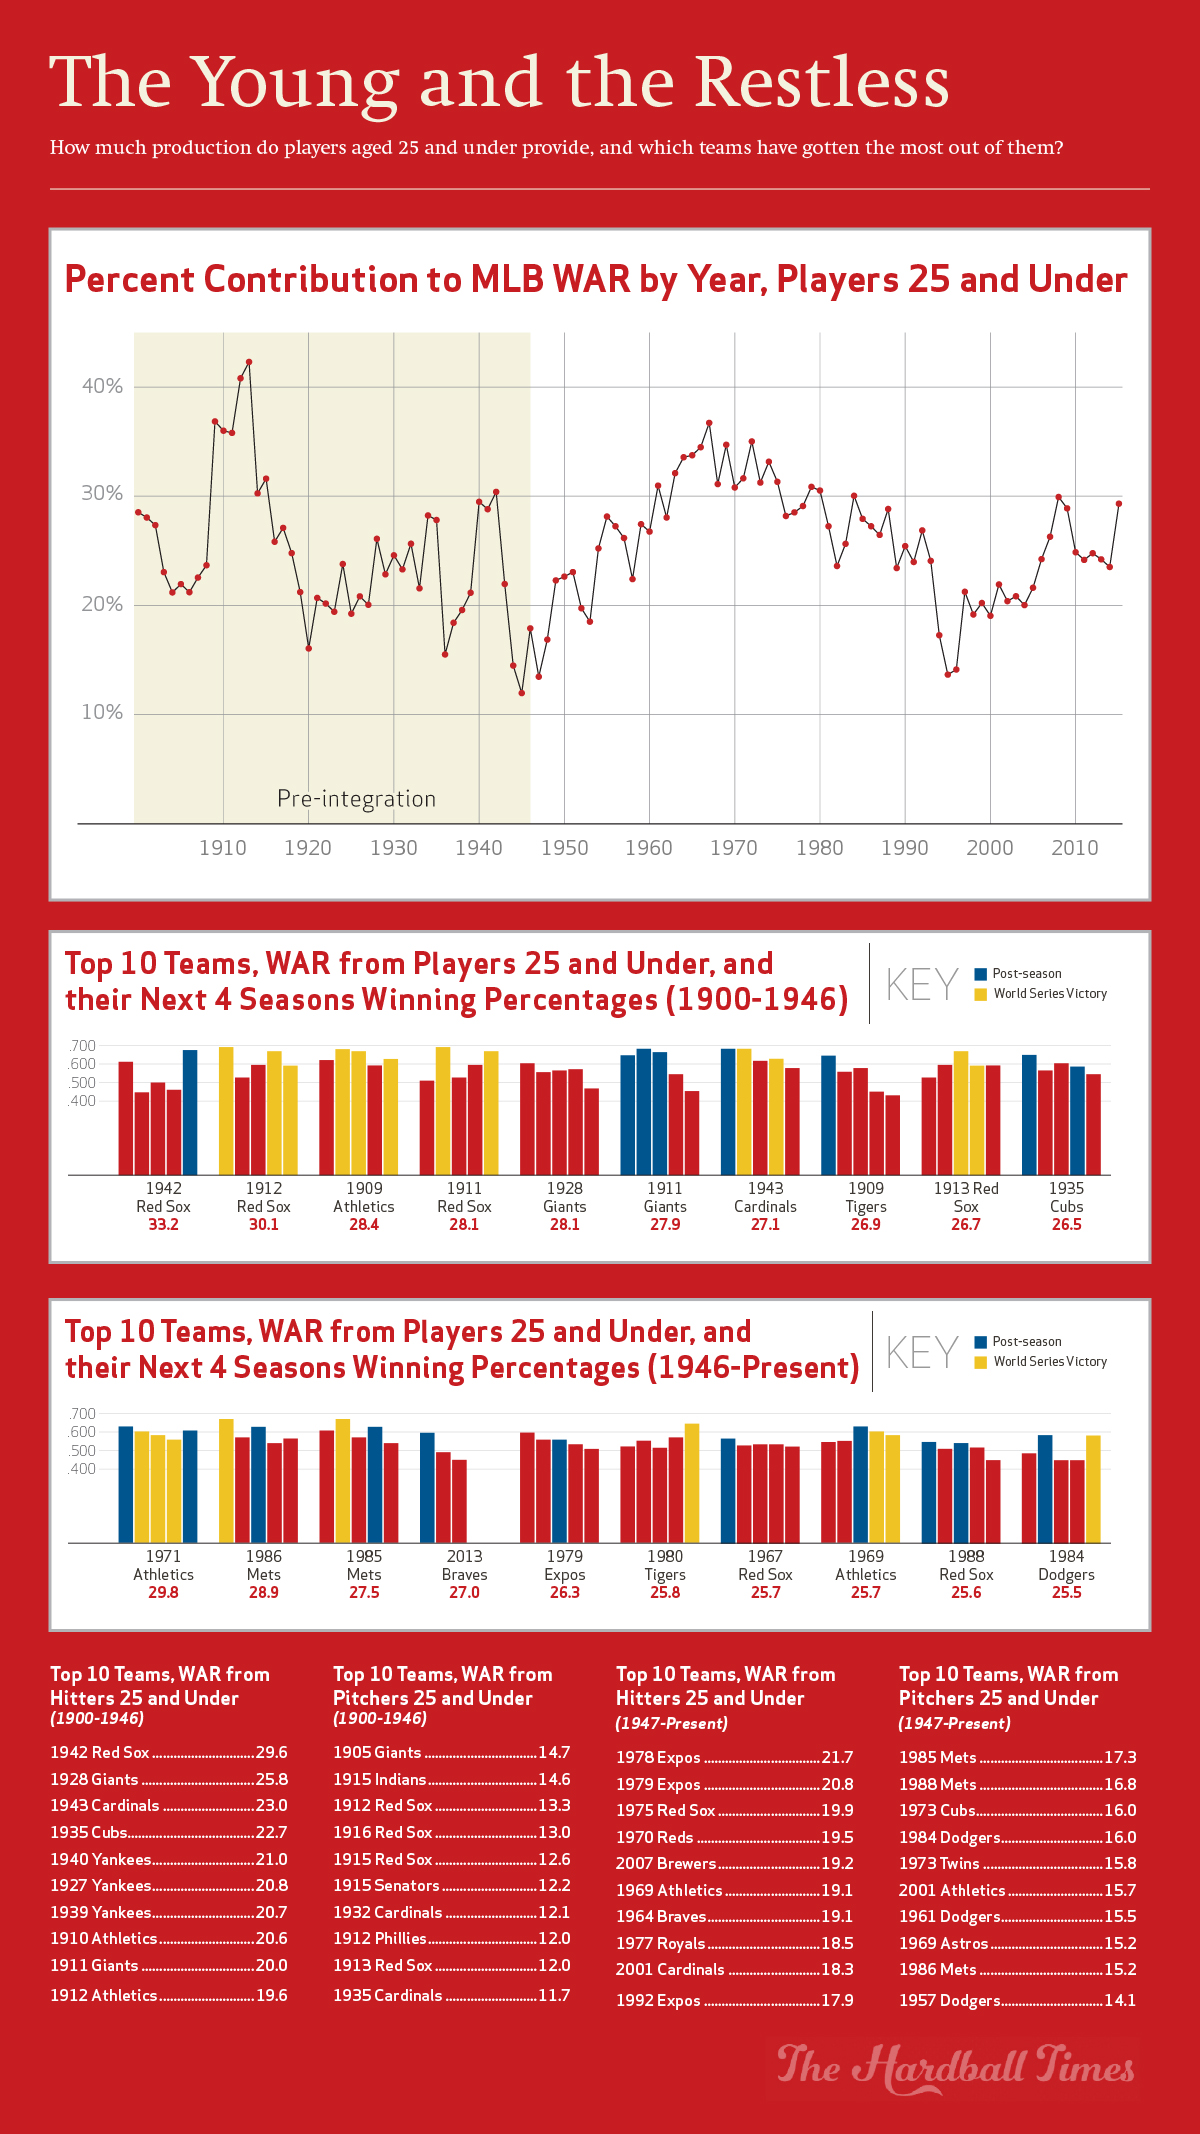
While 2015 has been an impressive year for the 25-and-under crowd, it’s worth noting that two seasons of recent vintage — 2008 — surpassed the contribution of this year’s crop. Going further back, the clear heyday for 25 and under contributions in the modern era happened from 1961 to 1980. Since 1900, the percent contribution from players aged 25 and under has cracked 30 percent or more 25 times. All but nine of those came from 1961 to 1980, buoyed by major contributions from players like Johnny Bench, Mike Schmidt, Carl Yastrzemski, Ron Santo, Reggie Jackson and Tom Seaver, and an astounding 48.7 WAR at 25 and under from Bert Blyleven, who was a seven-win player at age 20. During this unprecedented 20-year run, 19 seasons surpassed the 2015 figure. So while 2015 has represented a nice spike in performance from younger players, it is not without its peers in the game’s history.
Moving on to the team level, we find that the list of teams in the top 10 of total WAR provided by players 25 and under, pre- and post-integration, has been anchored by some of the best talent the game has ever seen. To wit:
- The 1942 Red Sox, the best team before 1947, was propelled by the subjects of David Halberstam’s The Teammates. Ted Williams, Johnny Pesky, Bobby Doerr and Dom DiMaggio accounted for a WAR of 29.4 that season.
- The 1928 Giants received sizable production from Mel Ott.
- The 1911-1913 Red Sox were keyed by “Smoky Joe” Wood and Tris Speaker.
- The 1909 Tigers and 1943 Cardinals saw major contributions from Ty Cobb and Stan Musial, respectively.
- While none will reach the Hall of Fame, beginning in 1985, the Mets found abundant WAR from Darryl Strawberry, Doc Gooden, Lenny Dykstra, Sid Fernandez, Ron Darling and David Cone, some of the best young talent ever collected by a single franchise.
- Oakland’s early ’70s dynasty was built on a foundation that began in 1969. Their 25 and under bounty included Reggie Jackson, Vida Blue, Catfish Hunter, Blue Moon Odom and Sal Bando.
- Kids on the 1984 Dodgers eventually spun a World Series championship in 1988 on the back of Orel Hershiser and his record-breaking consecutive scoreless inning streak.
- In 1980, the Tigers culled a WAR of 25.8 from the likes of Jack Morris, Alan Trammell, Lou Whitaker, Kirk Gibson and Lance Parrish. That quintet formed the backbone of a 104-win juggernaut that went wire-to-wire in first place before winning the World Series in 1984.
Individual teams who have found their way into the top 10, both pre-integration and post-integration, have typically become powerhouses. Looking at the individual teams that made the top 10 (both pre-integration and post-integration) and the franchises’ next four seasons, a five-year window, the aggregate winning percentage is .573. The post-integration group is more pertinent to today, and they have won at a .557 clip. Of the 20 teams that make up the two groups (top 10, WAR from 25 and under, pre- and post-integration), only one failed to reach postseason play in their five-year window. Eleven of the 20 franchises won a World Series, and collectively they won 21 titles in 98 seasons. Reaching the top 10 is a harbinger of success at the highest levels.
This brings us back to 2015. One team — the Cardinals — has an outside chance of landing in the post-integration top 10. Through Aug. 24, the Cardinals’ group, pushed by Wacha, Jason Heyward, Kolten Wong, Carlos Martinez, Kevin Siegrist, Randal Grichuk and Trevor Rosenthal, had amassed 19.7 WAR. At their current pace, they would finish with a WAR of 25.7 from the kids. If they pull that off, they would surpass the 1984 Dodgers and 1988 Red Sox to get them top-10 status, tying the 1967 Red Sox and 1969 A’s for 7th all-time.
We’ve seen that this year is a very good, though not great, season for 25 and under players, and one team has an outside shot to receive historically great production from its kids. In 2015, youth is clearly not wasted on the young.
Very insightful, great analysis, good blend of facts and not too many opinions. I’m personally biased as brother of the author but even were I not I would feel just as strongly about the quality of the article.
In an interview with CNN US chess champion Hikaru Nakamura was asked, “Is there an age when a chess player peaks, like in, say, golf or tennis?” He replied, “I think the jury is still out on that. Chess is changing a lot. In the old days, your peak was considered in your late 30s or when you were 40. And slowly that age keeps coming down. Right now, the peak age is considered somewhere between 25 to 35, depending on who you are. I think I’m still on the way up.” (http://edition.cnn.com/2015/08/21/sport/nakamura-chess-grandmaster/)
I have noticed during the course of my 65 years that there has been a general trend toward youth in everything. For example, in China once a player turns 30 he can no longer play on the National team in the chess Olympiad. He must become a “trainer” for those much younger players.
Nice. Would be interesting to see that first graph broken out for pitchers and hitters, just to see how much the steroid era may have benefitted each.
The big drop in ’94 is interesting. I’d expect the strike to have some influence on this, but that’s steep. And it remained low a couple years after.
Ahh, so that’s what the unicorn function on my spreadsheet is for. Always wondered.
Your graph seems to be missing the first 24 years of major league baseball.
Here’s an idea: despite more muscled players, despite faster base runners, despite more pitchers than ever reach 100 MPH, a baserunner to first base is still out by miliseconds or mm as were players in the past decades. Is the 90 feet to first base the perfect distance? What I notice are stronger throws from short than in the past but faster baserunners are still out or safe. Since math is a big part of who you are can anyone shed some light on the strengths of yesteryears players vs today’s players who ran and run the same distance?