Why you can’t subtract FIP from ERA
Okay, so the title is misleading. They’re both numbers and can be subtracted from one another with wild abandon. Just don’t expect it to mean anything.
What do I mean? The basic formula for FIP is:
(13*HR+3*BB-2*K) / IP + 3.2
You can fancy it up a bit (or a whole lot, if you want something like tRA), but what you’re getting is still a linear model of run scoring. Which is fine, so long as you understand what that means.
Let’s take the home run term of that equation for a minute. It’s supposed to correspond with the number of runs allowed per home run. Here’s the thing, though. The number of runs allowed per home run goes down if you have a low walk rate or a high strikeout rate or both, because that means there will typically be fewer runners on base when a home run is hit. A linear model of run scoring doesn’t account for that.
What this means is that you have a much narrower band of results when you use FIP than when you look at ERA. To illustrate:
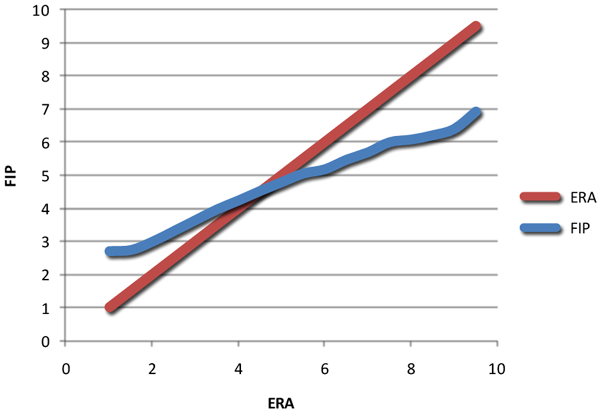
The red line represents ERA graphed against itself. As one can imagine, ERA has a one-to-one relationship with itself. The blue line represents FIP relative to ERA. It’s a bit disjointed, because it’s based upon sample data.
But what you can see is that FIP doesn’t stretch as far as ERA – while ERA on the graph goes from 1.00 to 9.50, FIP runs from about 2.71 to 6.92. (The slope of the line is also rather different.)
So, let’s take an example, from Cyril Morong’s recent blog post about the Dodgers:
ESPN shows that the Dodgers DIPS% is 107, meaning that their pitchers would have an ERA that is 7% higher than it actually is if they allowed a league average of hits on balls in play (they are , of course, better than average). With their actual ERA being 3.61, then their DIPS ERA is 3.86. So here their fielders save .25 runs per game (that is, if the pitchers have nothing to do with batting average on balls in play). The Dodgers have played 115 games, so this is an additional 28.75 runs scored. Adding the 10 in from fewer unearned runs gives us 38.75 runs. Since it usually takes about 10 runs to win one game, a rough estimate is that the Dodgers have won close to 4 games this year with their fielding.
Except.
For an ERA of 3.5, we would expect a FIP of about 3.92, based upon the graph above. If we smooth out that line a bit with a linear regression, we can estimate that a 3.61 ERA should result in a 3.96 FIP. (FIP and DIPS ERA aren’t precisely the same thing, but they are both defense-independent component ERAs based upon linear models of run scoring, so I don’t fee too bad in conflating the two.)
So the effect Morong is seeing here is almost entirely a function of the linearity of FIP, not the Dodgers defense at all.
This doesn’t mean that FIP is useless, of course – it should do a good job of putting pitchers in the right ordinal ranking – the best pitchers will generally have the lowest FIPs and the worst will have the highest, at least within the limits of sample size. But what it will do is distort the distance between the best and worst pitchers.
And that’s why you can’t just subtract FIP from ERA. (Or, again – you can, but you shouldn’t.)
UPDATE: Someone asked about tRA. Well, I have that data, along with xFIP. Excuse me if I’m getting a bit too wild with the Photoshop effects; I promise in a few days I’ll stop feeling like a kid in a candy store and learn some restraint.
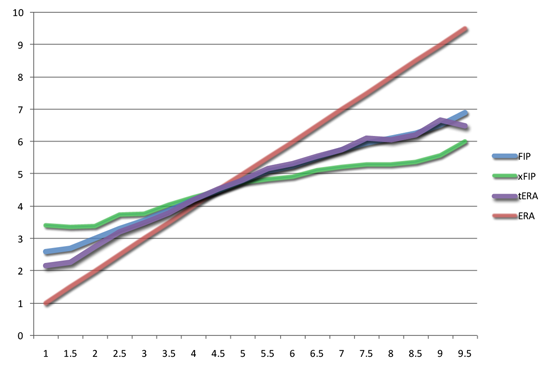
xFIP has an even smaller spread, which should surprise nobody – it normalizes differences between pitchers’ home run rates. This has the benefit of being more predictive of future ERA, one should note.
tRA and FIP are nearly identical in this regard, which again shouldn’t surprise anyone.
Colin, great article and a good point. I think the benefit of a building stats like QERA comes from trying to deal with the interaction between HR/K/BB, whereby obviously HR are more damaging to pitchers who BB more hitters, etc.
However, a proper ERA/FIP graph based on sample data might look something like this anyway, because the variance in ERA includes all the variance of FIP plus variance based on luck on balls in play and luck on timing of hits too. Mathematically,
Var(ERA) = Var(K/BB/HR skill) + Var(K/BB/HR luck) + Var (BABIP/timing luck)
Var(FIP) = Var(K/BB/HR skill) + Var(K/BB/HR luck)
Conditional on ERA being low, you expect FIP to be lower, but you would expect the pitcher had better luck as well.
Either way, this is a very good point and I think most people miss that.
Var
So can we just linearly transform FIP so that it matches the ERA line above?
Eyeballing it, it looks like
FIP 4.50 = 4.50 ERA
FIP 3.00 = 2.00 ERA
FIP 6.00 = 8.00 ERA
If we let
nFIP = (2*(FIP – 4.5)) + 4.5
Then we get
nFIP 4.50 = 4.50 ERA
nFIP 1.50 = 2.00 ERA
nFIP 7.50 = 8.00 ERA
Much closer. And of course, this could be improved if you use the actual numbers, used a larger sample, etc.
Does this make sense to do, or does this introduce some new problems that I haven’t considered?
So does this also mean that the way FanGraphs WAR is calculated is going to underestimate how much above replacement pitchers at the low end are and how much below replacement pitchers at the very high end are?
Nick – I don’t think so. Remember, ERC is Earned Runs Created, and despite all its flaws RC is not a linear run estimator.
Matt – But the terms for HR and BB in QERA don’t interact, I don’t think. I’ll have to double-check, but I’m pretty sure it’s linear, too. Yes, it gets squared, but up until that point it follows the form
C + x * a + y * b + z * c
Which is a classic linear model. You get something that scales a bit differently, but you’re not actually getting any interaction.
As for the variances, that only matters if we’re looking at FIP versus future ERA, not against observed ERA. In other words, it’s a crude proxy for regression to the mean. Which is fine if we want to compare FIP to future ERA. But if FIP and ERA are drawn from the same sample, what we can’t do is take the difference and say that it’s all attributable to defense.
David – Maybe. (Of course, then we run into another problem – because unearned runs are excluded from ERA, there’s a smaller version of this effect when you subtract ERA from ERA – you understate the difference between pitchers.)
Jack – Yes. Rally’s WAR should be free from this problem, because he uses TotalZone to adjust observed runs allowed, instead of using a component ERA.
Good to see this here. I remember when I first started my blog in ‘06, I was going to do a post looking at the most unlucky pitchers (via FIP-ERA) to target as trade candidates for the Reds. And this is exactly what I saw—all the “unluckiest pitchers” were really bad pitchers. And all the “luckiest pitchers” were really good pitchers. But it was all so new to me that I wasn’t ready to write an article critiquing the approach….so I just filtered out anyone with an FIP over 4.25. Here’s that article:
http://www.basement-dwellers.com/2006/03/searching-for-undervalued-pitchers.html
Does tRA & tRA* do the same thing? If not, it might be another good reason to switch.
-j
I meant a component ERA.
Does the ESPN DIPS% account for the fact that the Dodgers have one of the strongest pitchers park in the majors?
You can subtract ERC from FIP though, right? Both are linear formulas. I think that’s what people should be looking at when testing defense.
But Colin, I went on to say that I thought something was wrong by mentioning that Fan Graphs shows the Dodgers defense to be average. Now I don’t know if you can substitute DIPS and FIP in terms of linearity. Here is a link explaining DIPS 2.0.
http://www.baseballthinkfactory.org/mccracken/dipsexpl.html
I am not going to try to figure out if that is linear since there are so many steps. I also don’t know if we had a blue line for DIPS instead of FIP if the difference from the red line would be as big.
Also, maybe we could put in some interaction terms like HR*BB, etc and see if we get a better result (having the blue and read lines correspond more)
We might also check to see if there is some mind of correlation between walk rates and the difference between the blue and red lines. It might be something weird, like a parabola
We might also see if there is a correlation between the difference between the red and blue line and walk rates and/or strikeout rates. It might be something weird like a parabola
Cyril – Check out line 12, which is the part where dER are estimated. That’s the part we’re concerned with when we are talking about linearity, and that’s certainly a linear equation.
Yes, using FIP, there is a positve correlation (.376) between BB/IP and the error term. There is also a correlation (-.459) between SO/IP and error term. So maybe the FIP formula could have some adjustments. Just not sure what exactly. I used all pitchers who had 100+ IP in 2008
But again, I don’t know if we can equate FIP and DIPS 2.0. Also, I ran a regression with ERA as the dependent variable and HR, SO, and BB as the independent (per IP) and then found the correlation between the error term and the SO and BB rates and those correlations were zero
Okay, but we still don’t know if DIPS 2.0 has the same bias as FIP. I am about to grab some data from ESPN using 2008 data and seeing what biases there are between ERA and DIPS 2.0 ERA
That “C” above was me.
Okay, I took the pitchers listed at ESPN and found there differential. The correlation between differential between actual ERA and DIPS & and BB rate was .14. So as walk rate goes up, the more likely your actual ERA is going to be above that predicted by DIPS. But this is pretty slight.
Same for SO rate and differential. The correlation was -.06. So as your strikeout rate goes up, the more likely your actual ERA is below that predicted by DIPS. So there is some skew, but not alot. And certainly less than if you use FIP.
Also, I ran a regression with the differential being the dependent variable and BB rate and SO rate being the independent variables. The r-squared is just just .026. The t-value for strikouts is -.96. For walks it is close to being significant at 1.79
The answer to the first question is yes. But what I was trying to point out with that it that the ERAs predicted by that regression don’t seem to show the bias that your first graph shows. It was not so much to try to find out that having a low BB rate or high strikeout rate is good, just to see if a regression that did that has the same problem that you point out.
On the second thing, all I can say is that we are getting different results. I only looked at 2008 but what I was trying to focus on was what you said here:
“The number of runs allowed per home run goes down if you have a low walk rate or a high strikeout rate or both, because that means there will typically be fewer runners on base when a home run is hit.”
So this implies that guys with low walk rates are not being fairly treated, that they get a projected era that is too high (as projected by FIP). And that guys that have a high strikeout rate get a projected era that is too high. But how strong is that bias for each guy.
I agreed that it could be strong for FIP by the correlations I mentioned. But then those same correlations were much lower for DIPS. Yes, for 2008, DIPS overprojected ERA for guys with low walk rates. But the correlation between (ERA -DIPS) and walk rate was .14. So as walk rate goes up how the spread between ERA and DIPS falls. But is very slight. So yes, a guy with a low walk rate is treated unfairly by DIPS, it gives him too high a projected ERA. But it is not very much higher and the bias is alot less than in FIP. I could tell a similar story for SO rate.
Maybe you could do the same correlations on your data set between the predicted and actual ERAs for both FIP and DIPS. I got much lower correlations in the DIPS case. Also, I don’t know if range is the issue or the main issue. If BABIP is not due to the pitchers, then we might expect that a guy with a low ERA did not really deserve it and vice-versa for a guy with a high ERA. Shouldn’t we expect that the range should be smaller for any DIPS ERA (if it is done right)?
So if we take some pitcher and look at the differential, are we being unfair to guys with a low walk rate? It seems the answer is no because the correlation between differential and walk rate is so low. Same for strikeout rate. Then why can’t we do that with teams?
And again, I agree that this could be a big problem for FIP because I found much higher correlations between the differential and the BB rates and SO rates. I hope you try these correlations on the data set.
And finally, here is how I finished my blog piece on this
“On the other hand, Fan Graphs Team Fielding shows them to have just about average defense using more advanced metrics.”
So I was already suggesting that my runs saved estimate for the Dodgers defense might be wrong and I was trying to point out how different methods gave different answers. I never said that the estimate was necessarily right
Colin, what is your math? I don’t understand how you got your results for your (very pretty) graphs.
Dave – What I did was take and round all observed ERAs to the nearest half. Then I took the weighted average of the FIP for each of those groups of pitchers.
This was a way of cleaning up the graph – you could see the same slope for the line when I just did a scatterplot of ERA to FIP, but the scatter is pretty wide and distracted from the essential point. (I could have made a linear trendline in Excel, now that I think about it. But that would get really messy for the xFIP/tERA graph.)
Cyril – You’re getting way too hung up on minutia here, and you’re missing the larger point. We know that linear weights are linear – that’s why they’re called linear weights. DIPS, FIP, tRA, xFIP are all linear formulas – FIP is the result of a linear regression, DIPS is based on Extrapolated Runs (which I believe is also a linear regression), tRA uses empiric linear weights.
But run scoring isn’t linear. So there is always going to be a disconnect between what a linear formula predicts and what is observed because of this.
Colin
As you might guess, I don’t think I am hung up on minutia. But can you tell us some nonlinear formulas that work better for pitchers?
Cy
What I did was take and round all observed ERAs to the nearest half. Then I took the weighted average of the FIP for each of those groups of pitchers.
I assume for this season only? Or for more than one season?
I ask because I think your graph significantly overstates the non-linearity of run scoring and you’re likely capturing a lot of outlier performances when collecting info this way. IOW, there is more going on behind your data than simply the non-linearity of scoring runs.
For FIP and dERA, I used 1993-2008. For the other graph, I used 2003-2008 (because I’m missing batted ball data for 2000-2002).
Did you use career totals, which would mostly get rid of the outlier issue, or did you use seasonal totals, which wouldn’t?
I thought you used a simulation or something like that, in which you would hold fielding performance constant. I don’t think this is a legitimate analysis if you didn’t.
I don’t have access to a sim, Dave. (Would that I did!) What I do have is Retrosheet data, however. I’ll see if I can do something with that.
Cyril, did you really use a multiple linear regression to tell you that a pitcher with a low BB/IP or a high SO/IP has a lower ERA and a pitcher with a high BB/IP or a low SO/IP has a higher ERA?
I just coded DIPS 2.0 for the same time period as the first graph, and got a range of dERA from 2.66 to 6.80, practically identical to the results from FIP/tRA. This is wholly a result of using some kind of linear weights to figure runs allowed.
What’s the answer? Use a dynamic run estimator, like BaseRuns. Voros has done it, David Gassko has done it, I’ve done it.
I think the only way to really prove your point is to model it somehow—there will always be fielding bias in whatever “real life” sample you choose.
I haven’t looked at this dynamic specifically, but I doubt the issue is nearly as significant as your graph shows. It exists, but only at the extremes.
FWIW, you might be interested in this post, from about six years ago. It doesn’t address your point directly, but I think it has some related issues.
http://www.baseballgraphs.com/main/index.php/site/article/my_vacation_with_fip_and_der/
That is a great blog post. Thanks for that.
I came up with some ideas on a long car ride to the zoo and back that I’ll have to test later. But I think that the issue isn’t linearity, but what Matt Swartz was talking about with variance. (In short – I get to write about regression to the mean again! Yay!)
I WANT CATTER TO YOU http://goo.gl/Z7mJYy
your visit me in here thank you
very much
like my site in here please thank you
very much
why do not ? http://goo.gl/V2cU4L
does you visit me in here
jasa konveksi kaos
tempat pesan kaos raglan