What Kind of Hitters are Volatile?
Joey Votto has figured out how to remain consistent at the dish (via Geoff Livingston).
Introduction
Ever since I began writing publicly about baseball, I’ve been looking into the topic of player volatility. Two main questions have motivated this research: 1) To what degree do players’ performances from game to game vary from their overall seasonal performance, and 2) What accounts for differences in this variation?
I’ve published quite a bit over the past few years addressing the first question, developing two metrics to help measure the overall volatility of a hitter (VOL), as well as how that volatility compared to league average (VOL-). Last year, at FanGraphs, I relaunched after altering the methodology for calculating hitter volatility.
Settling on a metric that, while not perfect, seems to capture the essence of the first question, I’ve turned to the second question: What accounts for differences in VOL? Which types of hitters tend to be more volatile and which less so?
Brief review of VOL and VOL-
The research began at Beyond the Box Score back in 2011, when I was interested in whether there was a way to quantify David Wright’s alleged streakiness. (In fact, that was my first official public article.) After some great feedback and much experimentation, I came up with the VOL statistic.
The idea behind VOL was to put a number to what fans and observers generally feel about the reliability of a player’s production. Does a player perform at generally the same level or does he tend to have a great game followed by bad game?
VOL was not envisioned as being a measure of streakiness. You may have a high-VOL player who also is streaky (meaning his production tends to be lumpy–a long steak of production above his average production followed by a long streak of below-average production–but that is not the same thing. (For a great treatment of the streaky concept, see Seth Samuels’ two-part series at FanGraphs–and, yes, it’s that Seth Samuels.)
After moving to FanGraphs, I decided to revisit the research. There were issues with it, but there was something about the topic that kept me interested. In late 2012, I rolled out a new metric and approach to VOL and began calculating VOL-, which is simply a player’s VOL relative to MLB average (VOL/lgVOL). Note that it is not park or league adjusted in the traditional sense.
The current calculation for VOL is:
VOL = STD(daily_wOBA)/Yearly_wOBA^.52
Where;
VOL = volatility
STD(daily_wOBA) = the standard deviation of a player’s daily batting performance, measured by wOBA*
Yearly_wOBA^.52 = a player’s yearly wOBA raised to the .52 power
*Only games where the player had more than two plate appearances are used in the calculation.
Why limit the calculation to games with greater than two plate appearances?
In previous work, a reader pointed out that there was a strong correlation between VOL and PA/G. In essence, due to how VOL was being calculated, hitters higher in the batting order appeared to be getting an artificial boost in terms of consistency.
Now, that isn’t the worst problem, since we see similar relationships between PA/G and overall wOBA (r=.413) and wRC+ (r=.404), but the relationship was extremely strong (-.787). However, as you limited the sample to higher and higher levels of PA/G, the correlation began to decrease.
What I’ve done in the current iteration is to limit the calculation of VOL to just those games in which the hitter logged at least three plate appearances. When this was done previously, the correlation between between PA/G and VOL dropped to -.26, and only -.19 when restricting to hitters with greater than 500 plate appearances.
A lower VOL (and, obviously, VOL-) value is “better” in the sense that it indicates a hitter has been more consistent offensively. However, both good and bad hitters can be consistent, so a lower VOL always needs to be viewed in the proper context.
There have been questions as to whether consistency is inherently a good thing. I haven’t been able to adequately answer that at the individual level, but there does appear to be some evidence that offensive consistency at the team level is beneficial.
VOL and VOL+ for 2011-2013
The last time I published on VOL was June of 2013. Before moving into the analysis, I thought it would be helpful to provide a look at the final season leaderboard.
I’ve included leaderboards for 2013, as well as the past two seasons (you should also be able to see it embedded below). There is also a tab that has three-year averages for players with at least 300 PA in each of the past three seasons. Click next to the 3-Year Average tab, and there is a dashboard you can use to get a quick snapshot of a single player’s VOL and VOL- in each of the past three seasons.
As for 2013, if we restrict to hitters with >=500 PAs, the VOL- crown goes to Dustin Pedroia, at 81 percent of league average. Pedroia did not have a great year at the plate, but he was very consistent. Pedroia is generally a very consistent hitter, posting the seventh-best VOL- over the past three seasons (14 percent better than league average).
If we just focus on the best offensive players (wRC+ >= 130), the least volatile player was Brian Kenny’s favorite on-base machine, Shin-Soo Choo (85 VOL-). Choo has the fourth-best VOL- since 2011 and easily the best for hitters that averaged better than a 130 wRC+ over that time period.
The most volatile offensive weapon in 2013? Chris Davis wins going away with a 111 VOL-. However, if we instead limit to hitters with more than 300 PAs, Albert Pujols takes the crown with a 138 VOL-. Not only has King Albert’s production slipped since signing in Los Angeles, but the production he is providing became extremely inconsistent in 2013. Since 2011, he is the most volatile hitter among those with an above-average wRC+ (111 VOL-).
Okay, enough with the leaderboards, lets take a look at what kinds of hitters tend to be more or less volatile.
What types of hitters are volatile?
To get a handle on what types of hitters may be more or less prone to volatility, I decided to start with some simple correlations and data plotting, limiting this analysis to hitters with >=500 PA in consecutive seasons from 2011 to 2013. The same-season correlations for VOL and VOL- are essentially the same (as we would expect), so I am just listing VOL- in the table below:
| Correlation with VOL- | |
|---|---|
| Statistic | r |
| FB% | 0.46 |
| HR/FB% | 0.46 |
| ISO | 0.44 |
| SwStr | 0.44 |
| K% | 0.37 |
| ZSwingpfx | 0.30 |
| OSwingpfx | 0.30 |
| Swingpfx | 0.30 |
| SLG | 0.22 |
| IFFB% | 0.16 |
| Fstrike% | 0.03 |
| wOBA | -0.01 |
| wRC | -0.02 |
| BB% | -0.06 |
| BUH% | -0.09 |
| wSB | -0.13 |
| IFH% | -0.16 |
| PA | -0.19 |
| UBR | -0.19 |
| Spd | -0.23 |
| OBP | -0.32 |
| OContactpfx | -0.33 |
| GB% | -0.33 |
| LD% | -0.34 |
| BB/K | -0.34 |
| Zonepfx | -0.34 |
| AVG | -0.34 |
| ZContactpfx | -0.36 |
| BABIP | -0.37 |
| GB/FB | -0.40 |
| Contactpfx | -0.41 |
So what do we see?
The first thing is that power hitters should generally be more volatile. Racking up high strikeouts–with a high whiff percentage–and driving the ball in the air and out of the ballpark appears to drive VOL- higher (and remember, higher VOL- means more volatile and less consistent). The second is that hitters that tend to hit the ball on the ground, and reach base at a higher rate as a result, tend to have lower VOL-.
These correlations aren’t too far afield from the original research I conducted around the causes of volatility. There I found that ISO and K% were positively correlated to VOL, and BB% was negatively correlated.
Now, we can simplify this since some of the metrics correlate to VOL- are really just components or drivers of each other. For example, hitters with high ISO tend to hit the ball in the air (r=.561) and hit a high percentage of those fly balls out of the park (r=.898). Hitters with high OBP tend to walk more (r=.622 vs. r=.371) and have greater success reaching base when they put the ball in play (r=.646 vs. r=.109).
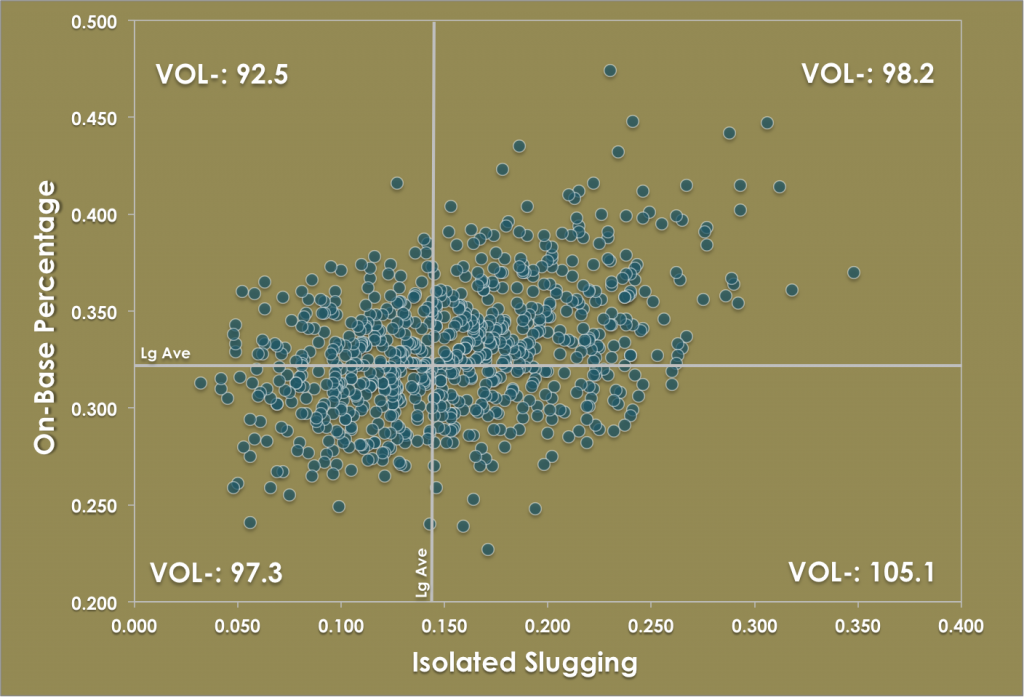
So let’s plot OBP against ISO, split the plot into four quadrants based on whether the hitter’s OBP or ISO was above league average, and see what the average VOL- is for those four quadrants:
| VOL- by Quadrant (PA=300) | ||
|---|---|---|
| Quadrant | Above Average ISO | Below Average ISO |
| Above Average OBP | 98.2 | 92.5 |
| Below Average OBP | 105.1 | 97.3 |
And those groups visualized:
Restricting to plus or minus one standard deviation of average ISO and OBP basically reveals the same results:
| VOL- by Quadrant (PA=300): +/- 1 Standard Deviation | ||
|---|---|---|
| Quadrant | +1 STD ISO | – 1 STD ISO |
| + 1 STD OBP | 98.7 | 91.0 |
| -1 STD OBP | 105.8 | 100.8 |
The results largely conform to what we would expect. Hitters with above-average OBP but below-average ISO have on average the best VOL- (92.5). Hitters on the opposite end of the spectrum (above-average ISO, below-average OBP) have the worst VOL- (105.1).
Consistency of consistency (or the brilliance of Joey Votto)
One final question is whether VOL is a repeatable skill–or, more importantly, how reliable a metric is VOL on a year-to-year basis.
Turning again to our data set and restricting to hitters with seasons of >=500 PA, we find that the correlation between VOL- in year one and year two is .401 (n=435). As with the previous research, this isn’t an incredibly robust correlation, as the .401 places it in the same company as batting average and BABIP.
Given that VOL and VOL- have mild correlations, year to year, I still wanted to see which hitters have been the most reliable in terms of their volatility.
To tease this out, I took three consecutive years of VOL and VOL- scores for hitters in my data set and simply calculated the standard deviation of their respective VOL- statistics over the three-year span between 2011 and 2013.
The hitter with the lowest standard deviation in terms of his VOL- over that span was Adrian Beltre (.002). However, Beltre’s VOL- in each year was roughly 103 percent, meaning he was three percent more volatile than league average.
Melky Cabrera was the hitter with the lowest standard deviation who managed a better-than-average VOL- over this time frame. However, Cabrera wasn’t exactly a dominant hitter over these three years. In 2011, he posted a 118 wRC+, followed by a 150 and then an 87 in 2012 and 2013, respectively.
What about consistently excellent hitters?
I restrict the data to hitters who posted >= 130 wRC+ in each year since 2011. This yielded a list of only 11 hitters. Of those 11, only three managed to post VOL- better than league average in each of those three years: Aramis Ramirez, Joey Votto, and Matt Holliday. (While some others had better-than-average VOL over that span, only these three had better-than-average VOL in each of those three seasons.)
| Most consistent hitters, 2011-2013 (>=130 wRC+) | ||||
|---|---|---|---|---|
| Name | STDVOL- | Ave VOL- | Ave wRC+ | |
| Adrian Beltre | 0.002 | 103% | 137 | |
| Aramis Ramirez | 0.013 | 94% | 136 | |
| Giancarlo Stanton | 0.019 | 100% | 144 | |
| Joey Votto | 0.023 | 91% | 162 | |
| Matt Holliday | 0.027 | 92% | 148 | |
| Jose Bautista | 0.028 | 99% | 154 | |
| Robinson Cano | 0.035 | 99% | 142 | |
| Evan Longoria | 0.038 | 101% | 137 | |
| Andrew McCutchen | 0.065 | 97% | 147 | |
| David Ortiz | 0.069 | 100% | 157 | |
| Miguel Cabrera | 0.097 | 94% | 178 | |
While all three were excellent in terms of their production and the consistency of that production, I have to give the title to Joey Votto.
Over this three-year span, Votto posted a 162 wRC+ and a combined VOL- of just 91. Ramirez posted 136 wRC+ and 92 VOL-, while Holliday posted a 148 wRC+ and a 92 VOL-.
Ramirez had the smallest standard deviation between his three VOL- scores, but just barely. And while Holliday was extremely close to Votto in terms of VOL- and the consistency of those VOL- scores, Votto was 14 percent better relative to the league in terms of overall production. That is pretty impressive.
Wrapping up
So what have we learned?
First, there appear to be real differences in how players distribute their production over the course of a season, and that difference likely underlies many of the “feelings” fans and observers have about whether hitters “show up” every day.
Second, much of that difference seems to be a function of the type of hitter you are. Hitters that tend to hit the ball in the air for power tend to produce in a more volatile fashion, while groundball hitters with higher on-base skills appear to produce more closely to their average on a daily basis.
With batted-ball distribution and BABIP playing a large role in the consistency of production, it is easy to see how some players could be labeled as “unfocused”, or “not giving it their all” every day when in reality, it may simply be a function of the kind of hitter they are.
Third, while the year-to-year correlation for VOL- is quite low relative to other metrics, we shouldn’t chalk it up to pure randomness. Like BABIP, VOL- might jump around year-to-year, but over the long term we do see a separation between hitters where some are consistently high and others are consistently low. VOL- appears to simply take longer to stabilize, much like BABIP.
And, finally, we’ve further confirmed that Joey Votto is a freak of nature whom we are all lucky to be able to watch play the game of baseball in our lifetime.
What’s next for this research? Well, I am open to suggestions. There is the possibility of delving more deeply into the causes of VOL, but I also don’t want to beat a dead horse. So please do offer any suggestions for what would be interesting.
My first thought was to go deeper into batted-ball profiles (e.g. batted-ball angle and distance), but my guess is it won’t tell us much more beyond what we see regarding flyball and groundball hitters.
There is still the outstanding question of value: can you place a value on the consistency of hitters? I don’t have a ready approach for that question, but it is one I plan to explore. Also, I am planning to revisit pitchers, as I originally created a pitcher VOL metric that needs to be updated and undergo the same analysis.
Fascinating work Bill. However, I’m not seeing the leaderboard for 2011-13 that you reference. I’d like to see if I can glean any actionable fantasy information from it.
Thanks, Brad. The embedded tables aren’t working at the moment, so I’ve included a link in the text.
I would think this information could potentially be very useful for H2H fantasy leagues, especially depending on the stats the league uses, whether it’s old school stats where power hitters can dominate or new school where on-base guys are better.
This is a great point. Players who are good at making contact and don’t hit too many fly balls are likely to be less volatile. Speed is an added bonus. While you don’t necessarily want to avoid fly-ball hitting power types, this could be an added benefit to having guys like Votto and Holliday who produce at a high level and are highly consistent.
Exactly. I think it could even change the values of players in H2H leagues. For example, it might be better to have guys who are more consistent but put up slightly worse numbers over the course of the season, since you’ll know more closely what to expect in any given week, especially when it comes to your homer guys, who could go weeks without hitting one, then explode for 4 in one week.
I would think there are two very different sorts of volatility with different distributions of outcomes. Daily or per game is what you’re measuring but that is heavily driven by the prominence of the 0-fer games ( a unimodal distribution). Even the god of anti-volatility had 25+% of his games as 0-fer in 2013. Yet, of those 44 games, only 16 resulted in a .000 wOBA. His other 0-fers ranged from .115 wOBA to .690 wOBA. The raw weirdness of this (obvious outlier) tells me that it could be productive to split this daily-level analysis into 0-fer and non-0-fer games. At a minimum, it may indicate that some players are really good at the strategery of drawing walks (or getting hit by the pitcher and starting a brawl and getting the pitcher thrown out of the game) on the days that they would otherwise be a big hole in the batting order.
The other sort of volatility would be traditional ‘streakiness’. But in that case a single game isn’t really a good measure. Better would be a rolling weekly wOBA. That would seem to be a better way of comparing players who live and die by swing/contact.
As a complete irrelevancy, I have long thought that this would be a good way for a manager to set up batting orders. In aggregate, the view is batting order doesn’t really matter much. But games aren’t played ‘in aggregate’ – and batting order can make a huge difference in individual player value (opportunities definitely tends to translate to higher pay). So this is a perfect way to motivate and reward player performance in tiny non-statistically-significant chunks. And to provide a tiny non-statistically-significant bit of saber analysis to a manager who is a bit more ‘old school’ (or who just wants to make some decisions based on intuition, lucky streaks, etc). Just split that day’s position starters into “get on base” and “move em along or drive em in” guys (a designation which can itself change) – and then slot them 1-3-5-7 or 2-4-6-8 based on the short term volatility stuff.
Bill,
You seem to flesh this concept out a bit in your article, but there is a concept in finance called the Sharpe Ratio. Basically, high risk-adjusted returns are a good thing. In this case, a high wRC+ with low volatility is a good thing, i.e., your conclusion on Joey Votto is spot on. He performs at a high level with low volatility, relative to peers (or as the Sharpe Ratio uses, the “risk free return”).
My guess is the best way to get to this is to take wOBA or wRC+ and divide by VOL-. Any chance you could generate a chart like this for 2013 and see what the results tell you? Theoretically, it should show the best, most consistent hitters in order.
Thanks.
I second the request.
Do teams with low VOL- win a disproportionate amount of close games? The ratio wOBA/ VOL- will add to consistent players’ values, but it still does not prove whether the Sharpe Ratio should be applied to baseball. Maybe VOL- could explain teams exceeding pythag expectations (or failing to meet them).
Using a Sharpe Ratio was a good idea. I tooled around with it for a fantasy article this Thursday, but I’m sure Bill can do better.
Not to hijack Bill’s thread, but would you post the link to it when it’s up? I’d be curious to take a look through.
I’m less familiar with Sharpe Ratios, but let me look into it.
This is great. Fascinating stuff, really useful to see and the results make intuitive sense. I like the idea suggested above about a weekly volatility score as a way to limit the importance of the fact that the individual outcomes for a hitter have a high standard deviation. This actually gives me an idea of an alternative way to tease out volatility that I think could expand upon these results well.
The guys who we know are most volatile are the ones who don’t get on base and hit for power. That’s partly going to be because they have a lot of homeruns (+1.4 linear weights) and outs (-0.3 linear weights). Suppose you got a standard deviation of linear weights for a hitter across all PA in a season. For a guy who hit .500/.500/2.000 (half outs, half home runs), his expected standard deviation in a given at bat would be .850 linear weights. For a guy who hit .000/.500/.000 (half walks at +.3 linear weights and half outs at -.3 linear weights), he’d have an expected standard deviation in a given PA of .300 linear weights.
From there, you could construct the standard error that you’d expect across his 4-PA days, his 5-PA days, his 1-PA days, etc. And you’d get the expected daily volatility based on that, and compare with the actual daily volatility you have above.
This way you could figure out if the reason Votto is so consistent is that he has a lot of walks at +.3 linear weights and averages like +.05 or something, so he has a ton of PA that are close to his average. Or maybe it’s because he is consistent even controlling for this.
Alright, Mr. Wizard, you are going to make me blow this thing up again 😉 seriously, that’s intriguing. I’ll probably email to tease it out more.
Is there a way to measure how much more valuable a consistent or volatile hitter is relative to league average in terms of wins and dollars?
That would seem to me to be a logical progression for your work. In other words given two hitters who are identical in terms of aggregate production, how much more valuable is the consistent hitter relative to the volatile hitter?
Have you tried any fourier analysis in your previous research?
I’d be surprised if VOL- didn’t correlate with platoon splits… guys with strong OBP differences vs. LHP/RHP are going to inherently have larger volatility due to day-to-day differences in the handedness of opposing pitchers, right?
Interesting, thanks. Why the .52 exponent? I looked on the original explanation page on FanGraphs but didn’t see it there either. Sorry if I’m missing something.
See my comment to Brandon below. It’s to prevent VOL from simply being a function of plate appearances. They used to be highly correlated in the previous version.
Thoughts on how this would look for pitchers? Or is the sample size too small? I’d assume similar effects, namely K% and ISO allowed positive correlations, BB% and GB% negative correlations
Did an original version at Beyond the Box Score a few years back, but working on an updated version with RA/9 and FIP versions for the SABR Analytics conference. Will publish the results here probably in March.
Hey, have you looked at whether high-Vol players tend to also be more volatile year to year? I am working on doing contract analysis like discounted cash valuations are done in business and having something like Vol- as something like Beta is used in finance would be very helpful as a risk proxy.
Bill,
Random thought, correct me if I’m wrong, but wouldn’t VOL actually amplify the volatility of a player who performed at a high level? As currently calculated, I believe it’s an absolute measurement of volatility. So someone who cranks out a 150 wOBA could have a weekly standard deviation of +/- 15, let’s say. That’s 10% volatility. If someone has a wOBA of 100, with the same +/- 15 standard deviation, that’s a 15% volatility.
Normally, I’d say VOL as an absolute measurement would be fine, but in this case, since wOBA is a relative measurement, a relative VOL metric would be more appropriate. I’d bet money that the various factors’ (BB%, HR/FB, etc) r^2 improve across the board to a relative VOL metric. Maybe call the relative version rVOL or something…
Thoughts?
-Brandon
It’s spot on, but that is why the calculation as evolved. VOL is the standard deviation of daily VOL divided by average VOL–it’s a coefficient of variation to help normalize given the issues with better hitters naturally appearing more volatile. Also, the .52 was designed to strip out the naturally high correlation of VOL and plate appearances.
I mean no rudeness, but I wonder if you haven’t reinvented the wheel.
Put into ultra-naive terms, wouldn’t a player that produces lots of low-value plays (like walks and singles) inherently be more consistent (as measured by wOBA) than a player that produces fewer high-value plays (like home runs)? That seems like common sense. It’s a bit like having one die numbered 1-6 and another with only 3s and 4s. You are not measuring “streakiness,” but the range of outcomes.
If streakiness were real, it would (presumably) be an attribute independent of the player type. So that a high-average singles hitter and low-average power hitter could each be streaky, in their own respective ways. The inherent difference in value between a home run and a single seems to select low-OBP power hitters as volatile, and thus give an answer that doesn’t seem much more revealing than: hitters like Votto, who hit for a high average and/or who take walks but who hit (relatively) fewer home runs, are more “consistent” than a player like Davis, who hits home runs but has a significantly lower average and/or on-base percentage.
Well, I’m not trying to measure streakiness–that’s a related but different concept. I try to control for some of what you describe by transforming average wOBA and them using the coefficient of variation instead of straight standard deviation. That being said, there’s some natural tendency for more volatility given that power comes with Ks, etc, but I hopes to add more rigor to the idea–that and highlight the interesting outliers.
Awesome stuff! As a possible topic to explore, this is probably a completely unnecessary idea, but right now, you are treating someone with a perfect VOL to have a uniform distribution of production per game (which intuitively, would make a lot of sense for a pure VOL measure).
I am curious if we instead assumed a normal distribution as an ideal volatility how a measure like this would look. I know it wouldn’t be as pure of a volatility measure, but would still measure a volatility measure relative to what would we should expect for performance variance to look like. Given that batters face different pitchers daily, and that certain types of batters should not expect the exact same outcomes every game (like you mentioned for power hitters), perhaps the results for a readjustment of this sort would reveal some interesting information about what truly affects performance volatility.
Joey Votto will need to be at his best this year, Reds really need his production ahead of Bruce.