What the Average Hall of Famer Looks Like
Hall of Famers come with all sorts of statistical profiles.
It’s frequently easy to identify greatness. Places like the Great Wall of China and the Great Lakes are so great, in fact, that their name permanently marks them as such. The first time you see the Copacabana tracking shot in Martin Scorsese’s Goodfellas, or the mad-capped stunts of Buster Keaton, you know that you are witnessing greatness. A visit to Mount Rushmore elicits awe. Unfortunately, as easy as greatness can be to identify, it’s not always easy to quantify.
There is no metric that tells us how much more beautiful Mount Rushmore is than the average rock formation in South Dakota (weighted Rock Beauty Created?). Thankfully, part of the beauty of baseball is precisely that it is carefully measured. It inherently provides fans with the tools to measure the greats of the game against their peers. With that in mind, what exactly does the statistical profile of the average Hall of Famer look like against his positional peers?
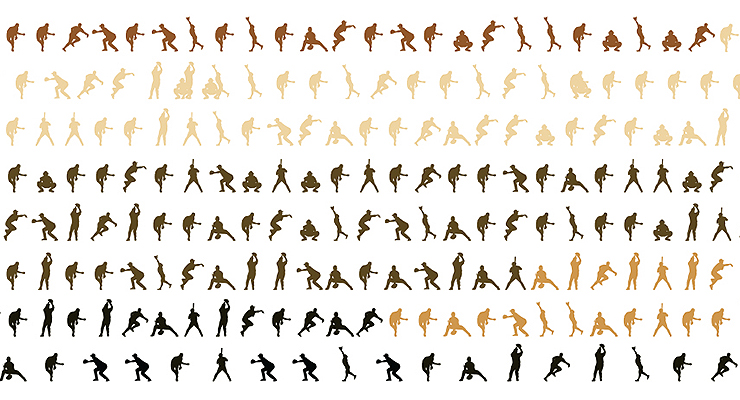
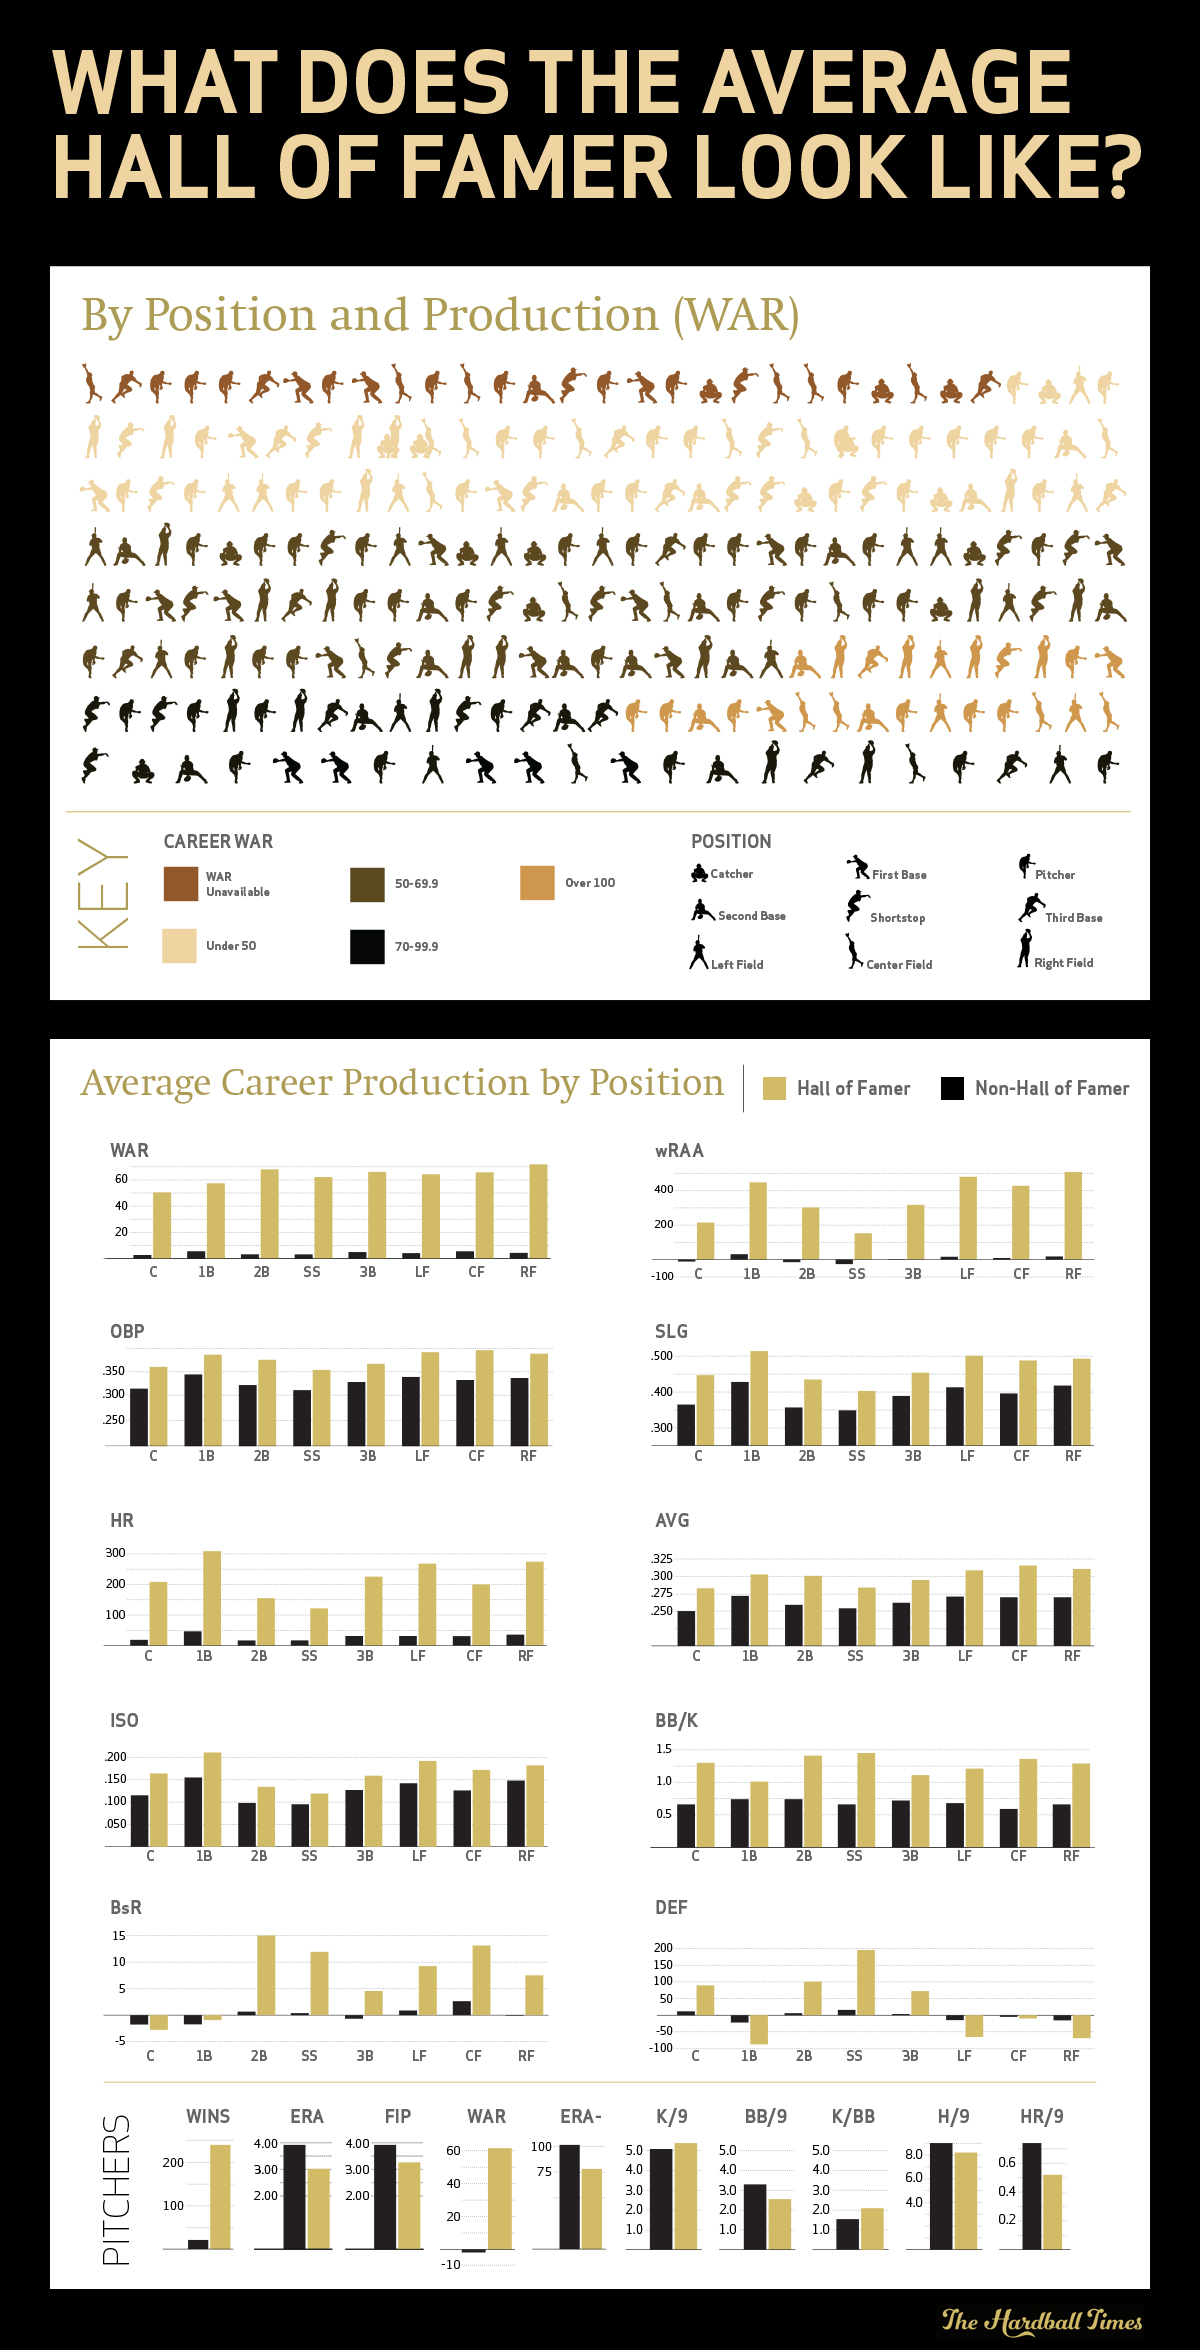
This infograph compiles that data. Specifically, it illustrates which positions the various Hall of Famers have played, how many wins above replacement (WAR) they provided, and compares the production of the average Hall of Famer against the average non-Hall of Famer at his position across a multitude of categories.
Perusing the data, several unique factors and anomalies show up.
Among rate stats, walk-to-strikeout ratio is the largest indicator in the Hall of Fame group playing up the middle (catcher, second base, shortstop and center field). These players enjoy a sizable advantage over non-Hall of Famers at their position, much more so than seen at first base, third base and left field. Standouts at these positions control the strike zone much more compared to their peers in relation to corner positions.
The corner positions, on the other hand, provide the gaudiest counting stats, most notably in the HR category. These numbers are obviously anchored by the greatest power hitters the game has ever known. Hank Aaron, Babe Ruth, Mike Schmidt, Frank Robinson, Harmon Killebrew, Jimmie Foxx and Willie McCovey pepper the list.
In some rare instances, Hall of Famers actually have worse numbers than their non-Hall of Fame peers. For instance, over the course of a Hall of Fame catcher’s career, his base runs (BsR) registers lower than non-Hall of Famers. The same is true in the Defense category for first basemen and all three outfield positions. The logical conclusion here is that most Hall of Famers have much longer careers than the average player, and players at most of those positions do not reach greatness on the basis of their gloves.
Among pitchers, the most startling difference is the gap between FIP and ERA. The average non-Hall of Famer boasts an ERA almost completely identical to his FIP. Hall of Famers, on the other hand, buck the trend with ERAs a quarter of a run less than their FIP. It amounts to an ERA- nearly 25 percent better than the non-Hall of Fame pitcher.
Not surprisingly, pitchers in the Hall of Fame do a much better job of keeping the ball in the ballpark- a quarter of a home run fewer allowed per nine innings. Similarly to their Hall of Fame peers playing up the middle, pitchers in the Hall have shown a much better mastery of the strike zone compared to non-Hall of Famers. It amounts to half a strikeout more per walk.
The best baserunners in the Hall of Fame group, per BsR, have been second basemen. Joe Morgan, Frankie Frisch, Eddie Collins, Roberto Alomar and Craig Biggio have led the way.
In terms of overall productivity, the sweet spot for the average Hall of Famer is a WAR between 50 and 70. Of the 244 Hall of Famers, 83 fall in this range. The golden mark is a WAR of 100 or better, with just 25 players reaching or surpassing that figure. Six of those 25 are pitchers, along with four each from center field and right field. The Hall of Fame only has one shortstop and one third baseman in the century club. No catchers in the Hall of Fame belong to the century club.
Catcher and third base are the underrepresented positions, each registering 16 players in the Hall of Fame. For comparison, pitchers account for 77 Hall of Fame slots, and all other positions boast a tremendous balance between 21 and 24 players. It would appear that catcher and third base are the two positions where it’s most difficult to identify and properly recognize greatness, an aspect sure to be tested in coming years when Adrian Beltre retires.
While the bar is high, there is room for variance in the kinds of supreme performance required to reach the Hall, whether it be by position, total production, or types of production. With baseball’s meticulous amount of data, we have a framework for greatness unavailable in most other more subjective endeavors. It’s truly possible to measure the greatness of a man, especially if he wields cleats and a wood bat.

I love the graphic at the top as well! It’d make a rad T-shirt. Cool to see the averages of the positions all side by side and in so many different statistical categories. To me the CF Def was rather surprising. Not that HOFer and non are almost even, but that they are near 0 runs saved.
Thanks, Rick! I was surprised by that as well. My hunch is that sometimes, if a CF can hit and hit at an All-Star (or HOF) level, they’ll take the hit on defense to continue to get the premium production at the plate from a non-traditional offensive position.
You’re probably on to something (Mantle comes to mind along with Matt Kemp, but Cobb was surprisingly in the red as well), it’s just I have so many defensive specialists in my mind for CFers, even many of the All Stars and HOFers (Speaker, Joe DiMaggio, Mays, Griffey Jr., Torii Hunter, Andruw Jones, Adam Jones, McCutchen, Ellsbury, Trout) at least had/have reputations as ”good” defenders. But after a quick look at their numbers, only a few of them really truly were/are and and more importantly were/are actually able to maintain above average defense as they age. I imagine early career success led managers to leave them there (for the exact reason you said) long after they were defensively well below average and would have been better suited at a corner OF or even 1B or DH (in the DH era of course and in the AL).
Again at just looking at the dozen or so guys I mentioned, it seems a lot of them have some horrendously negative value seasons that actually more than nullify their positive ones (Griffey Jr., Hunter, McCutchen). Whereas Cobb and Mantle (until his last few years, always hear about his knees going) were just below average, but having such long successful careers they both compiled terrible career Def numbers.
Wouldn’t the classic example of that be Mickey Mantle?
I wonder if the ERA/FIP gap is an artifact of selection bias. That is, pitchers who become HoFers may have benefited from a substantial amount of luck on BIP, vs. those who didn’t get the nod, but which are otherwise comparable, vs. the thesis that HoF pitchers tend to have an extra skill which reduces their averages on BIP, and that is often the difference between being elected, and not.
It would be more telling to show WAR/600 PA or something similar instead of what you have.
The ERA/FIP thing seems simple: HOF voters have historically considered ERA, not FIP. (Luck, as DiFool says.) I suspect the under-representation of Cs and of 3Bs is not parallel — C is recognized as a key position, with a defensive emphasis (reflected in these results), but where it is in fact difficult to identify greatness; whereas 3B has been seen as a less important position requiring lesser skills (although there was a sharp break with Brett/Schmidt/Boggs). BTW, wouldn’t it be better if there were one stat called BsR?
Are C and 3b just positions that great hitters get moved from? For catcher it is more clear. Just in recent memory Bryce Harper and Wil Myers were both moved off of catching (while both were still blue chip prospects). It seems to happen even in the bigs (V-Mart to 1b, Biggio to 2b then CF).
Catchers seem to have longer than normal careers (moer guys end up playing 15-20 years, not the average playing career), but most of them are glove first back ups that stick around as 2nd catchers for an extra 5 years to tutor the young guy taking their place. So I find it hard to point to career length, but maybe it could be games played as a problem. Most catchers are only behind the dish 120ish games a year (if they are healthy all year), and while the modern trend with really good hitting catchers is to move them to 1b or Dh on their non catching days, I am not sure this was always something that teams did. So if you only play 80% of a season your counting numbers will never jump out.
3b is even harder to justify. There are no injury risks like you see at 2b or catcher. It is also a classic destination position for strong arm SS that get too big (Cal Ripken sort of changed that, but that was too recent to really have much of an effect on things that take a whole career plus five years to see an effect).
I wholly expected 2b to be the dead spot for hitters. Like catching it is an injury prone position (when they turn double plays it can be dangerous near the bag, worse than SS since they are normally going in blind to the runner), and while it is a position that failed SS end up, normally it is the still small SS with weaker throwing arms, so the guys with lots of HR end up getting moved from SS to 3b or OF. I do see this changing, more teams are willing to move really random players to 2b to mixed results (Ackley and Rendon both moved there after being OF and 3b in college; and the Os moved Pearce there randomly this season to see if he could handle it). 2b may have just recently hit a better point with Biggio and Alomar getting in, and Kent as a potential HoF (but getting the same knock as Piazza at C- all bat but no glove).
Tough for a C to accumulate a lot of value. The only guy who isn’t in that I would definitely fight for is Ted Simmons, criminally underrated while playing with Fisk and Bench two of the best of all time.
on 3b seems a lot of guys play their some but then get moved. Beltre should get in, and Rolen should get strong consideration. Santo is right there too.
Santo is already in.
Piazza and Ivan Rodriguez should be easy catcher selections soon.
A hall of famer needs to play at least 10 seasons correct? It would be interesting to compare hall of famers with all non-HoF who played for at least 10 years.
great post. in light of Jaffe’s JAWS & JAWS7 listings, the process of determining who should be in or out of the HOF seems a lot easier now.
this post is very useful. I would only add three points.
first, the data is somewhat backloaded with bad selections from the old veterans committees and selections that overrepresented the 1920s, 1930s and New York teams, as Bill James and others have pretty much argued to death.
second, it seems to me and many others that it is very silly and serves no purpose to vote for hall of famers as a group; rather, selection should be by position. each year, one pitcher, one relief pitcher, one INF, one OF, one C and one 1B should be voted in.
That way apples get compared with apples and oranges with oranges.
finally, the title of the article points to a lasting problem with the HOF so long as old white writers do the voting. the average HOFer looks white.
I know this has been bashed to death, but once again this year we got three white guys and a light skinned hispanic (Pedro). All the dark-skinned hispanics and african americans were not voted in. Minnie Minoso, Dick Allen, Tony Oliva as well as similar candidates on the ballot were not voted in. Most notably Barry Bonds, who is so overqualified for the HOF that it is ridiculous, continues to be treated like a pariah.
I believe the treatment of Bonds is racism, not steroids. If he were white, he’d be in the HOF. Seven MVP awards–count them. 73 HR. the leading HR hitter of all time.
C’mon. Let’s get real.
I disagree with your rationale. If Bonds vote totals were impacted by race then Clemens would be getting a higher vote total than him. Instead they have almost identical totals. Considering they both put up “inner circle” numbers, it would seem that steroids is the real culprit.