When is a fly ball a line drive?
Let’s talk about parallax.
Simply put, parallax is a phenomenon in which the apparent position of an object can change based upon the location of the observer. Let’s consider a very modest change in location—moving from the driver’s seat to the passenger’s seat of a car. (Do not attempt this while the car is in motion, please.) Observe how the gas gauge looks in each position:

In this instance, the passenger would tend to believe that there was less gas in the car than the driver would.
Baseball fans will be most familiar with the effects of this phenomenon when it comes to calling balls and strikes off the television feed; most broadcasts use an offset camera angle that distorts our view of the strike zone. But what else could it affect?
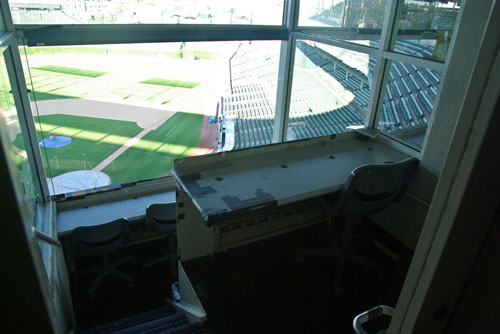
Most of what we know about batted balls comes from stringers who score games. Typically those stringers are given a spot in the press box. Now, because of the way different stadiums are constructed, the view from the press box shifts around. This, for instance, is the view from the Wrigley Field press box:
Compare to Citi Field:
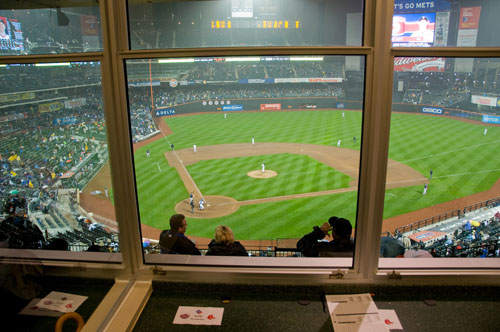
It’s a bit more of a dramatic difference than simply moving over a seat in a car, isn’t it?
So let’s test a theory—that the placement of the observer has an effect on how that observer determines the trajectory of a batted ball. Let’s focus on air balls—fly balls, line drives and pop-ups. Based upon what we know, we should expect that the higher the observer, the flatter a batted ball looks and the more likely it is to be scored a line drive.
Grading the parks
Figuring out press box heights is not a simple task. I did the best I could given the tools I had. But the heights I collected are at best estimates. This is especially true for stadiums where press boxes have multiple levels. And for some parks I gave up on trying to get a decent estimate at all. I collected data on 27 parks in use from 2005-2009. The entire list, including the estimated heights, is available here. Parks are coded with Retrosheet park codes. I excluded one park from consideration, Coors Field; its inflated line drive rate caused by the high elevation makes it unsuitable for this study.
Then I calculated line drives per total air balls (flies, liners and pop-ups) as per the batted ball data available from Retrosheet from 2005-2009. Those data are based on the observations of MLB Gameday stringers. To avoid having a league bias, I removed all at-bats from pitchers. And because a team often uses the same hitters over a period of years, I looked only at the visiting team batting. Yes, there may be some persistence of pitcher line drive rates across seasons, but it’s a minor effect compared to the persistence of hitter line-drive rates.
We do in fact see a slight correlation between press box height, about .16, after weighting for the number of years a park was in use during the sample:
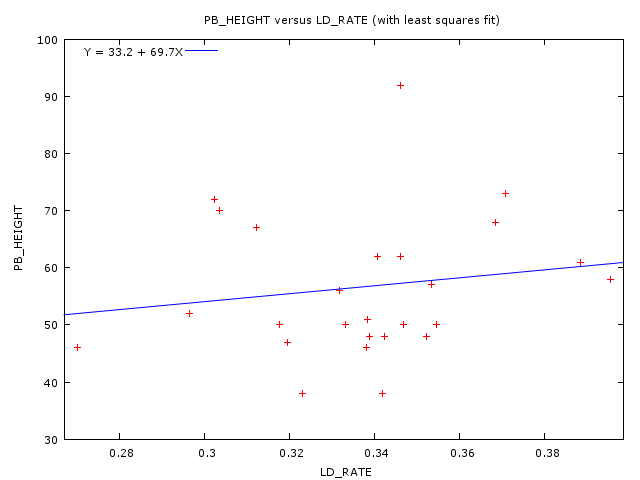
(Each park gets its own data point, but the correlation—and the linear trend line—are based on the weighted data.)
If that’s all there was to it, we could probably table the matter as perhaps real but not especially significant. But let’s focus on the extreme parks a minute—those 40 feet or lower and 70 feet or higher:

The blue-coded points are parks that are either extremely low (the Oakland Colliseum and Shea Stadium) or extremely high (Fenway Park, Turner Field, PNC Park and Citizens Bank Park). They don’t seem to follow the trend line at all; they actually seem pretty centered on the median. My hunch is that in those parks, scorers aren’t relying on their view from the press box. Instead, they are looking at the TV feed. If we look at the trend with those parks excluded, the relationship becomes much stronger, with a correlation of .38:
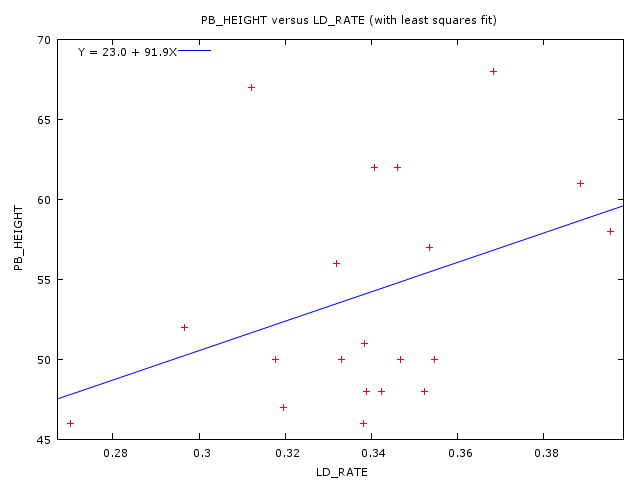
Running a regression analysis, we see that a change in observer height of one foot is worth nearly .002 points of line drive percentage. That’s a significant effect, for my money.
The implications
So far we’ve looked at a theory about how batted balls are observed and provided some evidence to support the claim. What are the implications, if this theory is true?

The professional data providers, BIS and STATS, certainly should provide better data than what the Gameday stringers provide; they take more care with the data, provide cross-checking, etc. But they are still unable to provide a consistent point of observation in every ballpark. (STATS uses a primary scorer in the press box; BIS has no in-park scorers but relies on video feeds.)
The implication of this is that we could see an effect where fielders are over- or underrated by defensive metrics based upon that scoring data, even over a period of years, because of an error introduced by a persistent bias. What I can’t tell you—at least not without a lot more study—is which players, by how much or even the magnitude of the potential effect.
This isn’t a repudiation of current defensive metrics, mind you. But people get the impression that they are based on a cold, calculating computer. But all current means we have of measuring defensive impact are based on human observation. We don’t have a perfect means of evaluating anything— hitting, defense or pitching. It doesn’t mean we don’t strive for perfection, though.
References & Resources
For those who are interested, the full regression is:
LD_RATE = 0.253415 + PB_HEIGHT * 0.00157926
The standard error of the coefficient is 0.000403918, with a p-value of 0.0002. This indicates that the results are, at least, statistically significant. All graphs and regressions were done with gretl.
This article would not have been possible without the help of Greg Rybarczyk of HitTracker. He spent a lot of time helping me figure out the park measurements necessary to calculate the press box heights, and even provided some himself. I owe him a great debt.
Special thanks also to Chris Dial, Larry Mahnken, Cory Schwartz and Ben Jedlovec for their assistance in researching this article.
Also essential to the project was Google Earth and Panoramio. Admittedly it feels a bit like swatting a fly with a hand grenade—millions in taxpayer dollars, an entire space program supporting a constellation of satellites, and I’m using it to figure out scorer bias in line drives.
Some other helpful resources:
Photo of Wrigley Field pressbox courtesy of pedalfreak and released under a Creative Commons license. Photo of Citi Field press box courtesy of kenyee and released under a Creative Commons license.
The information used here was obtained free of charge from and is copyrighted by Retrosheet. Interested parties may contact Retrosheet at “www.retrosheet.org.”
For those curious—the pictures of the gas gauge come from my car, an ’07 VW Rabbit.
Good job Colin. This is top notch investigative journalism. I knew there were differences specific to park but I never thought of press box location as being a factor.
I agree with Sean. Great job Colin, I would never have thought of this.
I’m not sure on what basis this claim is made. As someone who actually does datacasting for MLBAM, I can assure you that MLB takes as much (if not more) care with the data, cross-checking, etc.
On a separate note, is it possible to see the identity of all of the parks on the graphs?
So if you make a scatter plot, then remove the points that don’t fit the correlation you want to find, you find a correlation with an R^2 so low that you don’t report it!
Brilliant! Where can I order the book!?
I’m not understanding, dzop. By my reading, the R^2 with all the data was 0.18, and 0.38 with the extremes removed. The reasoning for removing the outliers seems plausible. It’s probably worthwhile to ask some observers at those parks whether they really do rely on TV feeds.
dzop, I report the R in the article. The equation to compute R-squared from R is:
R^2
Since I don’t want to strain you any more than I already have, I’ll report that:
.38^2 = .14
If instead you want the adjusted R-squared, it’s 0.135696.
And I expressely said why I excluded the data points that I did. And I showed it both ways, so that you could make your own determination whether or not I was right to do so.
I don’t mind criticism of my work, and I do everything I can to enable criticism of my work to be made cogently – I have given you everything you need to duplicate the work yourself, including a lot of tedious original research on press box heights that I’ve made freely available here.
But please, spare me the snark about my intellectual honesty when I provided the correlation in the article!
Jeff: I have talked to an MLBAM scorer who says they do that for scoring line drives in at least one park due to the extreme height of the press box. That wasn’t entirely idle speculation on my part.
Pip – STATS will assign multiple scorers per game. BIS randomizes the assignment of scorers per game, which should eliminate individual scorer biases. Neither has to publish data in real time. Probably the best study of the differences is Peter Jensen’s.
And Gretl doesn’t let me label the data plots as you suggest. R or Excel probably would – I’ll see what I can do about that.
I think we’re missing something really important here – When do stringers move between parks?
If stringer A only scores at Wrigley field, then his perspective/parallax never changes. So he should always be judging under the same conditions.
If the ballpark moves the press box in the middle of a season, or if a stringer scores consecutive seasons in different stadiums with different perspectives (like shea/citi, oys/nys), then you might have a year-to-year issue.
but I hardly doubt there’s a contingent of mobile stringers hopping from stadium to stadium and having different judgements.
Now announcers who do jump from stadium to stadium, yes, it could affect the quality of the broadcast (that could be mitigated by good broadcasters who remember fenway is higher than citi). But overall, this should *not* affect stringers who stay in 1 park.
now, if you want to talk about multiple stringers scoring different games within the season and stringer A’s perception of a line drive differs from stringer B’s perception, then you’re on to something.
Colin,
I’m still not convinced by the 20 point sample size. There are three influential points that basically determine the entire equation (not sure which parks they are, but the one in the bottom left and the two on the far right of your final plot). I also think it’s a bit arbitrary how you removed press boxes at 70 feet but not at 68. The 90+ ft press boxes and those below 40 are clear outliers, but why discard the 70s and not the 68s?
Even if you leave them in (the first plot), the two or three x-axis outliers are heavily influencing the line. There are a thousand other variables (individual scorer tendencies being the main one that comes to mind) that could affect those two or three points dramatically.
Ben
Colin,
I am also a datacaster for MLBAM. I work in Pittsburgh and have done at least half of the games during the period you referenced although I have had two different partners during that same period. I was intrigued to see we sit in the highest press box in MLB. I knew it was high but wow! If it helps, we have an assigned seat for PC connection purposes in the top row of the press box so if your measurement is to the start of the press box we are probably another 15 feet higher.
I second Cory’s post in that we work with someone who is watching on TV as well as, in our case, sitting next to the STATS rep. However, I would not make too much of that as I would say that no more than once or twice a game do the STATS rep or I look at the flight of a ball and quizzically ask one another “line drive or fly ball?”. Cory is correct about the second and third reviews but I can’t remember the last time my night game manager asked me to change a trajectory and I can only remember one time this past season when I received an email from the next day editor that they were changing a trajectory from one to another.
As for the TV, the only reason I use it is when I need to check on a “ball in the dirt” code on a ball or strike call and that assumes I have the delay on the TV which is about 60%-65% of the time. If we are getting an in-house feed, then it matches the action and the TV is really of little help. So the calls we make are truly done based upon what we see.
Two other things to consider are experience and our instructions.
As for experience, I’ve worked with MLB since 2001 and before that with Total Sports since 1995 doing this sort of work. That may be a factor.
As for our instructions, we have a definition for each trajectory type with “hard” and “soft” qualifier codes that we use. Of course there is always the issue of interpretation of our handbook instruction between how high is a “high arc” (fly ball) versus how low is a “low flat trajectory” (line drive) but the final data that you download has been checked several times and should not be any less reliable than BIS or STATS.
I don’t mean this to belittle your statistical exercise, however, there are other factors to consider that are not reflected there.
Colin, interesting work, but this statement is entirely untrue on two points:
“The professional data providers, BIS and STATS, certainly should provide better data than what the Gameday stringers provide; they take more care with the data, provide cross-checking, etc.”
First, MLBAM is very much a “professional data provider”, in that our data is used not only in premium products on our own site, but is also distributed in real time to several major media partners. That the Gameday .xml is freely available via the Internet doesn’t make us any less professional than either STATS or BIS.
Second, our trajectory data is indeed validated as thoroughly as all of our other data: not just once, but three times: first, by a game-night manager who monitors the data entered by the stringer, second by a next-day editor who reviews trajectories against video, and third by Elias Sports Bureau. We take great care in the accuracy of all our data, including trajectories.
None of this is to say that your original premise is not true: line drive vs. fly ball is indeed a somewhat subjective distinction that may be influenced by a number of factors, not just press box height. But I disagree with your assertion that the accuracy of our quality is inferior in this (or any other) regard.
Thanks,
Cory Schwartz
MLB.com
I agree with BenJ. Also, since you’ve already identified denver as being an outlier due to altitude, perhaps other park related factors need to be factored as well. What are the other outlier parks?
Ben: Of course this isn’t meant to be the end of the discussion but the start of it. You surely have better access to the data than I do (presumably BIS keeps tracks of what games were scored by which video scout) and could do a more in-depth analysis than I’ve presented here.
Cory: I’m sorry if my remark offended you. My impression of the Gameday data was based upon this article, which says in part:
“MLB’s Gameday also tracks hit balls for use in its Gameday graphics and hit ball charts. It, too, uses a contract employee in the press box to gather the raw data. But the end use of graphical representation for entertainment purposes doesn’t require the same system of cross checks for accuracy. Cory Schwartz, MLB.com’s director of stats, says that the contract employee’s training includes methods and emphasis on obtaining the best data possible, but Schwartz realizes the limitations of having only a single uncorroborated source.”
If that’s no longer true, or if I misinterpreted what was being said, then I’m glad to have that cleared up.
Colin – This really is an original and awesome piece, and I appreciate all the work that it took to figure out press box height; however, like BenJ, I’m just not that by convinced by the results. An R^2 of .14 is really, really, low and can be affected by a few extreme data points.
Also,
<blockquote>Then I calculated line drives per total air balls (flies, liners and pop-ups) as per the batted ball data available from Retrosheet from 2005-2009. Those data are based on the observations of MLB Gameday stringers.<blockqoute>
I assume you mean GameDay right? Or does Retrosheet get their batted ball data from Gameday?
Nick – There are obviously a lot of factors affecting how many line drives are scored by stringers, not least of which being the actual number of line drives hit. There is still plenty of research left to be done here; consider it the start of the conversation, not the end of it. I’m very glad to have the participation of people like Ben and Cory in this discussion and hope that they can put their resources (more substantial than mine, presumably) toward looking into this issue.
One thing I want to emphasize here, though, is that we can empirically verify the existance of parallax experimentally, under controlled laboratory conditions. So we don’t have to ask the question of whether or not there IS a difference in what is observed based upon observer location – we know for a fact that there is. What we are interested in now is figuring out how that affects the data we get from observers of the various batted ball events (line drive outcomes are the one I chose as being the most fruitful to study, but I think another avenue deserving equal consideration is the lateral scoring of balls.)
It is possible that, in fact, the effect is inconsequential. But I think it’s a question that at least deserves serious examination, and in what I’ve been able to do in the past week or so for that end, I’ve found some modest corroboration for the idea that there is a real effect.
As for the data source – Retrosheet, from 2005 on, uses Gameday as their source for batted ball data. For other years, there are other data sources.
Oh, I agree. I think that there is definitely validity to your theory; however, given the limited (max of 30 samples) data that we are dealing with here, and one that is expected to have a bunch of other factors obfuscating the picture, I’m not sure if a regression approach is the right way to go given the data we have now.
Do you know of another way we could test the theory?
Or, if you think a regression is the right way to go (which it probably is), you should do as much as you can to normalize line drives by other possible factors that you can think of before you run the regression.
Brian – The comparison that I did of the hit ball locations from STATS, BIS, and Gameday were done a year before I normalized the Gameday data for my BZM fielding metric. The normalized Gameday data should be even closer to the pay services. Most of the problems with hit locations in the Gameday data have to do with input field diagrams that are not drawn to scale and are way too small for accurate positioning of the hit ball, not the lack of diligence of the stringer or an insufficient review process. As I mentioned at The Book blog, Ross Paul at MLBAM said that he would be making changes to the input procedures this winter, so perhaps we will see some improvements next year. There is no reason why Gameday could not provide data that are at least as accurate as STATS and BIS.
That said, parallax is a real problem. As Colin mentioned above, I think it is probably a greater problem for determining the ball’s landing position than its trajectory, particularly when one is trying to score the game from a commercial video feed. No one is going to fully trust any defensive metric until it is based on instrumentally determined hit locations rather than observational data.
Re Colin’s statement about the quality of the Gameday data in comparison to BIS and Stats, and Cory’s reaction.
I believe that it was a common perception that teams, writer and analysts were willing to pay for the BIS and Stats data because it was more precise than the freely available Gameday data. Why pay for something that I can get for free elsewhere?
However, in Peter Jensen’s work in comparing the batted ball positions of the different systems, he concluded that none are as accurate in xy position and thus also horizontal angle as we might like for detailed fielding analysis, but also that the difference between Gameday and the pay services are slight.
As provider of Gameday based statistical analysis, it would be good news to me that Gameday is even nearly as reliable as Stats and BIS.
Cory said “our trajectory data is indeed validated…second by a next-day editor who reviews trajectories against video, and third by Elias Sports Bureau”.
I download the game data the next morning. Does this statement mean that the files may be edited a day or two after the game?
Brian – I believe that Mike Fast has said that the data is corrected for errors the day after the game. When I downloaded that data, I waited several days until the games had been played before I downloaded it.
While this may not be “a repudiation of current defensive metrics”, it is a very significant criticism. Contrary to many who advocate their definitive use, defensive metrics are still along way from reliability, especially when evaluating fielders who aren’t on either extreme.
Interesting stuff. Someone should explain parallax to Chip Caray so he doesn’t call every fly ball as if it’s going to be a 450 foot home run.
Colin,
Although I agree with some of the caveats pointed out by others, this was a fascinating first look at a topic that I had never considered before. I have one additional suggestion, which might be too much work to implement.
You say this: “And because a team often uses the same hitters over a period of years, I looked only at the visiting team batting. Yes, there may be some persistence of pitcher line drive rates across seasons, but it’s a minor effect compared to the persistence of hitter line-drive rates.”
Would it be feasible to instead look at the DIFFERENCE between each team’s pitchers’ line-drive rates at home versus on the road (or perhaps the ratio)? Then you could say whether, for example, Red Sox pitchers give up unusually high rates of home line-drives relative to those same pitchers’ road line drive rates. This way differences in teams pitching staffs shouldn’t matter so much, right?
A lot of very good comments here that deserve a response. Unfortunately I’m rushing to get ready to leave town for a few days (going to the Winter Meetings in Indy.) I’ll to my best to get back to some of these concerns and suggestions later on in the week.
This is an interesting problem, but it seems to me that the answer to identifying line drives and fly balls will soon be available, if not already. The pitch f/x data is widely used, but can’t the hit f/x data be used for exactly this purpose? If you know the speed and angle of the ball off the bat, it should be easy to categorize a ball in play. On a related note, it seems as if this data would be useful to the various fielding metrics as well.
Jeremiah,
Ideally, yes. Realistically, no. A couple studies from this summer illustrate that the spin of the batted ball has a great impact on where it ends up, and spin is something Hit F/x won’t pick up. I forget the exact numbers, but a ball with backspin can go dozens of feet further than a ball with top spin even when they have the same initial trajectory. We still need to know the landing point, or at least an approximation of it.
This is such a great resource that you are providing and you give it away for free. I love seeing websites that understand the value of providing a quality resource for free. It’s the old what goes around comes around routine. Did you acquired lots of links and I see lots of trackbacks?
US auto insurance directory
I have been marked with capital letters, the points are worth and the number of times that occur in the set of Scrabble tiles (for English), but I wonder if there is a more useful way to classify http://www.turbochargerpros.com/chevy_turbocharger.html chevy turbo </a> Wordnik here.
By means of our reading, the actual R^2 considering the data seemed to be 1.19, as well as 2.38 while using two opposites eliminated. The thinking with regard to detaching the outliers seems possible. It’s likely worthwhile to question a number of experts on those people recreational areas whether they do trust in Television for computer for.
Auto Insurance Quotes
Excellent points altogether, your blogs just gained one more reader.Vince Hotel
Great post, Best way to discuss and express the matter,Any new Updates After This.
Great post, Best way to discuss and express the matter,Any new Updates After This.penny auction sites