In the PCL, All the Ground Balls Have Eyes

Eric Campbell’s PCL success hasn’t translated to the majors yet. (via slgckgc)
“Anybody can hit in the Pacific Coast League. The stats players put up there don’t matter.”
How many times have you heard that from broadcasters, or columnists, or Twitter? There is a healthy skepticism of any player with a strong batting line in the “hitters haven” we call the Pacific Coast League. Although a mental adjustment does need to be made –- it is Triple-A, after all –- there is much that can be gleaned from those slash lines.
As it turns out, when people say Las Vegas is a hitter’s paradise, they’re right, but for the wrong reason. It’s not because the low humidity and high altitude makes the Pacific Coast League parks into power-friendly launching pads; it’s because those same conditions make infields a BABIP-friendly track meet.
…
The common knowledge about the Pacific Coast League is that it’s a great league for power. The hot, dry climate and high altitudes cause breaking balls to stop breaking and allow hitters to knock the ball out of the park at will, turning journeymen like Eric Campbell into Babe Ruth. If you were to look only at the slugging percentages of these otherwise ordinary players, you might be convinced.
Campbell has a career .489 slugging percentage in Las Vegas (895 plate appearances) and only .312 in the majors. And he’s not the only one. The list goes on and on with the likes of Johnny Monell, Darrell Ceciliani, Matt Den Dekker and Omar Quintanilla nearly doubling their slugging percentages in Triple-A. When Mets360 did some research back in 2013 comparing statistics between the Mets and Triple-A Las Vegas, he found that the players could count on the following reductions in their slash line figures: batting average 26 percent, on-base percentage 19 percent, and slugging average 30 percent.
But despite the high slugging percentages, it’s not home runs that are driving those figures. Las Vegas’s most prolific slugger, the hulking Travis Taijeron, has only 44 home runs in 810 plate appearances. Despite slugging .489, Campbell has only 21 home runs in in 852 at-bats for the Las Vegas affiliate. Wilmer Flores hit home runs in the majors (25.9 AB/HR) at nearly the same rate as in Las Vegas (23.0 AB/HR). This remains true for the team averages as a whole.

The 2015 and 2016 Mets actually hit home runs at a faster rate than their Las Vegas counterparts. Granted, there are many factors at play here (e.g. rising major league home run rate, better Mets teams) but the Pacific Coast League is not Coors Field from the ’90s. In 2015, the AB/HR rate for major league baseball overall was a nearly-identical 33.7.
The similarity to major league rates is not limited to home runs – the same pattern holds true when we look at isolated power (ISO).
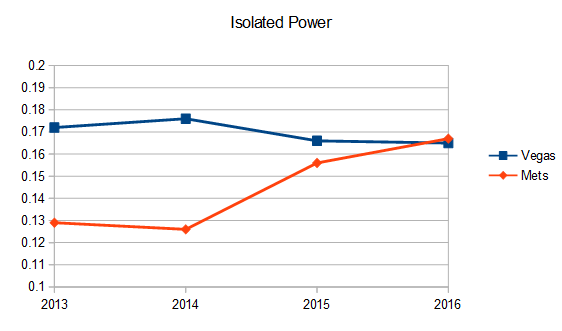
The competitive Mets squads from 2015 and 2016 have posted ISOs in the .150-.170 range, which is only slightly below that of the Vegas squad. Major league baseball as a whole had an ISO of .163 this past season and .150 the season before.
…
We’ve believed the launching pad theory because it is true that higher temperatures do tend to correlate with higher run scoring and longer fly ball distances. Thanks to Dr. Robert Adair, we know that an extra 10 degrees of temperature is shown to add four feet of distance to a fly ball that would otherwise have gone 400 feet. Slightly thinner air at high altitude also helps baseballs fly longer, but low humidity actually has little effect (drier balls fly further, but carry longer in more humid air).


The average high temperatures in Las Vegas are high, no doubt (averaging 103 in August). But they are pretty high in New York, too, where the average August high is 82 degrees; a difference of only eight feet. Eight feet is certainly relevant, but it’s merely one factor among many. Other facts, such as field dimensions, can have just as strong an effect.
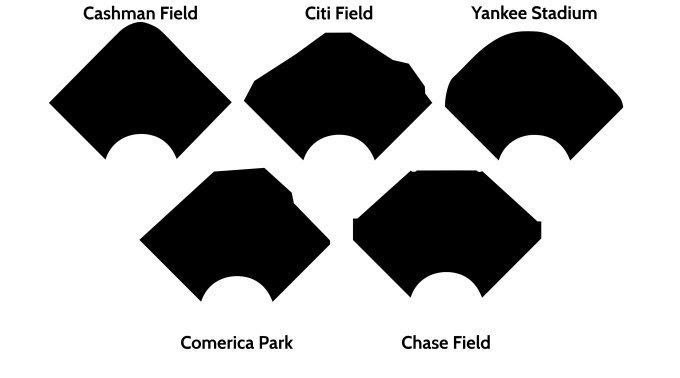
The Las Vegas 51’s play in a silo, with a center field deeper than all of the stadiums in the major leagues besides Houston’s Minute Maid Park. Friendly power alleys mean Cashman Field is actually smaller by square footage than Citi Field (thank you to Andrew Perpetua for the research and the below image) but the average-depth corners and high fences mean it is no bandbox.
Thanks to research by Baseball America and MiLB.com, we know that home runs are boosted slightly in the PCL. But if you’re outside of Albuquerque (29 percent increase) or Omaha (26 percent increase) the effect is less dramatic than you think. MiLB.com determined that Las Vegas’s Cashman Field increased run scoring by 13 percent but home runs by only 4 percent, while Baseball America ranked Cashman Field in the 83rd percentile for home runs. For the Mets, this is not the primary reason that position players struggle so mightily in the major leagues.
Note: The “Pacific Coast League effect” is particularly pronounced for Mets prospects, as the Mets Double-A affiliate, the Binghamton Mets, play in a pitcher-friendly stadium (NYSEG Stadium) in a pitcher-friendly league (Eastern League).
…
So if it not just home run power, then what accounts for the difference? And is there any way to distinguish legitimate hitters from Las Vegas mirages?
The difference can be found in the most basic baseball statistic of them all: batting average. More specifically, it is the Pacific Coast League’s sky-high batting average on balls in play. The team BABIP in Las Vegas is consistently 50 points higher than it is on the New York Mets or in major league baseball in general.
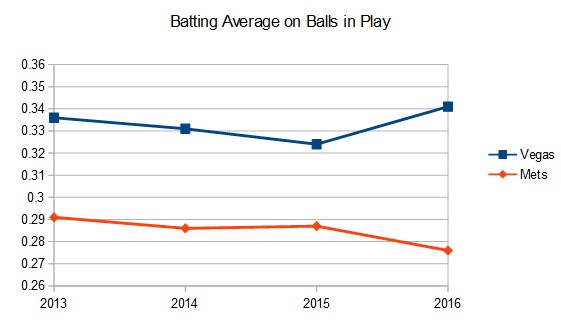
The BABIP in the major leagues this past year was .300. In 2015 it was .299. The year before that it was .299. BABIP will fluctuate slightly over the years and among parks based on many factors (e.g. field conditions, trends in baseball), but make no mistake, it’s consistent. The BABIP for the major leagues in 1935 was .295.
…
So, when people say Las Vegas is a hitter’s paradise, they’re right, but for the wrong reason. It’s not because the low humidity and high altitude make PCL parks launching pads; it’s because those same conditions make infields a track meet.
This is not a complex or revolutionary study, but I was surprised how rarely people acknowledged BABIP, rather than power, was the source of the inflated statistics. Most mentions of Pacific Coast League performance are simply accompanied with disclaimers that the statistics are “inflated,” while writers wonder aloud how they will translate back to the major leagues. Baseball America is one of the few outlets to mention that the PCL’s fast infields and spacious outfields make it just as friendly for base hits as it is for home runs.
Other recent acknowledgements have come from unlikely sources. A former Mets farmhand, Matt Bowman, talked to “>FanGraphs about how Las Vegas had “one of the driest and hardest fields” and how that affected his pitching. Meanwhile, on a trip last year to Arizona, Mets color broadcaster Keith Hernandez also complained about the fast, dry infield. His intuition served him well: the D-backs are fifth in BABIP in the last five years, despite placing 13th in line drive percentage (they also have a below average HR/FB rate).
…
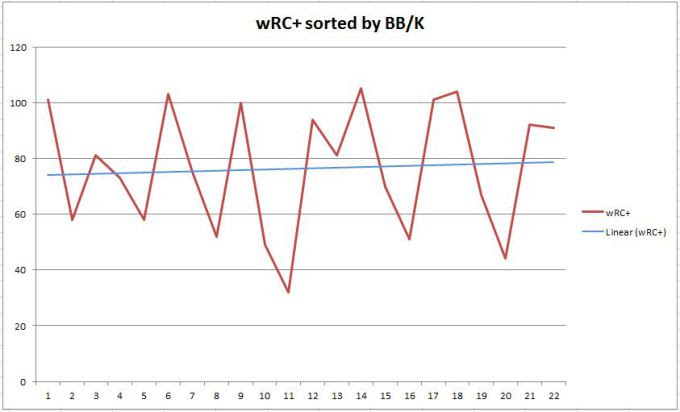
I made an initial attempt to glean something useful from Las Vegas statistics a while ago (which you can read by clicking here) and what I found surprised me: strikeout rate and walk rate in Las Vegas had little or no correlation to success in the major leagues.
Given how important plate discipline is in the majors, this finding was difficult to process (and research into this is still sorely incomplete). However, given what we know about the value of batted balls in the Pacific Coast League, it is possible that it makes sense. The value of a walk is not static, it changes depending on the present base-out state as well as the overall offensive level of the league. In a high-offense league with an elevated BABIP, the value of a batted ball goes up, as there are more runners on base and more chance your sharp grounder will sneak through for a hit or your liner will shoot the outfield gap. Better hitters may, as a strategy, eschew walks in favor of slugging the ball.
Furthermore, if infield conditions are uniformly much more favorable in the Pacific Coast League, batted balls are going to have different distributions of values. Sharp ground balls are more likely to be hits than in the major leagues, but fly balls are largely unaffected. In Cashman Field, balls may be more likely to ricochet off the wall and contribute to BABIP rather than be caught or leave the yard.
The other discovery from my initial research pertained to ISO, and how it actually did correlate well with success in the major leagues.
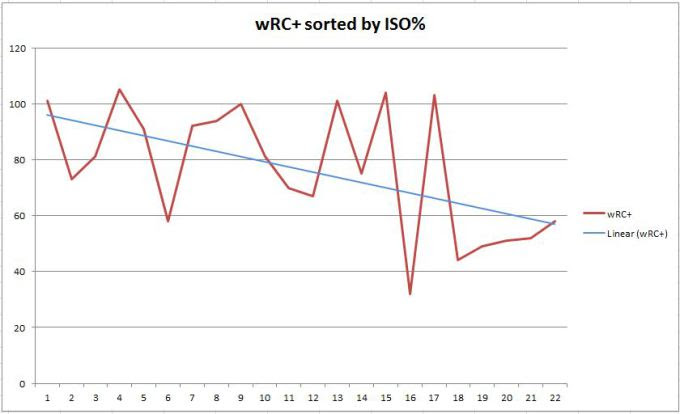
By stripping away the effect of BABIP on a player’s line, we can get to one of the very few unadulterated measures of talent in the Pacific Coast League.
…
If this is correct, we can begin to formulate what an archetypal Las Vegas mirage might look like. This player would avoid strikeouts, walk often, and hit a disproportionately high percentage of sharp ground balls and line drives. The mirage doesn’t have home run power that would translate to the majors, but puts up a strong OBP and SLG thanks to the walks and the BABIP. The mirage is, of course, Eric Campbell.
I don’t intend to pick on “Soup” Campbell, but he’s such an excellent example of all of these above factors: 1) he has a 1.02 K/BB in Las Vegas, with a very low strikeout rate of only 17.1 percent, so he benefits from putting the ball in play, and 2) he has a career 51.4 percent ground ball rate in the major leagues and a strong exit velocity, but has only a 27.1 percent fly ball percentage and paltry 8.1 percent HR/FB rate. Campbell’s career Las Vegas line of .323/.432/.489 is despite a very strong .369 BABIP yet has resulted in only a .166 ISO. This is not to say that Campbell cannot be a major league caliber player, because he may be. It is to say that he receives an outsized benefit from the Pacific Coast League conditions relative to players with other skill sets.
It is possible to contrast the performance of Campbell with contemporaries like Wilmer Flores (.321/.360/.542, .222 ISO, .341 BABIP) and Michael Conforto (.422/.483/.727, .305 ISO, .446 BABIP). Flores and Conforto were hitters in Las Vegas whose walk rates did not decrease in the major leagues (Flores: 6.0 percent Triple-A, 4.8 percent majors; Conforto: 9.1 percent Triple-A, 9.8 percent majors) while Campbell’s decreased almost 50 percent. Even if you were to normalize Conforto’s BABIP, his ISO figure makes it clear that his batting lines were not simply the product of the conditions in Las Vegas.
…
A quick-and-dirty way of evaluating a Pacific Coast League stat line would begin by adjusting a player’s BABIP based on what you know about his batted ball profile. A simple proxy might be using his minor league BABIP to date. For instance, Ty Kelly slashed .328/.413/.435 in Las Vegas last year with a .107 ISO and .383 BABIP. His career minor league BABIP is .320. Therefore, given his very low isolated power, Kelly’s full-time major league line might look closer to .260/.340/.370.
A modest counter-point may be found in TJ Rivera, who slashed .350/.394/.513 with a .163 ISO and .381 BABIP. Even though Rivera’s BABIP in the PCL was high, it was near his career minor league figure of .361. Rivera won’t walk so much, but his decent ISO and strong average even after adjusting his BABIP means that he might have a chance of hitting in the majors.
A study like this gives me hope for a player like Dilson Herrera, who “struggled” to a .274/.335/.456 line last season between the PCL and the International League. However, Herrera’s overall line of .297/.357/.480 in Triple-A is accompanied by an almost-ordinary .339 BABIP, nearly in line with his overall minor league BABIP of .347. Coupled with a strong ISO (.183) and strong walk rates (8 percent), Herrera has a profile that will carry over to the major leagues, if he’s healthy.
To do the rest of this work requires a lot more data than I have at my disposal, and I am hopeful that someone will take up the next steps. This hypothesis could be proven/disproven with players’ batted ball rates in the PCL, swing rates between Double-A and Triple-A, and perhaps even run values for particular exit velocities and launch angles. This is just a start, but there is valuable information to be found in these statistics. We need to figure out what, why, and what it means.
References & Resources
- FanGraphs
- BostonBaseball.com, “The Physics of Baseball”
- Matt Eddy, Baseball America, “Minor League Parks Drive Performance”
- Scott Lindholm, Beyond the Box Score, “Hitting and temperature”
- Sam Dykstra, MiLB.com, “Toolshed: Evaluating Triple-A park factors”
- Adam Rubin, ESPN.com, “Will Michael Conforto’s Triple-A success translate to majors?”
- Matt Eddy, Baseball America, “The Baseballist: Most Extreme Ballparks in the Minors”
- David Laurila, FanGraphs, “Matt Bowman on Leaving Las Vegas (for St. Louis)”
- Brian P. Mangan, Read Zone, “How to Evaluate Mets Prospects in Triple-A Las Vegas”
- Matt Hunter, FanGraphs, “Joey Votto and the Value of a Walk”
The average high temperature for Las Vegas may be 102 F as the article states, but virtually all games played in Vegas are played at night as is the case for most minor league teams, and in the desert the temperature drops sharply after dark. The temperature when teams are actually on the field in Vegas will be significantly lower than the average high temperature there.
You are absolutely right — the variance of temperature in Vegas is indeed greater than it would be in a coastal city. I considered mentioning that, but I didn’t want to overstate my case.
A more up to date reference for effect of altitude and temperature on fly ball distances is this article from last year, based on my analysis of 2015 Statcast data. http://www.hardballtimes.com/going-deep-on-goin-deep/. Adair’s numbers are based on his model created long before we have had data to validate it.
Alan, this is absolutely remarkable research. I’ve only skimmed it for now but with your permission I’d like to incorporate it in to Part 2 of this series. (I don’t think I can edit this post). Or perhaps we can try writing something together.
Brian….of course, you are free to use anything in that article, since it’s in the public domain. At the moment, I am very over-committed so I can’t promise doing anything together.
You are quite correct that the increased BABIPS at higher elevations does much to drive the offense. However, try to not consider BABIP as one stat because balls on the ground have a totally different set of properties than those in the air.
Balls carry further at higher elevations, and to counter this many parks move the fences back. This also usually causes the outfielders to play deeper, allowing more balls to fall in front of them. Many teams also try to limit opposing home runs by employing ground ball pitchers, who also get a higher percentage of balls in the air at low angles. They end up getting singled to death.
For a ball on the ground to get through to the outfield for a hit, it helps to be struck sharply, be in a hole, and be on a fast turf. Dry climates tend to have harder infields and thus more ground ball hits.
Las Vegas qualifies on both of these. There are 16% more ground ball hits than the rest of the PCL. 5% more balls in the air to the outfield fall in for hits. It is a good homer park if you pull the ball. 117 to LF, 77 to CF, 110 to RF, compared to the rest of the PCL.
One final note – there’s two halves to the PCL. The American Conference includes most of the old American Association teams, several east of the Mississippi, and they are all “normal.” The Pacific Conference has all of the high and dry parks of the western mountains and many are quite extreme. Each team plays both home and away vs opponents in their own conference, but only home or away, rotating each season, vs teams in the other conference. Therefor, Pacific teams play 2/3 of their games every year in Pacific parks, while American teams play 2/3 of their games each year in American parks.
The jays had the aaa team in Las Vegas before the Mets, I assume the same relationships held for them? I saw a game in July 2011 in that park. Centrefield is huge with high fences, it definitely held at least one ball in (brandon belt hit it I think).
Hard dry infields sound a lot like astroturf. I’d be interested in how astroturf played over the years. Maybe fielders in the pcl simply aren’t playing deep enough, fooled by the grass.
As far as MLB BABIP being consistent throughout the ages (1935 being cited as proof it has) , BABIP was consistently much lower from late 1930’s up till the so called steroid era when it hovered between 270-285.
There was a large jump in BABIP from 1920 that lasted to 1938 that was comparable to the 1993-2016 era. In both eras it was likely the ball that accounted for the jump
While black accents are placed on the inner bootie construction, pull tabs and carbon fiber shank. Matching laces, 1cent logos and a translucent outsole finishes the overall design.