How Speed Affects Isolated Power

Billy Butler and Ben Zobrist had a very different mix of hits (pics via Keith Allison).
People define a hitter’s power in many different forms, with Isolated Power (ISO) being a fairly common method. Isolated Power looks at the bases beyond first base that a player gets per at bat. While how far and hard a player hits a ball factors into his ISO, so does speed. If a player is able to turn a hit into the gap into a double or a hit to the wall into a triple, that depends a lot on his legs. I was able to find out how much speed factors into a player’s ISO value.
Let’s start by looking at two players.
| Butler vs. Zobrist Comparison | ||||||||
|---|---|---|---|---|---|---|---|---|
| Player | AB | PA | H | 1B | 2B | 3B | HR | ISO |
| Billy Butler | 582 | 668 | 168 | 126 | 27 | 0 | 15 | .124 |
| Ben Zobrist | 612 | 698 | 168 | 117 | 36 | 3 | 12 | .127 |
Watching each play last season, Butler seemed like he hit the ball harder and further. The ISO values seems to say otherwise. Each player had 168 hits and while Butler was able to hit three more home runs, Zobrist had nine more doubles and three more triples. Here is their ISO split apart into the double, triple and home run components. With inside the park home runs so rare, just the effect of extra doubles and triples can be changed by a player’s speed.
| Butler vs. Zobrist Comparison | |||
|---|---|---|---|
| Player | 2B & 3B ISO | HR ISO | ISO |
| Billy Butler | .046 | .077 | .124 |
| Ben Zobrist | .069 | .059 | .127 |
Even though the players had almost identical ISO values, Butler’s is home run driven while Zobrist’s comes largely from doubles and triples.
To show the difference in speed, here are Butler and Zobrist hitting balls into the outfield gap.
While the hits aren’t exactly the same, the difference in player speed is plainly obvious. Butler took about 6.3 seconds to get around first base. Zobrist was standing up at second in 8.4 seconds.
I wanted to find a good and easy rule of thumb for showing how much Zobrist’s speed contributed to his power. I cut and diced the data a hundred different ways. I need to find how I tried to use the ratio of singles to doubles and doubles to triples to measure speed. I had in my mind this was the best method. In the end, the main issue ended up being not enough triples. I tried adding stolen bases, nothing. I was trying hard to stay away from Ultimate Base Running or Speed Score because of the complexity in calculating the values. But I eventually had to give and found a workable solution.
Some really not so gory math:
From the past 12 seasons, I took all the players with a minimum 400 plate appearances and grouped then by Speed Score. The Speed Scores were then grouped into different buckets, 0 to 1, 1 to 2, 2 to 3 and so on. Initially, I didn’t want to use Speed Score because one of its five inputs is triples and I worried about too much overlap. Eventually, it was needed to find a solution.
I averaged the bucketed players’ doubles and triples2B&3B ISOs to get the following results:
| Speed Score Effects on ISO | ||||||||
|---|---|---|---|---|---|---|---|---|
| Speed Score Range | Avg. Speed Score | 2B & 3B ISO | ||||||
| < 1 | 0.8 | .064 | ||||||
| >= 1 and < 2 | 1.6 | .073 | ||||||
| >= 2 and < 3 | 2.5 | .079 | ||||||
| >= 3 and < 4 | 3.5 | .083 | ||||||
| >= 4 and < 5 | 4.5 | .087 | ||||||
| >= 5 and < 6 | 5.4 | .089 | ||||||
| >= 6 and < 7 | 6.4 | .094 | ||||||
| >= 7 and < 8 | 7.5 | .100 | ||||||
| >= 8 | 8.3 | .107 | ||||||
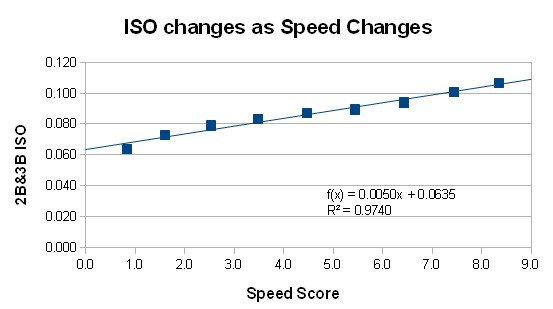
So for every increase or decrease in a player’s Speed Score by one, a hitter’s doubles and triples ISO changes 0.005 on average in the same direction. While the player’s overall ISO should change also, his home run total may mask the speed based change.
Take Jose Reyes for example. In 2012 his ISO was .146 and it dropped to .131 in 2013 even through he increased his home run rate by more than 50 percent. The problem was a early season twisted ankle which limited his mobility. His Speed Score went from 7.1 to 4.4. His doubles and triples ISO dropped from .095 (.091 career value) to .052. So adjusting his ISO up because of the drop in speed, Reyes would see his 2013 ISO stand at .144, almost the same as his previous season’s value. Looking just at Reyes’ ISO, it may seem like he lost some power. After taking his drop in speed into account, his power stayed the same between the two seasons.
Some other players saw their doubles and triples ISO drop as they slowed down. Micheal Bourn’s Speed score dropped from 7.5 to 6.5 and his doubles-triples ISO dropped 0.011. The speed-based power drop was a little more than expected. The same happened to Coco Crisp, but his home run power spike masked the decline. Crisp’s ISO jumped from .158 to .183 while his Speed Score dropped 8.5 to 6.5. Dividing his ISO out, the doubles-triples component dropped from .085 to .054.
A player can see his ISO get pulled in two directions as his strength increases but his speed declines. To understand how each component ages, I created an aging curve with doubles and triples and home run ISO components. Additionally, I added plain old ISO.
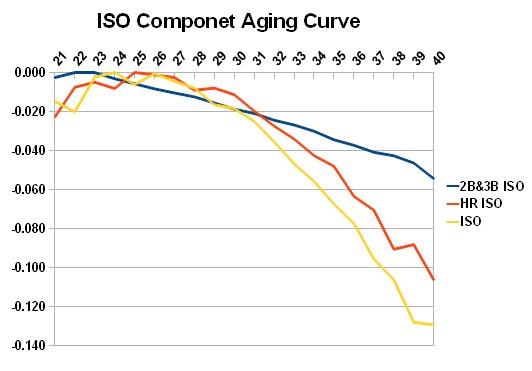
The doubles-triples component begins to age immediately. This drop is not a surprise since speed peaks in the early 20s. The doubles-triples curve then slowly begins a consistent decline. The home run component plateaus from age 22 to age 30. After age 30, home runs begins a steep descent. For example, here are the ages 29-31 home run leaders from 2008 and here is what they did in 2013:
| Ages 29-31 Home Run Leaders, 2008 | |||
|---|---|---|---|
| Name | 2008 HR | PA per HR, 2008 | PA per HR, 2013 |
| Ryan Ludwick | 37 | 6.0% | 1.4% |
| Jack Cust | 33 | 5.5% | Gone |
| Chase Utley | 33 | 4.6% | 3.4% |
| Aubrey Huff | 32 | 4.8% | Gone |
| Jason Bay | 31 | 4.6% | 4.7% |
| Carlos Pena | 31 | 5.1% | 2.4% |
| Kevin Youkilis | 29 | 4.7% | 1.7% |
Only Bay was able to maintain a constant homer rate, but the rest of his game was substandard (.298 OBP).
With players aging at a different rates, a person can use the speed component of ISO to determine if an ISO decline is power or speed related. I am going to help save the baseball world by not creating another stat to remember. There is not enough reason to adjust ISO for every player depending on his speed. Rather, it is important to remember that speed is a factor of ISO and if a player’s speed drops quite a bit, his power is likely to go down.
Going back to our original two players, Butler and Zobrist: In 2013, Zobist had a Speed Score of 4.4 while Butler was at 0.8. Butler’s Speed Score was 3.6 points lower than Zobrist’s which equals an .018 lower doubles and triples ISO. Adding .018 to Butler’s .046 doubles-triples ISO, it jumps to .064, or about the same as Zobrist’s .069 doubles-triples ISO. After adding in the home run ISO values, here is how the two compare
| Butler vs. Zobrist Comparison | |
|---|---|
| Name | Adjusted ISO |
| Billy Butler | .142 |
| Ben Zobrist | .127 |
Butler’s sloth-like speed makes it look like he and Zobrist hit at the same power level. If they both could run at the same speed, Butler’s ISO would be higher.
Isolated Power (ISO) is a decent measure of a player’s power. The problem is that there is some speed component to ISO that needs to be taken into account with extra base hits. By looking at a player’s Speed Score and the doubles-triples component of ISO, a Speed Score increase or drop by one equals a .005 increase or drop in the same direction for ISO. If a player’s power is on the decline, a person can use the information to determine if the player is not hitting the ball as hard and far or is just getting slower.
References and Resources
All data was taken from FanGraphs.com.
Great article Jeff. I have never thought about the effect of speed on one’s ISO before, and now it makes perfect sense. The 0.97 r2 value is quite a correlation as well. Good work and well written.
That has to be the highest R value I’ve ever seen in baseball statistics
Nice analysis. Thanks.
Great article. I have also thought about how speed affects ISO but in a different way. Using SB to increase a players ISO, as a SB essentially turns a 1B into a 2B and a 2B into a 3B. Adding Zobrist’s 11 SB to his extra bases turns his 2B and 3B ISO to .87 and his overall ISO to .145. However the 3 CS he had also essentially decreased his OBP from .354 to .350
Very iteresting. Howver, I feel like at some point in this you need to include batted ball data. For example, in Coco Crisp’s case you imply that his 2b/3b ISO dropped because his speed score dropped. But it seems to me that it is much more likely that his 2b/3b ISO dropped because his jumped from 2.2% to 3.8%. Afterall, the more hits that you send over the fence the fewer hits you can turn into doubles and triples.
Did you take into account the number of times each hitter was thrown out at second trying to stretch a single into a double? Just as fast runner with a lot of stolen bases might not help the team in the long run if he’s caught stealing too many times, is it also true that a slow runner who can’t stretch a single might have more value than speedier runner with more doubles who gets thrown out more often?
good point
A faster player is also going to have more infield hits, raising his BA and thus in effect lowering his Iso. IOW, I think 2B/3B Iso underestimates the effect of speed on getting extra base hits, since speed also raises the baseline that is provided by BA. The premise you tested and found support for is that the faster the player, the more often he can stretch balls hit into the OF into 2Bs (and 2Bs into 3Bs, but those are much less frequent). But infield hits reduce the number of chances for this that would be superficially apparent by looking at BA.
I have no idea how many infield hits Zobrist had during the period of analysis, but as a wild guess i would say around ten, which would add about 0.016 to his BA. This amount should in effect be added to his Iso as conventionally determined. I would guess that Butler had close to zero infield hits.
The denominator of ISO is AB, so extra infield singles won’t have any effect.
http://www.fangraphs.com/library/offense/iso/
Yes, you’re right that Iso is not affected by infield hits. My mistake there. But a fast player will tend to have more infield hits, and therefore somewhat fewer outfield hits that have the potential to be turned into extra bases. So if you have two .300 hitters, same number of ABs, and one is much faster than the other, it’s not immediate obvious who will have the higher Iso. The fast guy will stretch more hits into 2Bs and 3Bs, but he will have fewer hits of the kind that can be stretched.
i think the reason this does not seem to affect the 2B/3B Iso vs. speed score relationship is because other things equal, a faster guy will have a higher BA. That is, if you have two hitters who are equal at putting the ball in play in every respect, the faster guy will have a higher BA by virtue of more infield hits, and a higher Iso by virtue of having the same number of outfield hits, and a better ability to stretch some of them. But i think that linear relationship does mask the fact that faster guys have a slightly smaller % of outfield hits that can potentially be stretched.
ISO doesn’t measure power, it simply measures one’s ability to get extra base hits. The only reason what it is commonly used is to measure power is because it is easily accessible and understandable. However, in this day and age, when parks have hit f/x, and can analyze the batted ball, we should stop holding on to ISO as a measure of a hitter’s power, we should use it as a measure of a player’s skill in obtaining extra base hits.
Nice article. Even when comparing two players with the same speed, ISO is a massively flawed indicator. It’s always treated as if it should be linear, but it’s not. A .200 hitter will have a much, much more difficult time achieving the same ISO as a .300 hitter. Those extra balls in play the .300 hitter produces will result in many more doubles than have nothing to do with power (e.g., bloop hits, misplays not scored as errors, etc). It really bothers me when people rank by ISO players with significantly different batting averages. We really need to come up with a superior metric to measure power.
As an indicator of power I came up with including outfield flyballs recently in my fan research. I’m sure this has been suggested elsewhere and I’d hardly call it innovative but for me it works, especially as a ratio. The formula I settled on was the following:
(2*3B+3*HR+OFF)/OFF
Basically it breaks down to weighted total “power events” compared to “negative” power events… letting out 2B’s because of speed implications, which may be ultimately very subjective and unjamesian. I normalized this ratio to make it more handy in use. For 2010-2013 combined I got the following league wide top 10:
1. M. Cabrera 141.656
2.G. Stanton 133.705
3.P. Fielder 132.592
4.D. Ortiz 132.461
5.J. Votto 132.150
6.R. Howard 129.813
7.A. Pujols 129.265
8.C. Davis 126.847
9.C. Gonzalez 126.842
10.R. Cano 126.637
Lowest in was Juan Pierre with 77.179.
I used the data from fangraphs and ofcourse this measures the rate of “functional” power… pure power will remain hard to measure, if anything the best measure might be the average of a player’s longest HR in different stadiums. I’m still tinkering with the weights and different versions of the formula but I’m not convinced of any added advantages. Feel free to comment ofcourse.
Excellent work. Your top 10 corresonds very well with our intuition of who has power.
very interesting article
How do you extract the 2B and 3B ISO? I’m sure there’s a simple mathematical way to do it that I’m missing